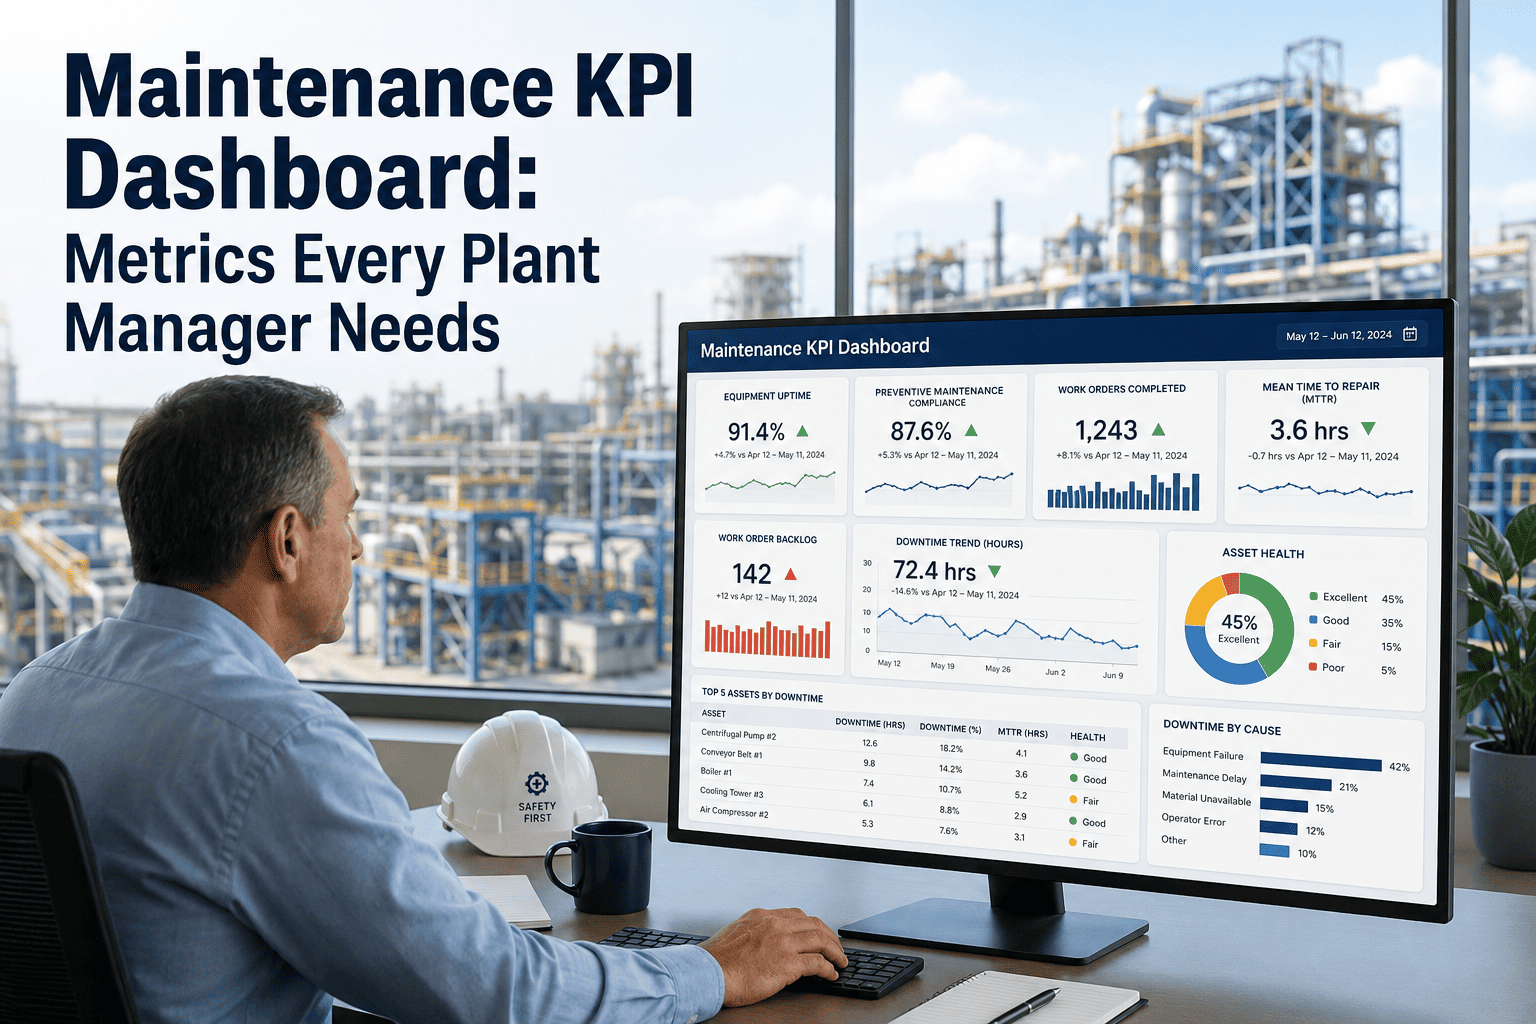
Every plant manager knows the feeling — a machine fails, production stops, and no one can explain why it wasn't caught earlier. OxMaint's maintenance KPI dashboard gives you real-time visibility into MTBF, MTTR, OEE, backlog, and asset health — so you're leading your operation with data, not gut instinct. This guide covers the exact metrics that separate high-performing plants from reactive ones, and how to track them in one unified view.
MAINTENANCE ANALYTICS
The Plant Manager's KPI Dashboard — Every Metric That Matters
From MTBF to OEE — measure what drives uptime, reduce reactive work orders, and build a maintenance operation that runs on evidence.
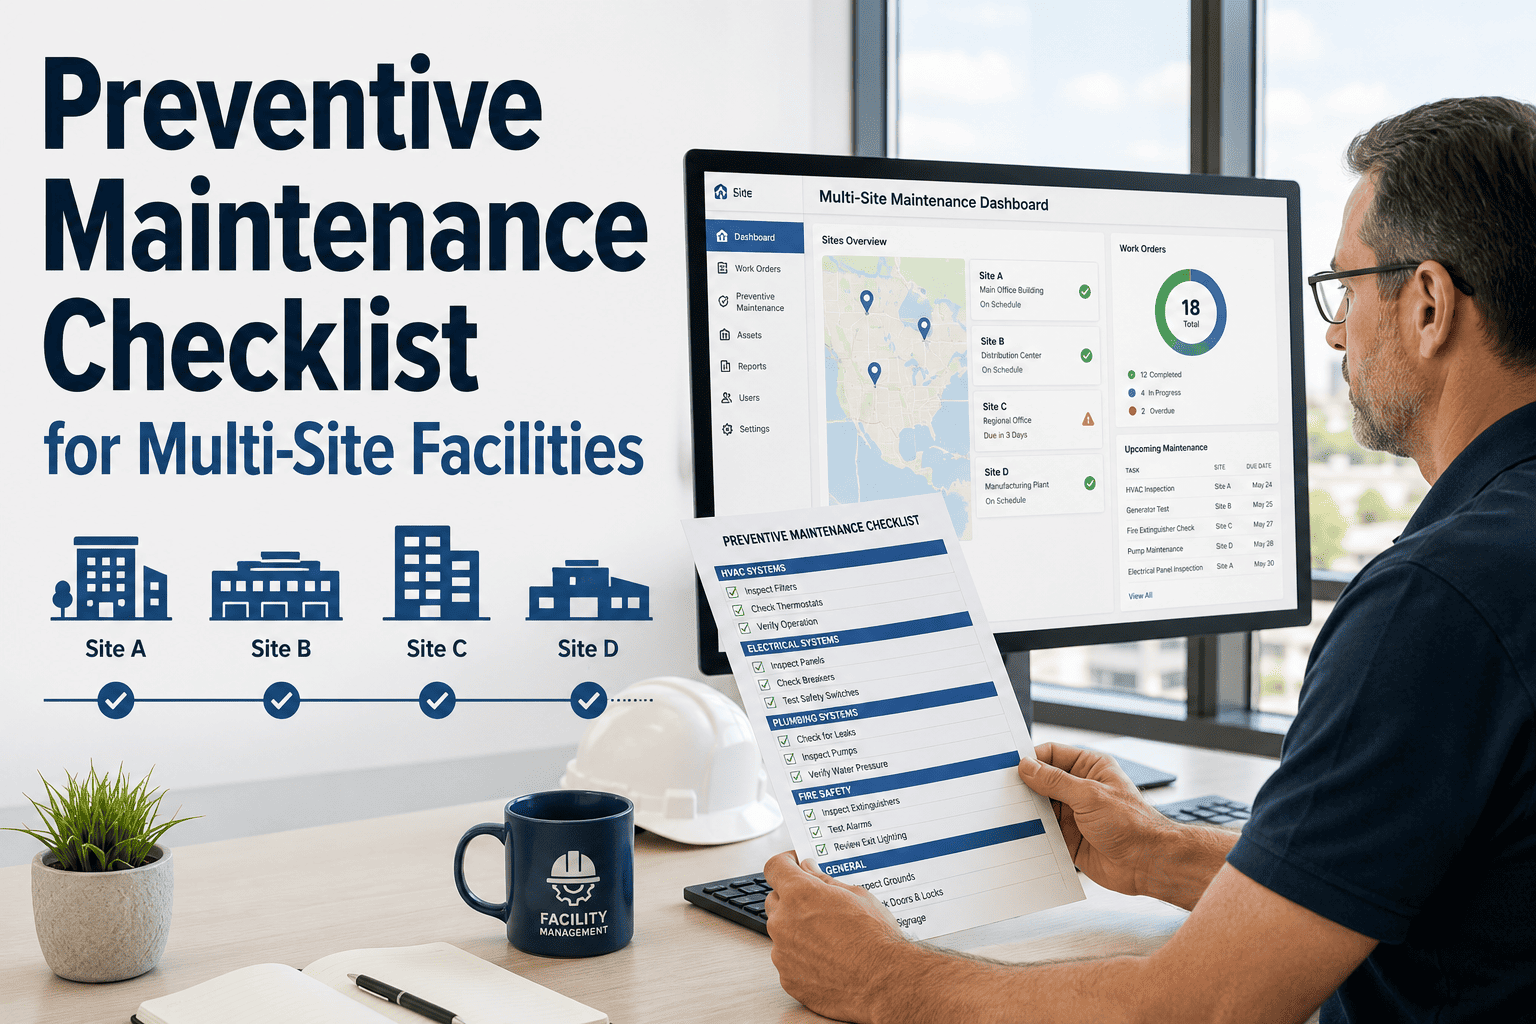
The 8 KPIs Every Plant Manager Must Track
These are not vanity metrics. Each one directly connects to uptime, cost, and compliance. Tracking even three of these consistently will change how your team prioritizes work.
01
MTBF
Mean Time Between Failures
Average operating time between asset breakdowns. Rising MTBF = better reliability. Benchmark: >500 hrs for critical rotating equipment.
02
MTTR
Mean Time to Repair
Time from failure report to full restoration. Lower MTTR = faster recovery. World-class plants target <2 hours for Tier-1 assets.
03
OEE
Overall Equipment Effectiveness
Combines Availability × Performance × Quality. Global average is 60%. Best-in-class manufacturers achieve 85%+.
04
PM Compliance
Preventive Maintenance Rate
Percentage of scheduled PMs completed on time. Below 85% signals crew overload or poor scheduling. Target: 90–95%.
05
Backlog Hours
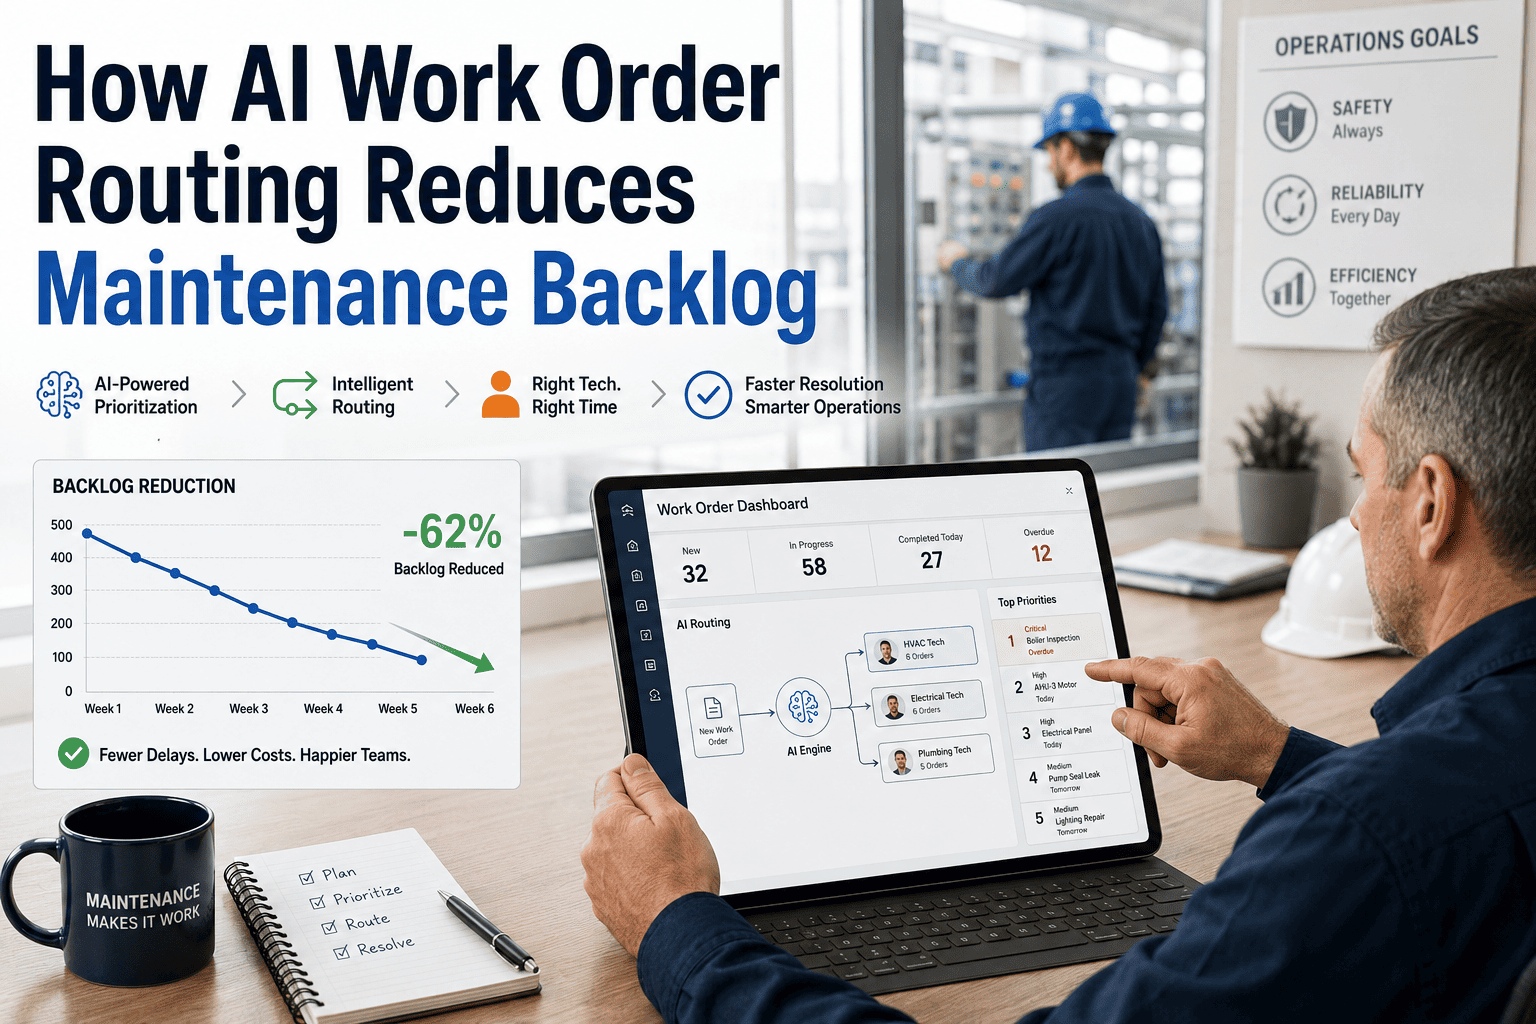
Open Work Order Backlog
Total labor hours in open, unstarted work orders. Healthy backlog = 2–4 weeks of crew capacity. More means risk is accumulating.
06
Downtime %
Asset Downtime Rate
Percentage of scheduled production time lost to unplanned stoppages. Even 1% downtime in high-output facilities costs hundreds of thousands annually.
07
Labor Utilization
Wrench Time Ratio
Actual hands-on repair time vs. total shift hours. Industry average is only 25–35%. High-performing teams push this above 55% through better planning.
08
Asset Health Score
Composite Risk Index
A combined score built from inspection results, failure history, age, and overdue PMs. OxMaint calculates this per asset, per site, automatically.
Industry Benchmarks at a Glance
| KPI |
Reactive Plant |
Average Plant |
World-Class |
OxMaint Tracks |
| MTBF (critical assets) |
<200 hrs |
200–500 hrs |
>500 hrs |
Auto-calculated |
| MTTR |
>8 hrs |
4–8 hrs |
<2 hrs |
Work order timer |
| OEE |
<50% |
55–70% |
85%+ |
Downtime + output |
| PM Compliance |
<60% |
70–85% |
90–95% |
PM completion rate |
| Wrench Time |
<25% |
25–40% |
55%+ |
Time log analysis |
| Emergency WO Ratio |
>50% |
25–50% |
<10% |
WO type breakdown |
85%
OEE is the world-class benchmark most plants never reach without KPI tracking
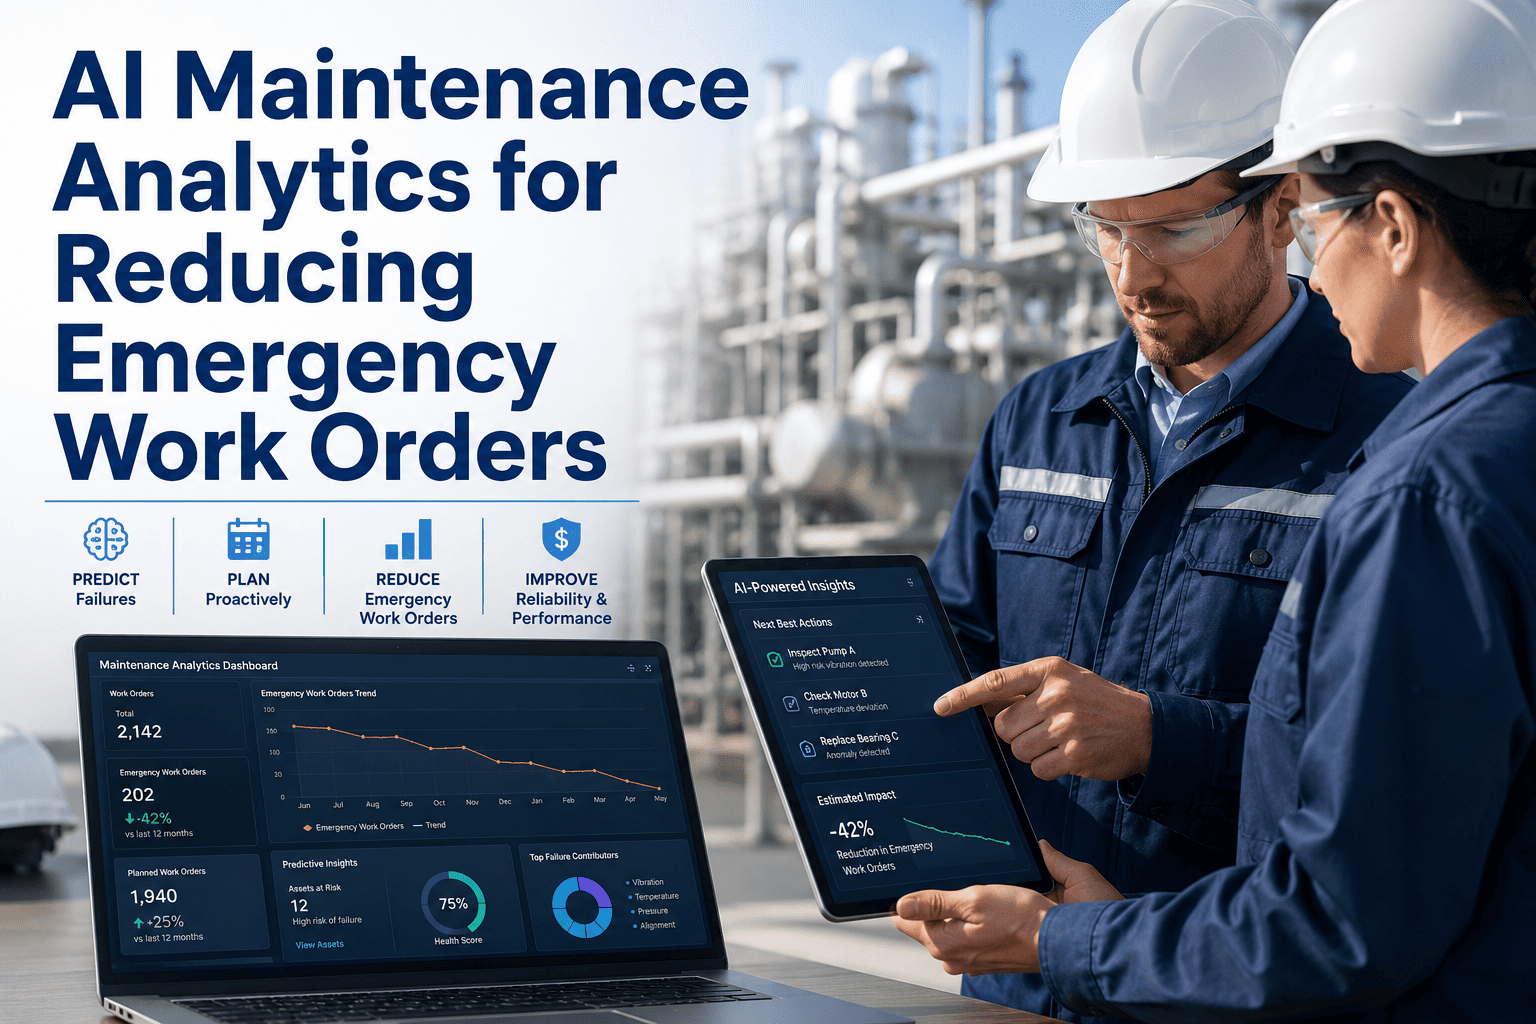
3×
more emergency work orders in plants without scheduled PM compliance monitoring
40%
average labor cost savings reported after implementing maintenance KPI dashboards
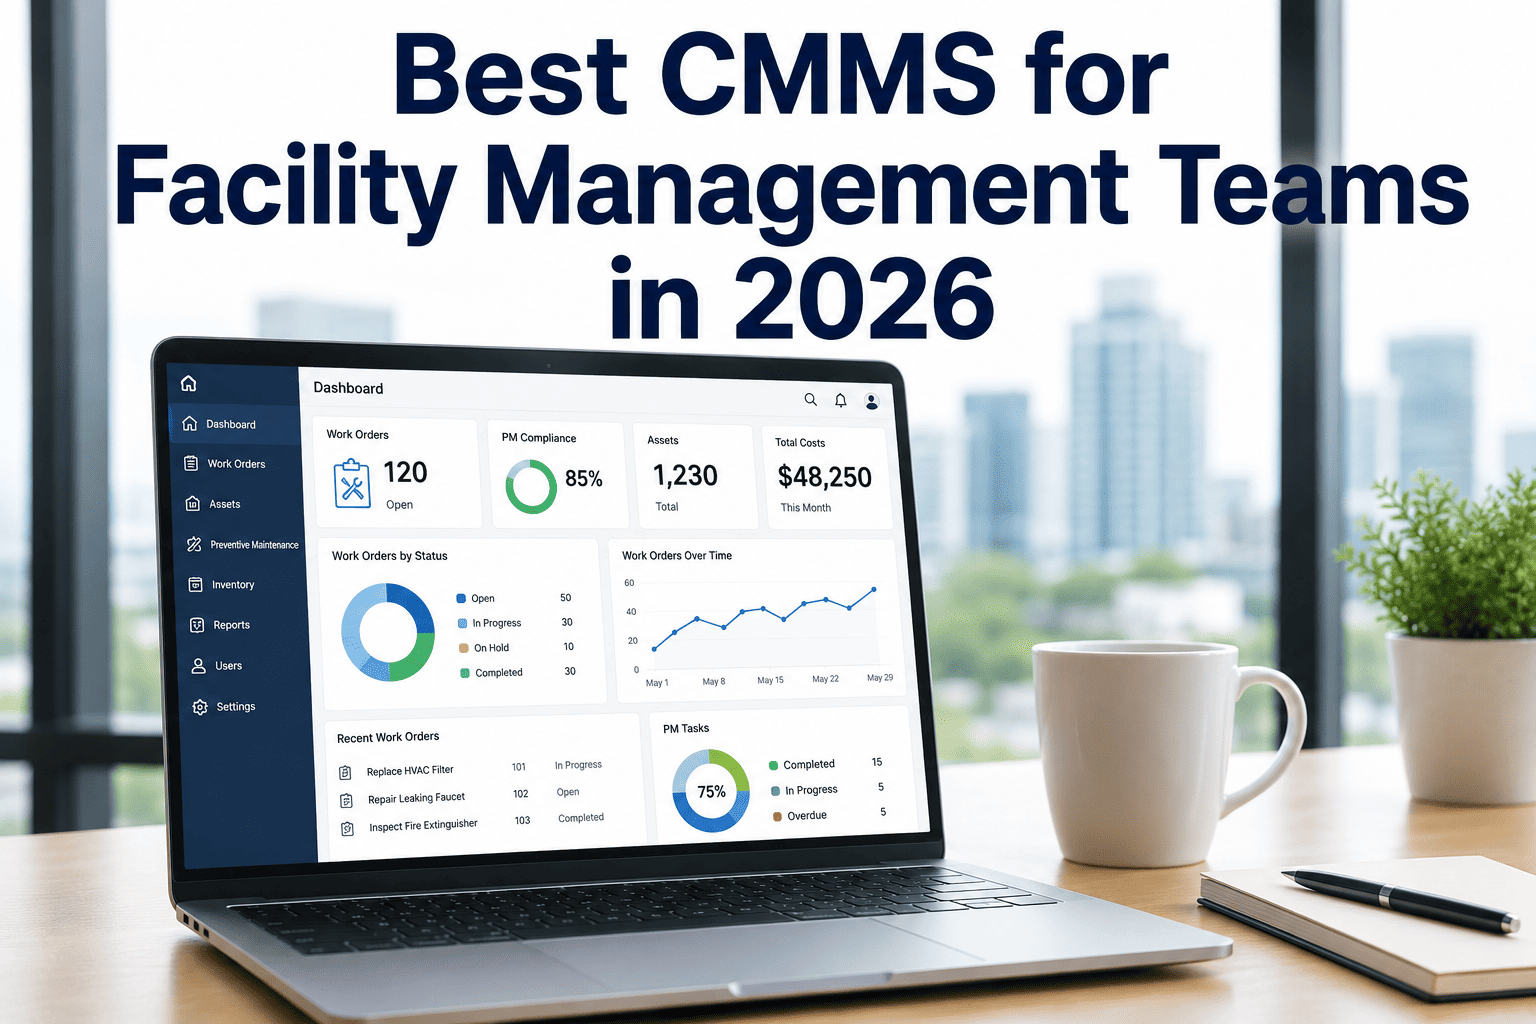
See Your KPIs Live — Not in a Spreadsheet
OxMaint surfaces MTBF, MTTR, backlog, and PM compliance in one dashboard — updated in real time as technicians close work orders in the field.
How OxMaint Builds Your KPI Dashboard Automatically
1
Technicians close work orders on mobile
Every work order closure captures time, asset ID, failure code, and parts used — the raw data that feeds every KPI automatically.
2
OxMaint calculates metrics in real time
MTBF updates with each failure log. MTTR updates when work orders close. PM compliance recalculates daily. No manual spreadsheet entry.
3
Dashboard alerts when KPIs cross thresholds
Set thresholds for each metric. When PM compliance drops below 85% or backlog exceeds 3 weeks, the dashboard flags it and notifies the plant manager.
4
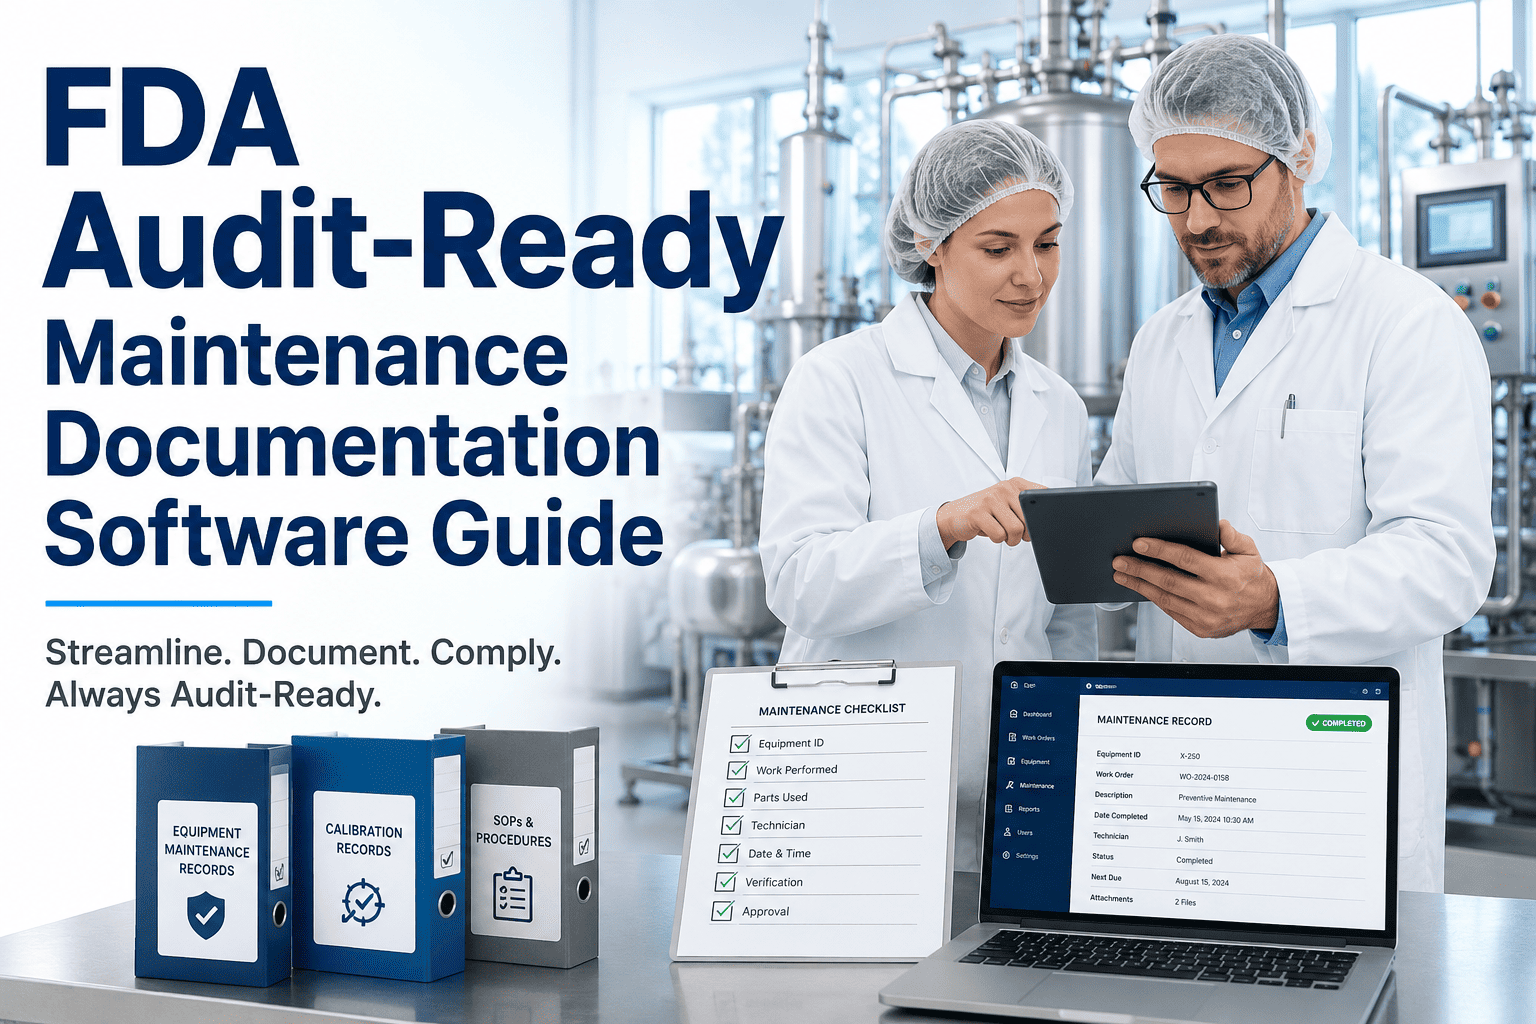
Export reports for leadership and auditors
Monthly KPI summaries, downtime analysis, and asset health reports export in one click — ready for management reviews and compliance submissions.
EXPERT REVIEW
Rajiv Menon, CMRP
Certified Maintenance and Reliability Professional — 19 Years in Discrete and Process Manufacturing
Most plants I audit track zero KPIs consistently. They have data — it's buried in their CMMS — but no one surfaces it in a way that drives decisions. The most impactful change any maintenance leader can make is to put MTBF, MTTR, and PM compliance on a screen that the whole team sees every morning. When technicians know the scoreboard, behavior shifts. Backlog starts shrinking. Emergency calls drop. It sounds almost too simple, but the plants that run best are the ones where the metrics are impossible to ignore.
Frequently Asked Questions
What is a realistic MTTR target for manufacturing plants?
MTTR targets depend heavily on asset criticality and industry. For Tier-1 production assets, world-class plants aim for under 2 hours. Process industries like food and pharma may target under 4 hours. The most important factor isn't the absolute number — it's whether your MTTR is trending down month over month.
OxMaint's MTTR tracking shows trend lines so you can see whether your repair efficiency is actually improving.
How is OEE different from simple uptime tracking?
Uptime only measures whether a machine is running. OEE measures whether it's running at full speed and producing good output — a machine can be "up" while running at 60% speed and producing 10% scrap, which OEE would capture but uptime would miss entirely. OEE = Availability × Performance × Quality, making it the most comprehensive single-number asset health metric. Plants using OEE alongside
preventive maintenance scheduling see the fastest improvement curves.
How many KPIs should a plant manager actually track?
Research on maintenance performance suggests tracking 5–7 KPIs consistently outperforms either tracking none or tracking 20+. Too few means blind spots; too many means no one focuses on the numbers that actually matter. For most mid-size plants, MTBF, MTTR, PM compliance, backlog hours, and emergency work order ratio cover 80% of what drives maintenance performance. OxMaint's dashboard is pre-configured with these core metrics from day one.
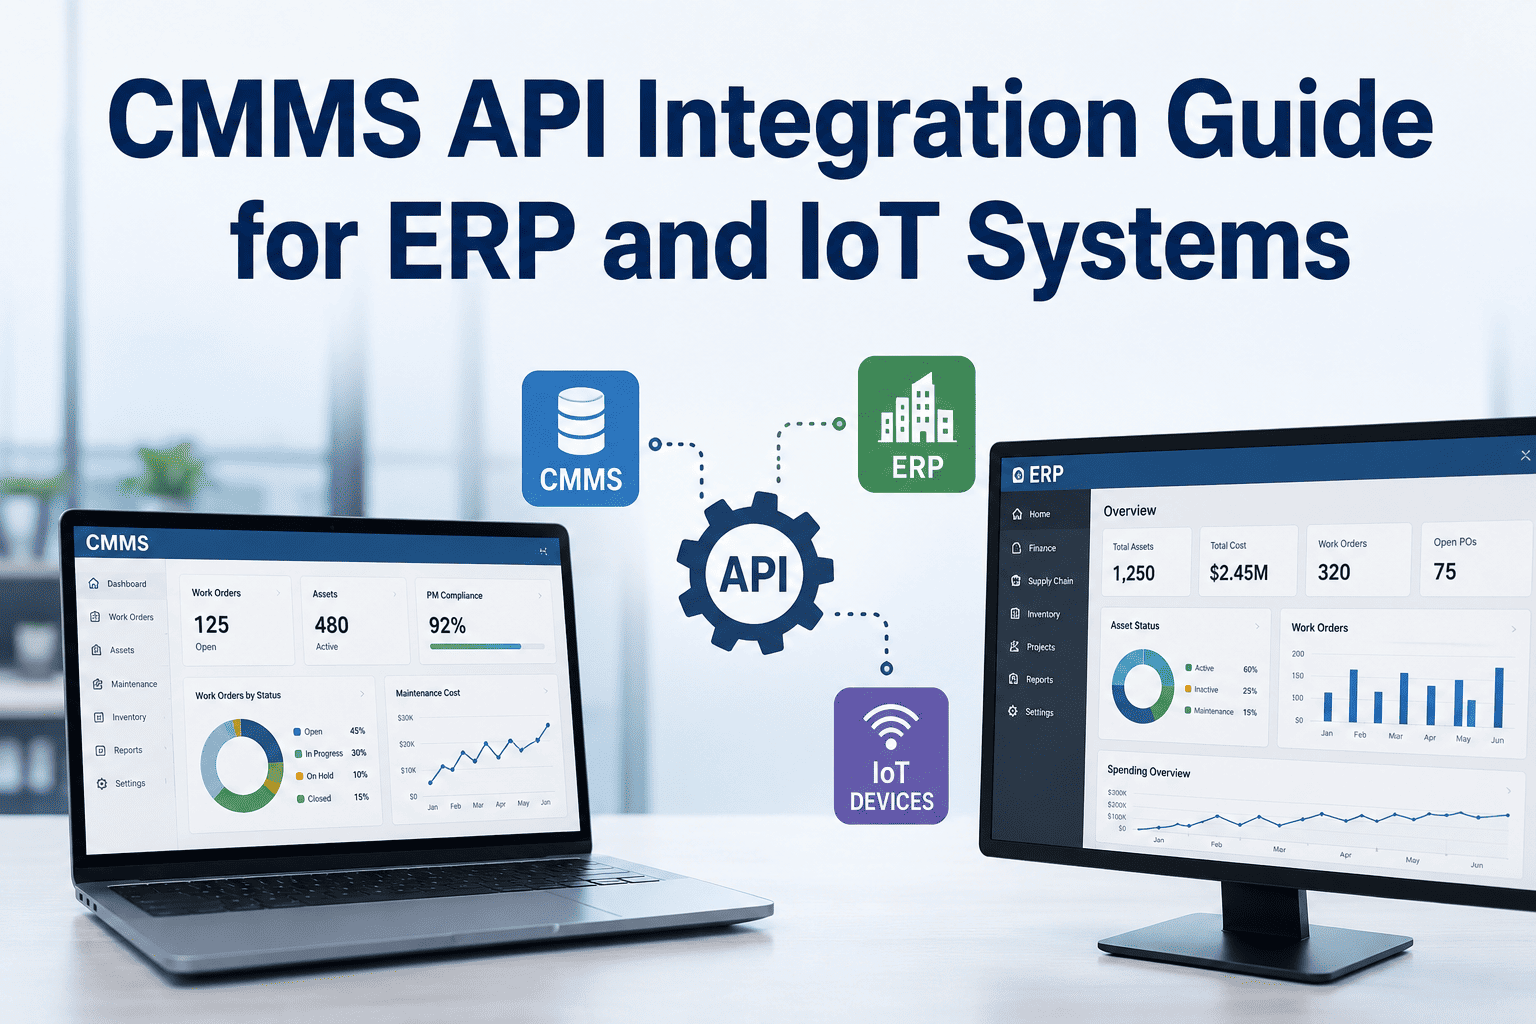
Can OxMaint integrate KPI data with our existing ERP or BI tools?
Yes. OxMaint supports API-based data export to ERP systems like SAP and Oracle, as well as BI tools including Power BI and Tableau. KPI data — including work order counts, downtime hours, and PM completion rates — can be pushed on a scheduled basis or pulled on demand. This lets plants consolidate maintenance analytics into their existing reporting stack without manual exports.
Book a demo to discuss your specific integration needs.
Stop Guessing. Start Measuring.
OxMaint gives every plant manager a live KPI dashboard — built automatically from real field data, no manual entry required.