For a utilities maintenance leader, a single failed transformer or pump is never a single repair — it is thousands of customers without power or water, a regulatory penalty for missing a reliability target, and an emergency replacement that costs three to five times the planned version of the same job. The hard truth behind it is that most utility failures happen on assets that were "maintained" on a calendar, because a fixed schedule cannot see a transformer's oil temperature creeping or a pump's vibration signature drifting. AI predictive maintenance can: it reads thousands of live data points, predicts the failure weeks ahead, and turns an emergency into scheduled work. This guide lays out where that return comes from, how fast it pays back, and which KPIs prove it. See how OxMaint AI Predictive Maintenance models the math. Book a demo to size it against your asset fleet.
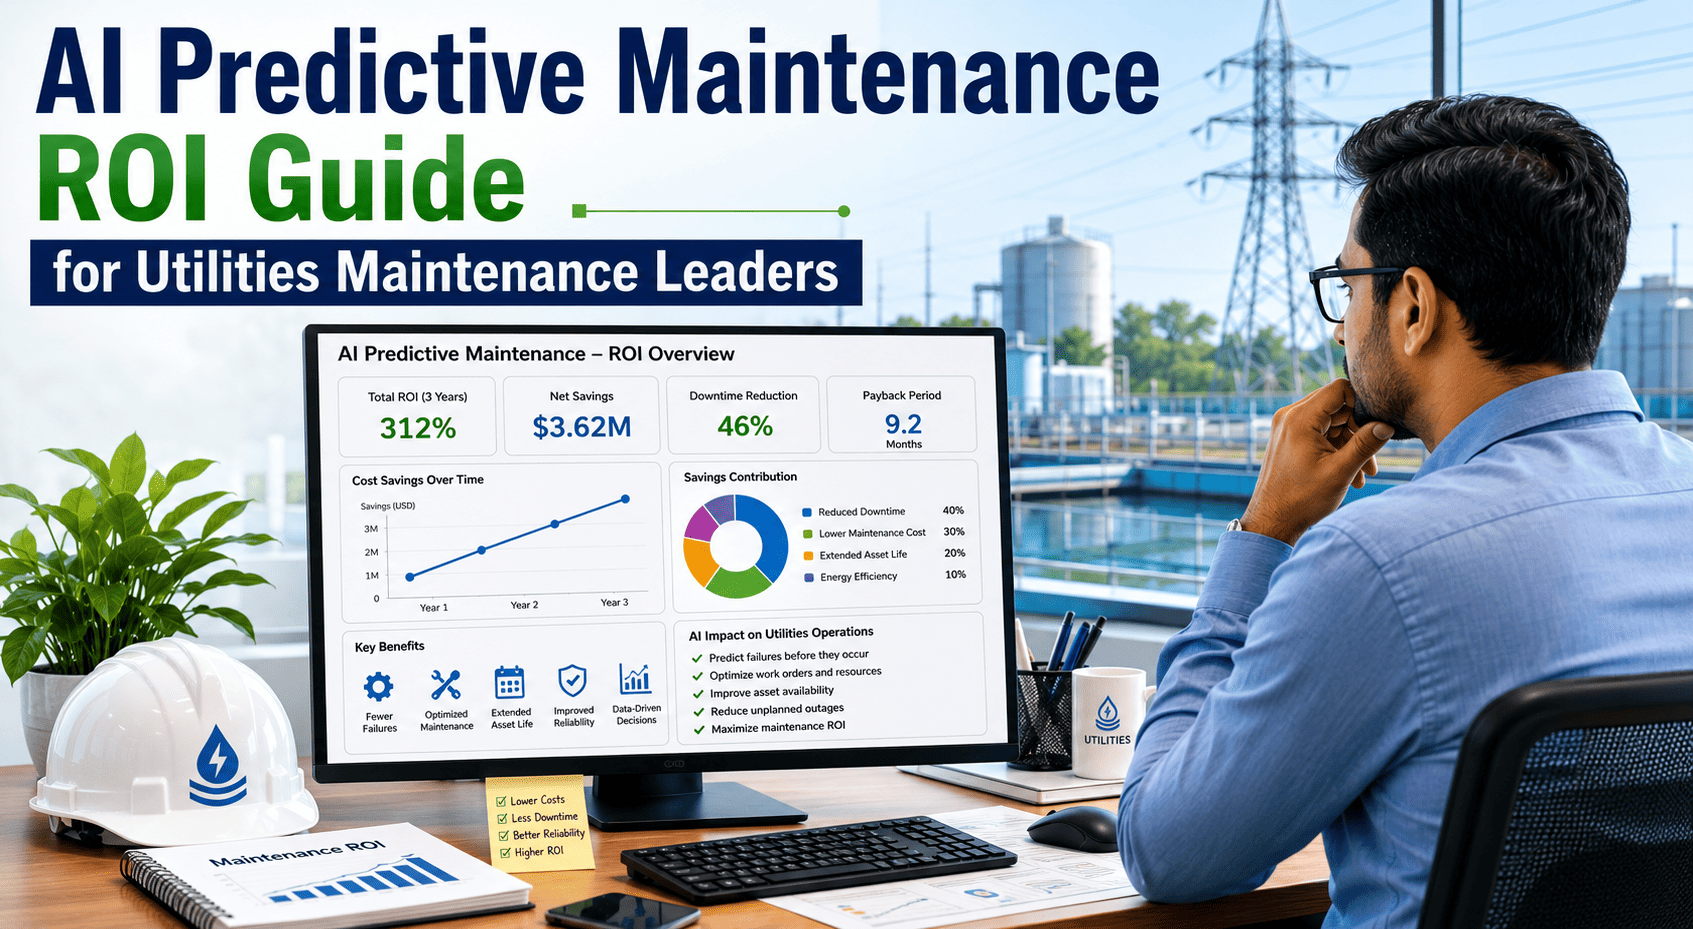
AI Predictive Maintenance ROI Guide for Utilities Maintenance Leaders
A numbers-first look at where AI-driven failure prediction pays back for utilities — outages prevented, emergency repairs eliminated, reliability scores lifted, and a single avoided failure that can fund the whole program.
The Cost of Staying Reactive
The case for prediction starts with the bill for not predicting. Utilities run some of the most consequential assets in any sector on maintenance strategies that wait for failure — and the cost lands as outages, penalties, and emergency capital all at once.
Where the Return Comes From
AI predictive maintenance does not save in one place — it moves six documented levers at once. Apply the ranges to your own outage, repair, and replacement spend to size the return.
How AI Buys You Time
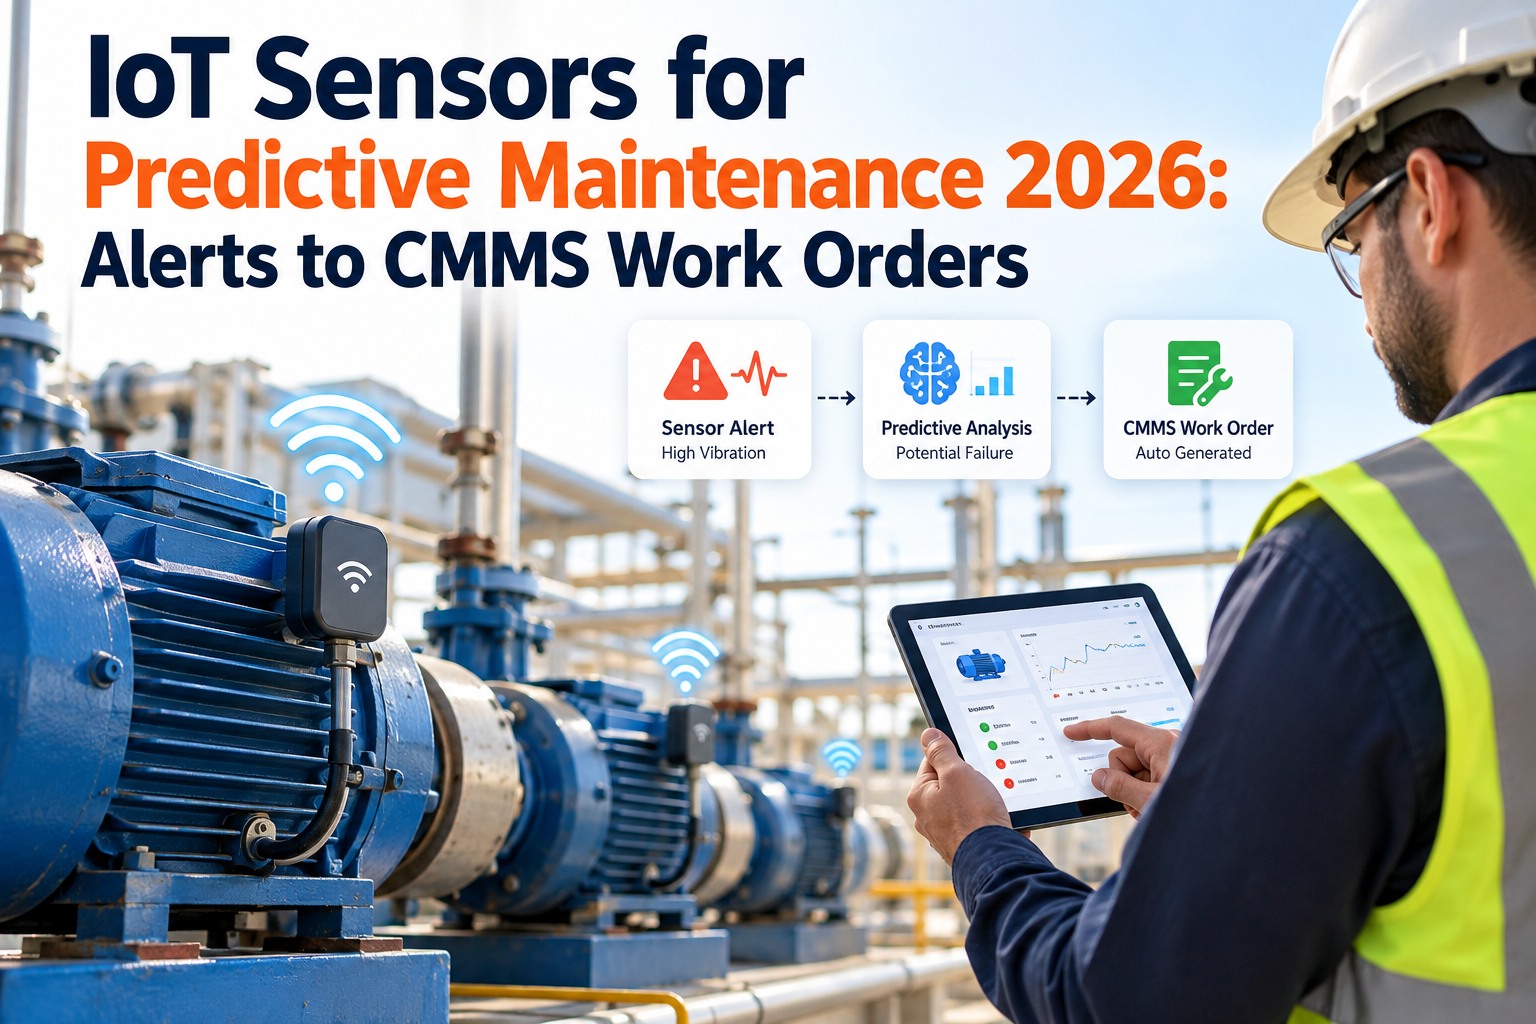
The whole return rests on one thing the calendar cannot give you: warning. The model reads the drift weeks before the break, opening a planning window that converts an emergency into a scheduled job.
How Fast It Pays Back
Most utilities reach measurable ROI inside the first year, and the strongest cases are the ones already losing an asset or more annually — where a single avoided failure offsets the entire platform cost.
The KPIs That Prove It
An AI maintenance program is measured the same way it is justified — on the reliability and cost metrics a regulator and a CFO both watch.
Built for the Grid and the Network
A utility's ROI case is specific — critical assets, reliability targets, and infrastructure you cannot simply replace. The program is built around all of it.
What Utility Leaders Say
A transformer does not fail without warning — it fails without warning we could read. A calendar cannot see oil temperature creeping for three weeks, but the model can, and that is the whole difference between a planned swap on a quiet Sunday and fifty thousand customers in the dark on a Monday. We stopped being surprised.
Utility Reliability Engineer · 23 Years Transmission & DistributionI used to budget transformer replacements as emergencies, which is the single most expensive way to spend capital. Predicting the failures lets me schedule them into planned outages — moving them from emergency response to planned capital — and one avoided major failure has already paid for the platform. That is the number my board understood instantly.
Director of Asset & Capital Planning · 18 Years Public UtilitiesFrequently Asked Questions
How does AI predict a failure the calendar misses?
It reads live condition data — transformer oil temperature and dissolved gas, pump vibration, equipment wear patterns — across thousands of points at once, and flags the drift that precedes a break. A fixed schedule treats an asset the same whether it is healthy or degrading; the model watches the actual signal and raises an alert 14–30 days before the failure. Book a demo to see prediction on your assets.
How fast does it pay back?
Most utilities reach measurable ROI within the first year, and the strongest cases are those already losing at least one asset annually, because a single avoided failure can offset the entire platform cost. In one documented grid program, a two-million-dollar build returned roughly eight million a year by preventing large-customer outages. Start free to model your payback.
Where do the savings actually come from?
Six levers: a 30–50% cut in emergency maintenance cost, a 20–40% drop in total spend, 50–70% fewer unplanned outages, a 15–25% reliability improvement, five to seven years of added asset life, and a large lift in workforce productivity. The return is the stack applied to the outage, repair, and replacement costs your utility already absorbs. Book a demo to map the levers.
Which assets give the best ROI?
Transformers, breakers, generators, pumps, and turbines — equipment that fails predictably from mechanical and thermal wear and costs the most to replace under emergency. Weather-driven distribution failures give more mixed results because the cause is not gradual wear, though monitoring still helps. Start where failure is both costly and predictable. Start free to prioritize your fleet.
Does it help with SAIDI and SAIFI penalties?
Directly — by preventing the unplanned outages that drive those indices, mature programs report a 15–25% improvement in SAIDI and SAIFI. Because the model gives advance warning, you can protect a reliability target before a missed one becomes a regulatory penalty, turning a compliance risk into a managed metric. Book a demo to model reliability gains.
Do we have to replace our SCADA to use it?
No — the AI layer sits over the SCADA, PLCs, flow and pressure loggers, and CMMS you already operate, integrating through standard protocols by asset class. You can deploy it modularly, starting with one region or one asset type, validate the results, and expand on proven value rather than committing the whole network at once. Start free to plan a phased rollout.
Turn the Next Failure Into a Scheduled Repair
OxMaint reads your assets' live condition data, predicts failures weeks ahead, and turns each alert into planned work — so utilities trade emergency outages and penalties for scheduled maintenance and a return the board can see.