Maintenance teams generate thousands of data points every week — work order completions, asset downtime events, parts consumption, labor hours, PM compliance rates. But 61% of maintenance managers say they cannot get the reports they need from their current CMMS without exporting data to Excel and manually building charts. That is not a reporting system — that is a workaround. In 2026, the gap between CMMS platforms that deliver actionable analytics and those that deliver raw data dumps has never been wider. The platforms winning are the ones where a facility manager can open a dashboard at 7 AM and know exactly which assets need attention, which sites are falling behind on PMs, and where budget is being consumed fastest — without touching a spreadsheet. If your current CMMS makes you export to Excel before you can answer a basic question about your operation, it is time to see what real reporting looks like. Start a free trial with OxMaint to explore the dashboards yourself or book a demo to see custom reporting in action.
CMMS Analytics · Maintenance Reporting · Dashboard Intelligence
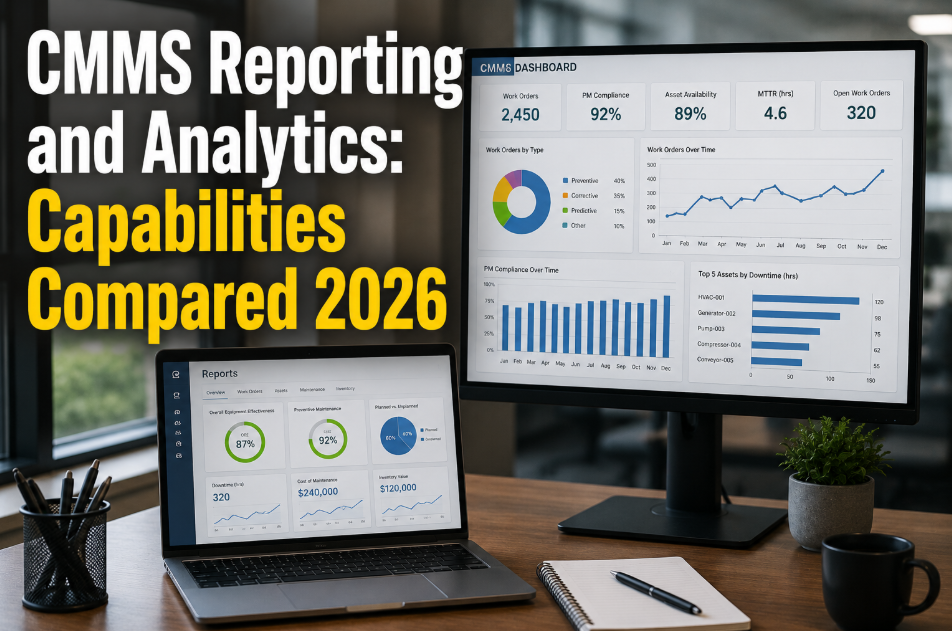
CMMS Reporting and Analytics: Capabilities Compared 2026
61% of maintenance managers cannot get the reports they need without exporting to Excel. The right CMMS delivers dashboards, custom reports, scheduled exports, and AI-driven insights — not data dumps that require hours of manual processing.
61%
of managers rely on Excel to process CMMS data
8.2 hrs
average weekly time spent on manual report building
3x
faster decisions with real-time CMMS dashboards
26%
maintenance cost reduction with data-driven operations
Definition
What Is CMMS Reporting and Analytics?
CMMS reporting and analytics refers to the built-in capabilities of a maintenance management platform to collect, organize, visualize, and deliver insights from operational maintenance data. This includes dashboards showing real-time KPIs, custom reports filtered by asset, site, technician, or time period, scheduled report delivery to stakeholders, and increasingly, AI-powered pattern recognition that surfaces anomalies and trends before they become problems.
The difference between basic CMMS reporting and advanced analytics is the difference between knowing what happened and understanding what to do about it. Basic reporting tells you that PM compliance dropped to 71% last month. Advanced analytics tells you which three assets drove that drop, which technician had the highest backlog, and which parts shortages caused the delays. Organizations that use advanced CMMS analytics report 26% lower maintenance costs and 18% less unplanned downtime compared to those relying on basic reporting. To see what analytics-first CMMS looks like in practice, start a free trial with OxMaint and build your first dashboard in minutes.
Key Capabilities
The 6 Reporting Capabilities That Separate Leading CMMS Platforms
Not all CMMS reporting is created equal. Here are the six capabilities that matter most when evaluating platforms for data-driven maintenance management.
01
Real-Time KPI Dashboards
Live dashboards showing PM compliance, open work orders, MTTR, MTBF, and maintenance spend — updated in real time without manual refresh. 78% of high-performing maintenance teams use real-time dashboards as their primary management tool.
02
Custom Report Builder
Drag-and-drop or filter-based report creation that lets managers build exactly the report they need — by asset class, site, date range, technician, priority level, or cost center. No developer or IT ticket required. Reports save and reuse in seconds.
03
Scheduled Report Delivery
Automated report generation and email delivery on daily, weekly, or monthly cadence. The VP of Operations gets a portfolio summary every Monday morning. The site manager gets PM compliance every Friday. No one has to request anything.
04
Multi-Site Rollup Analytics
Portfolio-level views that aggregate data across 5, 50, or 500 sites into normalized benchmarks. Compare PM compliance, cost per square foot, and work order velocity across locations — surfacing underperformers instantly.
05
AI-Driven Insights
Machine learning models that analyze work order patterns, failure frequencies, and cost trends to predict emerging issues. AI flags assets trending toward failure 2-4 weeks before traditional threshold alerts would trigger, giving teams time to plan.
06
Export and BI Integration
Clean data export to Power BI, Tableau, or other BI tools via API or scheduled CSV. For organizations with existing analytics infrastructure, CMMS data flows seamlessly into enterprise dashboards without manual data handling.
Stop Spending 8 Hours a Week Building Reports Your CMMS Should Generate Automatically
OxMaint delivers custom dashboards, scheduled exports, AI-powered insights, and multi-site rollup analytics — all built in. See it working in a 30-minute demo with your own data scenarios.
Comparison
CMMS Reporting Capabilities: What to Expect at Each Tier
CMMS platforms vary dramatically in their reporting depth. Here is what each tier typically delivers — and where the gaps cost you time and visibility.
| Capability |
Basic CMMS |
Mid-Tier CMMS |
OxMaint (Advanced) |
| Pre-built dashboards |
3-5 static templates |
10-15 configurable views |
Unlimited custom dashboards |
| Custom report builder |
Not available — export to Excel |
Basic filter and group |
Full drag-and-drop with saved templates |
| Scheduled delivery |
Manual only |
Email on fixed schedule |
Custom cadence per report per recipient |
| Multi-site rollup |
Not supported |
Limited to 2-3 aggregation levels |
Full hierarchy: Portfolio > Region > Site > Asset |
| AI insights |
None |
None or early beta |
Anomaly detection + trend prediction |
| BI tool integration |
CSV export only |
API available (limited docs) |
REST + GraphQL + webhooks — fully documented |
| Mobile dashboard access |
Desktop only |
Responsive but limited |
Full mobile-first dashboard experience |
| Implementation cost |
Low |
$25K-$75K consulting |
No heavy implementation fees |
Critical KPIs
The 8 Maintenance KPIs Your CMMS Dashboard Must Track in 2026
A dashboard is only as useful as the metrics it surfaces. These eight KPIs represent the minimum viable reporting framework for any maintenance operation serious about performance improvement.
PM Compliance Rate
Target: above 90%
Measures the percentage of scheduled preventive maintenance completed on time. Below 85% correlates with 2.7x higher emergency work order volume. Industry top quartile maintains above 95%.
MTTR (Mean Time to Repair)
Benchmark: varies by asset class
Average time from work order creation to completion. A rising MTTR trend signals parts availability issues, skill gaps, or process bottlenecks. Track by asset category for meaningful comparison.
MTBF (Mean Time Between Failures)
Target: increasing trend
Measures asset reliability — longer intervals between failures indicate effective preventive maintenance. A declining MTBF for a specific asset class is an early warning of systematic maintenance gaps.
Work Order Backlog
Target: below 2 weeks of capacity
Total open work orders measured against available labor capacity. A growing backlog means your team is falling behind — and every week of backlog growth increases the probability of emergency failures.
Planned vs Reactive Ratio
Target: 80% planned or higher
The single most important indicator of maintenance maturity. Organizations below 60% planned work spend 4.8x more per repair event than those above 80%. This metric drives every other KPI improvement.
Maintenance Cost per Asset
Target: declining year-over-year
Total maintenance spend (labor + parts + contractors) divided by asset count. Enables cross-site and cross-asset-class benchmarking. A rising cost per asset without corresponding reliability improvement signals inefficiency.
Asset Uptime Percentage
Target: above 95%
Total available hours minus downtime hours divided by total available hours. The metric that connects maintenance performance to operational output. Every 1% improvement in uptime translates directly to production or service capacity.
First-Time Fix Rate
Target: above 85%
Percentage of work orders resolved on the first visit without a return trip. Low first-time fix rates indicate parts staging problems, inadequate diagnostic information, or skill-to-task mismatches in assignment.
OxMaint tracks all eight of these KPIs out of the box — with the ability to add custom metrics specific to your operation. Every metric is available at the asset, site, regional, and portfolio level. Want to see how your current numbers compare, book a demo and bring your current KPI baselines — we will show you where the gaps are.
Pain Points
Why Most CMMS Reporting Fails Maintenance Teams
Data Export Trap
Reports Require Excel Processing
The CMMS can store data but cannot present it. Every useful report requires exporting raw data, cleaning it in Excel, building pivot tables, and formatting for stakeholders. By the time the report is ready, the data is stale and the manager has lost 3 hours.
61% of maintenance managers export to Excel for every report
Static Dashboards
Pre-Built Views That Do Not Fit Your Operation
Basic CMMS platforms offer 3-5 dashboard templates that cannot be customized. If the pre-built view does not match your reporting needs — different KPIs, different groupings, different time ranges — there is no solution except manual work.
Only 22% of maintenance teams find pre-built CMMS dashboards useful without modification
Stakeholder Gap
Cannot Share Reports With Non-CMMS Users
Executives, investors, and property owners need maintenance data but will never log into a CMMS. Without scheduled report delivery, the maintenance manager becomes a manual report distribution service — spending time forwarding data instead of acting on it.
Scheduled report delivery saves managers 6+ hours per week on average
No Cross-Site View
Multi-Site Data Lives in Silos
Each site has its own CMMS instance or database. Comparing PM compliance across locations requires collecting data from every site manager, normalizing naming conventions, and assembling a consolidated view. The process takes weeks and delivers outdated snapshots.
72% of multi-site teams spend 8+ hours monthly on manual report consolidation
Measurable Results
What Data-Driven Maintenance Operations Achieve
26%
lower maintenance costs
Organizations using advanced CMMS analytics vs basic reporting
18%
less unplanned downtime
Real-time dashboards enable faster response to emerging issues
3x
faster decision-making
Real-time KPI visibility vs manual weekly report cycles
6+ hrs
saved weekly per manager
Automated report generation and scheduled delivery vs manual Excel processing
FAQs
CMMS Reporting and Analytics — Common Questions
Can I build custom dashboards without IT support in OxMaint?
Yes. OxMaint's dashboard builder is designed for maintenance managers, not developers. Select your KPIs, choose visualization types, set filters by site or asset class, and save. Dashboards update in real time and can be shared with stakeholders via scheduled delivery. No coding, no IT tickets, no waiting.
Start a free trial to build your first custom dashboard today.
Does OxMaint integrate with Power BI or Tableau?
OxMaint provides REST API, GraphQL, and webhook endpoints — all fully documented and free to use. Data flows to Power BI, Tableau, or any BI platform that accepts API connections or scheduled data exports. For organizations with existing BI infrastructure, OxMaint data enriches enterprise analytics without replacing existing tools.
How does AI-driven reporting work in OxMaint?
OxMaint's AI layer analyzes work order patterns, failure frequencies, cost trends, and parts consumption across your entire asset portfolio. It surfaces anomalies — like an asset generating 3x more work orders than peers, or a site where PM compliance dropped 15% in two weeks — and delivers actionable alerts, not just data. Want to see it in action,
book a demo and we will walk you through real AI insight examples.
Can different stakeholders get different reports on different schedules?
Absolutely. OxMaint supports per-recipient, per-report scheduling. The CFO gets a monthly CapEx summary. The regional director gets weekly PM compliance across their sites. The site manager gets daily work order status. Each report is configured independently — different data, different format, different delivery time, same platform.
Your Maintenance Data Should Work for You — Not the Other Way Around
OxMaint delivers custom dashboards, scheduled report delivery, AI-powered insights, and multi-site rollup analytics — with no heavy implementation fees and no Excel required. See it in a 30-minute demo.