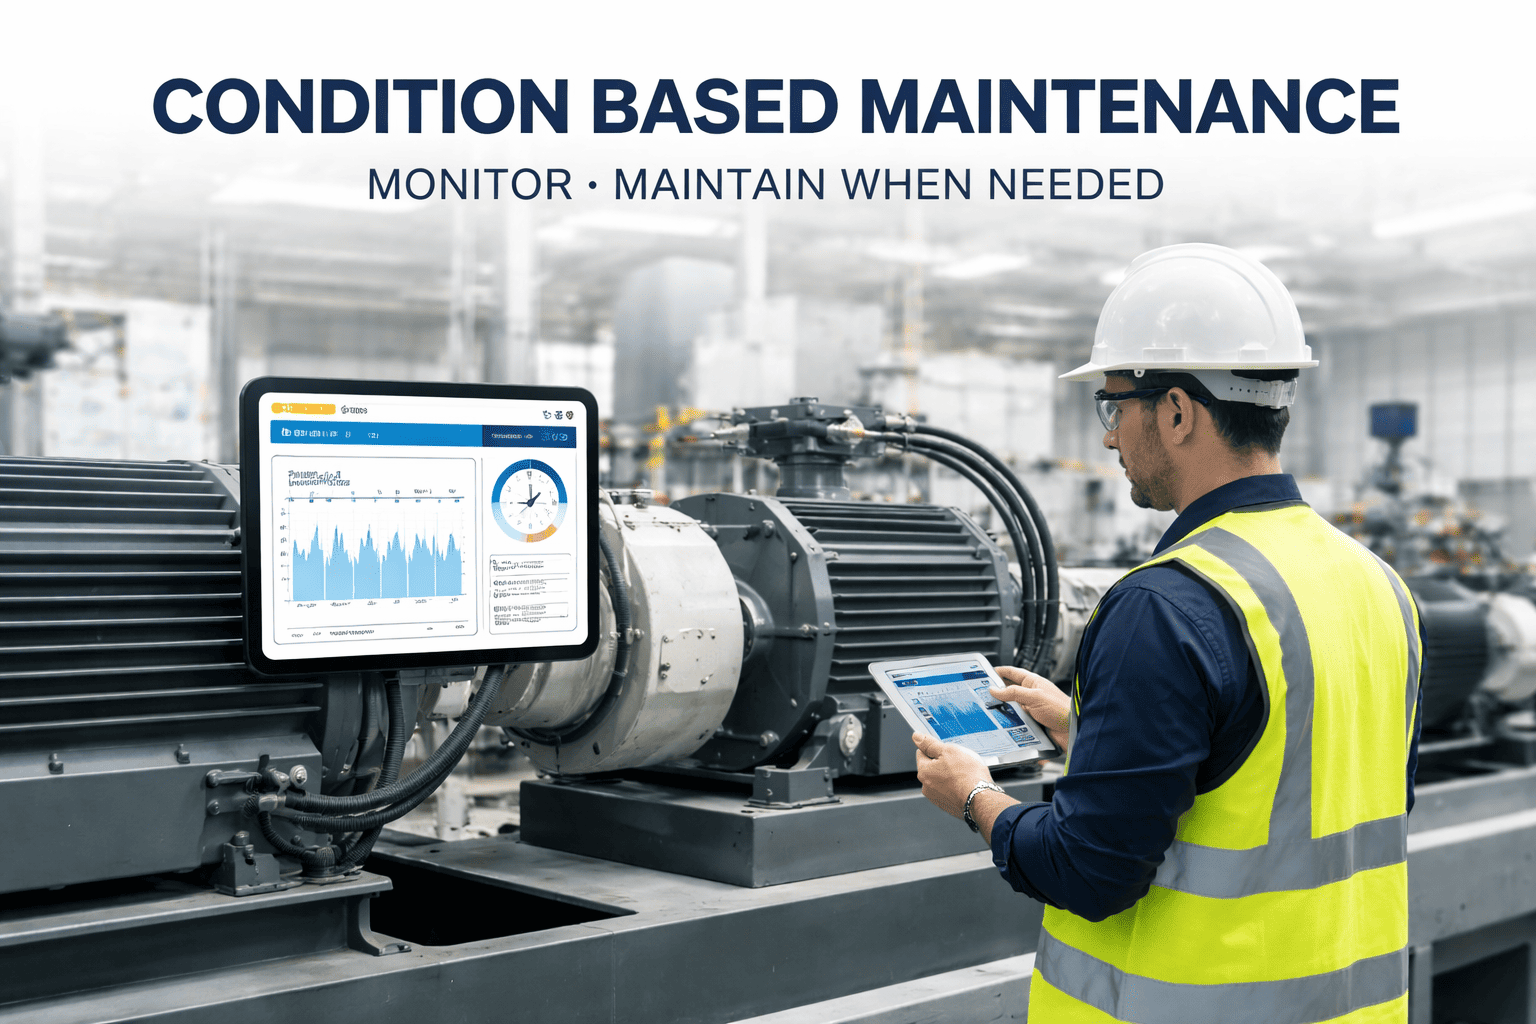
Every maintenance team faces the same impossible choice: service equipment on a fixed calendar and waste labor on components that didn't need intervention — or wait for failure and absorb a catastrophic breakdown that shuts down the line for days. Condition-Based Maintenance (CBM) eliminates this dilemma permanently. Instead of guessing with schedules or hoping for the best, CBM deploys sensors, vibration analysis, thermal imaging, and oil monitoring to read equipment health in real time — triggering maintenance only when actual deterioration data confirms it is needed. The global CBM systems market was valued at $2.5 billion in 2024 and is projected to reach $5.8 billion by 2033, growing at 9.9% CAGR — driven by one documented result: organizations implementing CBM eliminate 25–30% of maintenance costs and reduce unplanned downtime by 35–50%. Sign up for Oxmaint free and connect your condition monitoring data to automatic work orders from day one.
These numbers represent documented outcomes, not projections — from Aberdeen Group's 150-plant study, from the Society for Maintenance and Reliability Professionals, and from 2025 industry benchmarks showing 95% of CBM adopters reporting positive ROI within 12 months. The difference between plants achieving these results and those that don't comes down to one thing: whether sensor data automatically creates maintenance actions. Book a free Oxmaint demo to see how the platform closes this loop automatically.
What Is Condition-Based Maintenance?
CBM performs maintenance only when equipment monitoring data indicates a real need — not on a fixed calendar, and not reactively after failure. It monitors physical parameters continuously or at defined intervals and compares readings against established thresholds. When a parameter crosses a threshold, a maintenance event is triggered at exactly the right moment — neither too early (wasting component life) nor too late (risking catastrophic failure).
The P-F Interval — CBM's Core Principle
The governing concept that makes condition monitoring work
Sensor detects deterioration
Equipment stops working
The P-F interval is the time between when monitoring detects a potential failure (P) and when that failure becomes functional (F). CBM operates entirely within this window — catching the signal at point P so your team has planned lead time to intervene before reaching point F. Vibration analysis gives a P-F interval of 1–9 months for bearing defects. Acoustic emission detects cracks up to 12 months before failure. Oil analysis gives 2–6 months for gear wear.
CBM vs. Every Other Maintenance Strategy
The 6 CBM Monitoring Techniques: Complete Reference
No single monitoring technology covers every failure mode. Effective CBM programs match the right technique to each asset type and failure mechanism. Here is the complete industrial reference with failure modes detected, applicable equipment, and P-F interval for each.
| Technique | Failure Modes Detected | Best Equipment | P-F Interval |
|---|---|---|---|
| Vibration Analysis | Bearing wear, imbalance, misalignment, gear mesh defects, looseness, rotor bar faults | Motors, pumps, fans, gearboxes, crushers, mills — any rotating machinery | 1–9 months; detects bearing defects before audible noise or heat develops |
| Thermography (IR) | Loose electrical connections, overloaded circuits, refractory hot spots, bearing overheating, insulation failure | MCC panels, switchgear, kiln shells, furnace walls, conveyor bearings | 1–6 months electrical; days for refractory hot spots (immediate action required) |
| Oil & Lubricant Analysis | Wear metal particles, contamination, viscosity degradation, water ingress, additive depletion | Gearboxes, hydraulic systems, compressors, turbines, kiln drive gearboxes | 2–6 months; pinpoints the specific failing component with high precision |
| Acoustic Emission | Early-stage bearing defects, fatigue cracks, leaks, cavitation, structural stress | Slow-rotating equipment, pressure vessels, pipelines, storage tanks | Longest available — up to 12+ months before functional failure |
| Motor Current Signature (MCSA) | Rotor bar faults, stator winding degradation, air gap eccentricity, driven-load faults | AC induction motors, VFD-driven equipment, compressor and pump drives | 2–6 months; non-invasive — uses current clamps, no physical machine access needed |
| Process Parameter Monitoring | Flow rate drop, pressure deviation, efficiency loss, energy consumption rise, cycle time increase | Pumps, fans, kilns, mills, heat exchangers, separators, compressors | Weeks to months; energy-based monitoring catches degradation vibration may miss |
5-Phase CBM Implementation Roadmap
The most common reason CBM programs fail to deliver ROI is deploying sensors without structured workflows. Hardware without process produces alerts that nobody acts on. This validated 5-phase model generates measurable results within the first 12 months. Sign up for Oxmaint and structure your workflow from phase one.
Rank all assets by criticality: safety consequence × production impact × failure likelihood × repair cost. The top 15–20% of assets account for 80%+ of unplanned downtime cost — deploy full sensor coverage here first. Mid-tier assets receive periodic manual inspection rounds. Low-criticality assets remain on time-based PM or run-to-fail. This prevents sensor sprawl and concentrates investment where ROI is highest.
For each critical asset, identify all credible failure modes via FMEA or RCM. For each failure mode, identify the physical parameter that changes as the failure develops — this is your measurable indicator. Match each indicator to the monitoring technology that detects it with the longest available P-F interval. This determines which sensor type goes on which asset and at which mounting location — precision that prevents misdeployment.
Install monitoring equipment and collect baseline data for 4–6 weeks under known-good operating conditions. Establish normal operating ranges for each parameter: vibration RMS and frequency spectrum, temperature, oil particle counts, pressure differential. Set alert thresholds at 2σ above baseline mean for early warning, 3σ for action threshold. Thresholds set too tight generate false alarms and erode team confidence. Too loose and genuine deterioration is missed.
Connect monitoring systems to your CMMS so threshold breaches automatically generate work orders with correct priority, assigned to the right technician, with all sensor trend data attached. Without this automation step, alerts become emails that get buried — the single biggest cause of CBM programs that produce data but no maintenance actions. Define the escalation workflow: who receives early warning alerts, who approves action work orders, required response time per priority level.
After 90 days live, conduct a structured review: how many alerts generated, how many confirmed real defects vs. false positives, what was the alert-to-action lead time, which failures were prevented. Refine thresholds, improve sensor placement, identify next assets for expansion. Mature CBM programs report ROI within 6–12 months — typically from a single prevented catastrophic failure covering the entire year's monitoring program cost. Large industrial plants document annual savings of $500,000–$1 million.
CBM for Cement Plants: Asset-by-Asset Deployment Guide
Cement manufacturing presents CBM conditions found nowhere else in industry — continuous high-temperature kilns, severe mechanical loading on crushers, and extreme dust environments around mills. Standard CBM templates apply, but the failure modes, monitoring intervals, and sensor placement requirements differ significantly from discrete manufacturing. Here is the validated deployment guide per asset class.
| Asset | Monitoring Technique | Key Parameter | Failure Mode Detected |
|---|---|---|---|
| Rotary Kiln CRITICAL | Shell thermography | Shell temperature map (full length) | Refractory thinning, hot spots — immediate action threshold |
| Vibration — tyre/roller | RMS vibration, tyre ovality | Tyre migration, roller skewing, shell ovality growth | |
| Oil analysis — drive | Wear metals, viscosity, water | Girth gear wear, drive gearbox degradation | |
| Process parameters | Specific heat consumption kJ/kg | Refractory degradation detected through energy efficiency decline | |
| Raw Crusher HIGH | Vibration analysis | Bearing vibration spectrum, RMS trend | Crusher bearing failure, rotor imbalance, liner looseness |
| Thermography | Bearing and motor surface temp | Lubrication failure, electrical overload, motor winding hot spots | |
| Process parameters | Power draw per tonne (kWh/t) | Feed hardness deviation, liner wear state, throughput degradation | |
| Cement Ball Mill HIGH | Vibration — trunnion bearings | Trunnion bearing vibration RMS and spectrum | Trunnion bearing wear, mill shell flex fatigue |
| Oil analysis — trunnion | Wear metals (Fe, Cr), water content | Trunnion bearing degradation, coolant contamination | |
| Process parameters | kWh/tonne, separator efficiency | Grinding media charge loss, liner wear, separator blade erosion | |
| Bag Filter / ESP CRITICAL | Process parameters | Differential pressure across filter | Filter blinding, bag bypass event — also a regulatory compliance trigger |
| Opacity monitoring | Stack opacity % | Bag failure, regulatory emission limit breach — instant alert required | |
| Vibration — ID fan | Fan bearing vibration spectrum | Fan blade erosion, bearing wear, rotor imbalance from dust buildup |
How Oxmaint Powers the CBM Closed Loop
CBM generates more maintenance data than any paper or spreadsheet system can manage. Every sensor reading, every threshold breach, every work order, every technician finding must be captured and connected automatically. Oxmaint closes the loop. Book a demo to see the full workflow in action.
Monitor
IoT sensors, SCADA integrations, and manual inspection rounds feed vibration, temperature, oil, and process data into Oxmaint's real-time asset dashboard
Alert
Threshold breach triggers instant push notification to responsible technician with full sensor trend data, asset history, and escalation path attached
Work Order
Above action threshold, Oxmaint auto-generates a prioritized work order with assigned technician, attached SOPs, required parts list — zero manual handoff
Execute
Technicians complete work orders on mobile — logging findings, photos, parts used, and corrective actions. All data feeds back into asset condition history
Analyse
CBM performance reports track alert-to-action time, false positive rate, failures prevented, MTBF trend, and maintenance cost reduction — proving ROI continuously