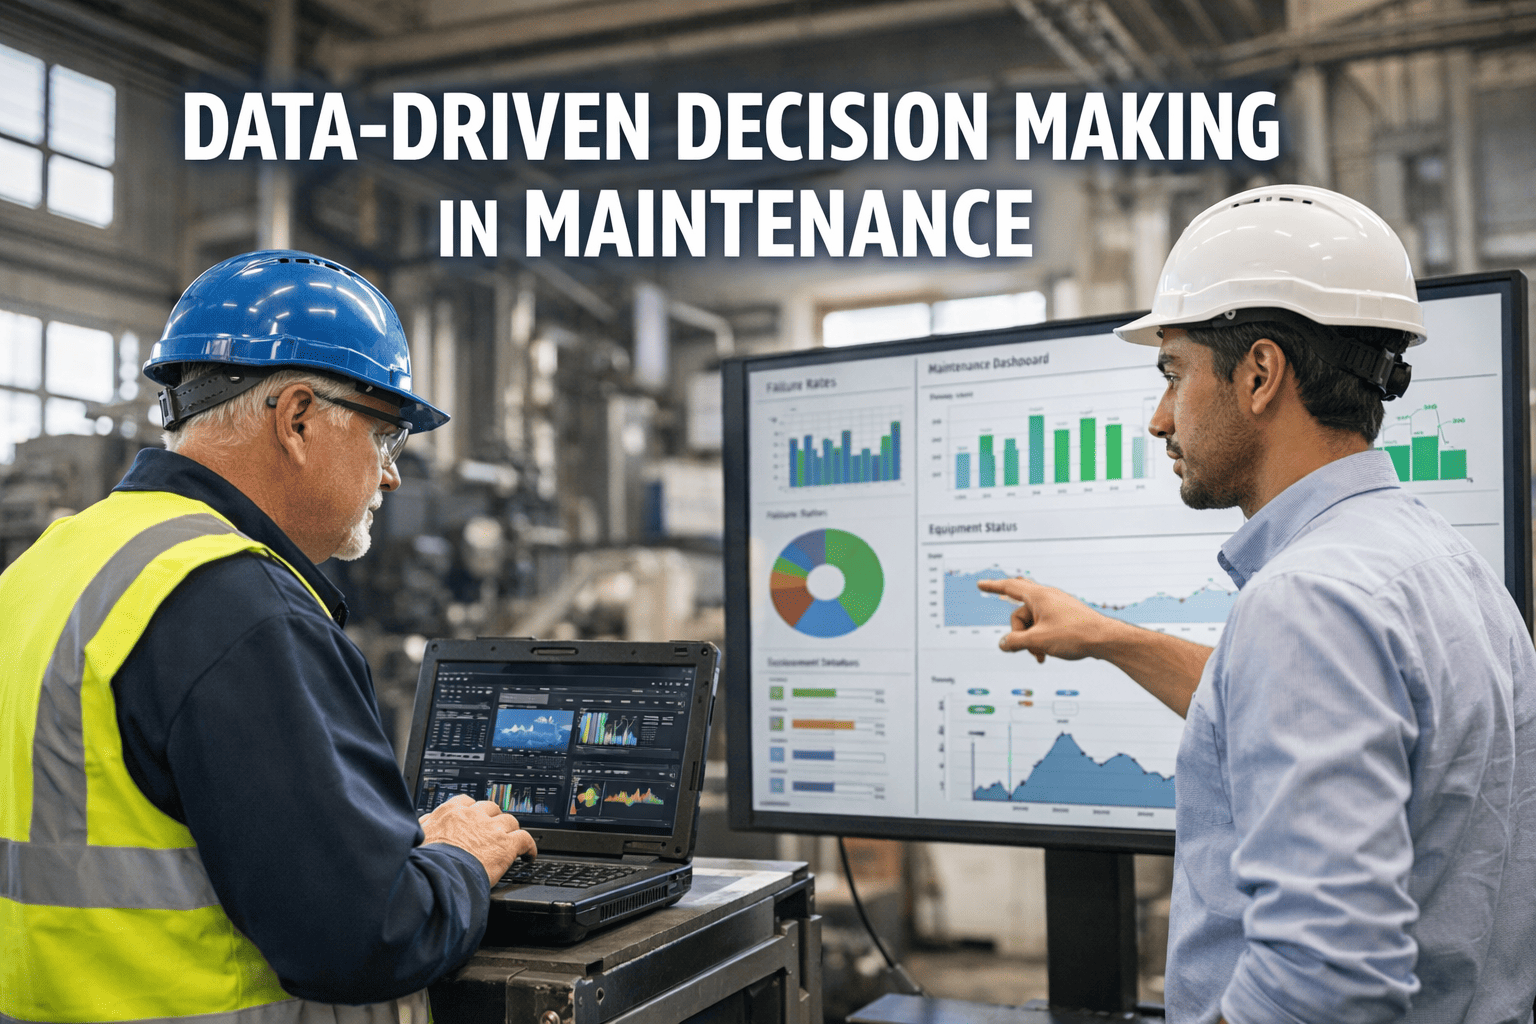
Maintenance managers know that equipment failures don't just happen randomly—they are the result of missed warning signs, inefficient scheduling, and relying on gut feeling rather than hard facts. A robust data-driven maintenance strategy is your first line of defense against costly downtime, unpredictable budgets, and reactive firefighting. Studies show that organizations using data to drive their maintenance decisions experience a 30% reduction in maintenance costs and a 45% decrease in unexpected equipment failures. This guide walks you through everything you need to transition from reactive guesswork to proactive, data-driven maintenance management.
Why Data-Driven Maintenance is Non-Negotiable
Relying on intuition or simple calendar-based schedules for maintenance is no longer sufficient. When you don't use data, you either over-maintain equipment (wasting labor and parts) or under-maintain it (risking catastrophic failure). What starts as an undetected vibration anomaly can quickly escalate into a complete line shutdown, stranding your production and disrupting customer deliveries. Understanding maintenance data helps you prioritize which assets need attention based on actual condition, not just the date. You can sign up for our maintenance platform to begin tracking these critical metrics today.
The Cost of Reactivity
Fixing a broken machine costs 5x more than preventing the failure through data-backed proactive maintenance.
Wasted Resources
Up to 40% of preventative maintenance tasks performed on a strict calendar schedule yield no actual benefit.
Hidden Inefficiencies
Without tracking wrench time and labor data, you can't identify bottlenecks in your maintenance team's workflow.
Inventory Bloat
Guessing what spare parts you need leads to expensive excess inventory or costly stockouts during emergencies.
The Core Pillars of Data-Driven Maintenance
Building a data-driven strategy isn't just about collecting numbers; it's about collecting the *right* numbers and knowing how to use them. Start by tracking these core pillars to build a foundation for predictive and prescriptive maintenance. For best results, integrate these data points into a centralized CMMS so nothing falls through the cracks. Most successful organizations create a free account to digitize their data collection instantly.
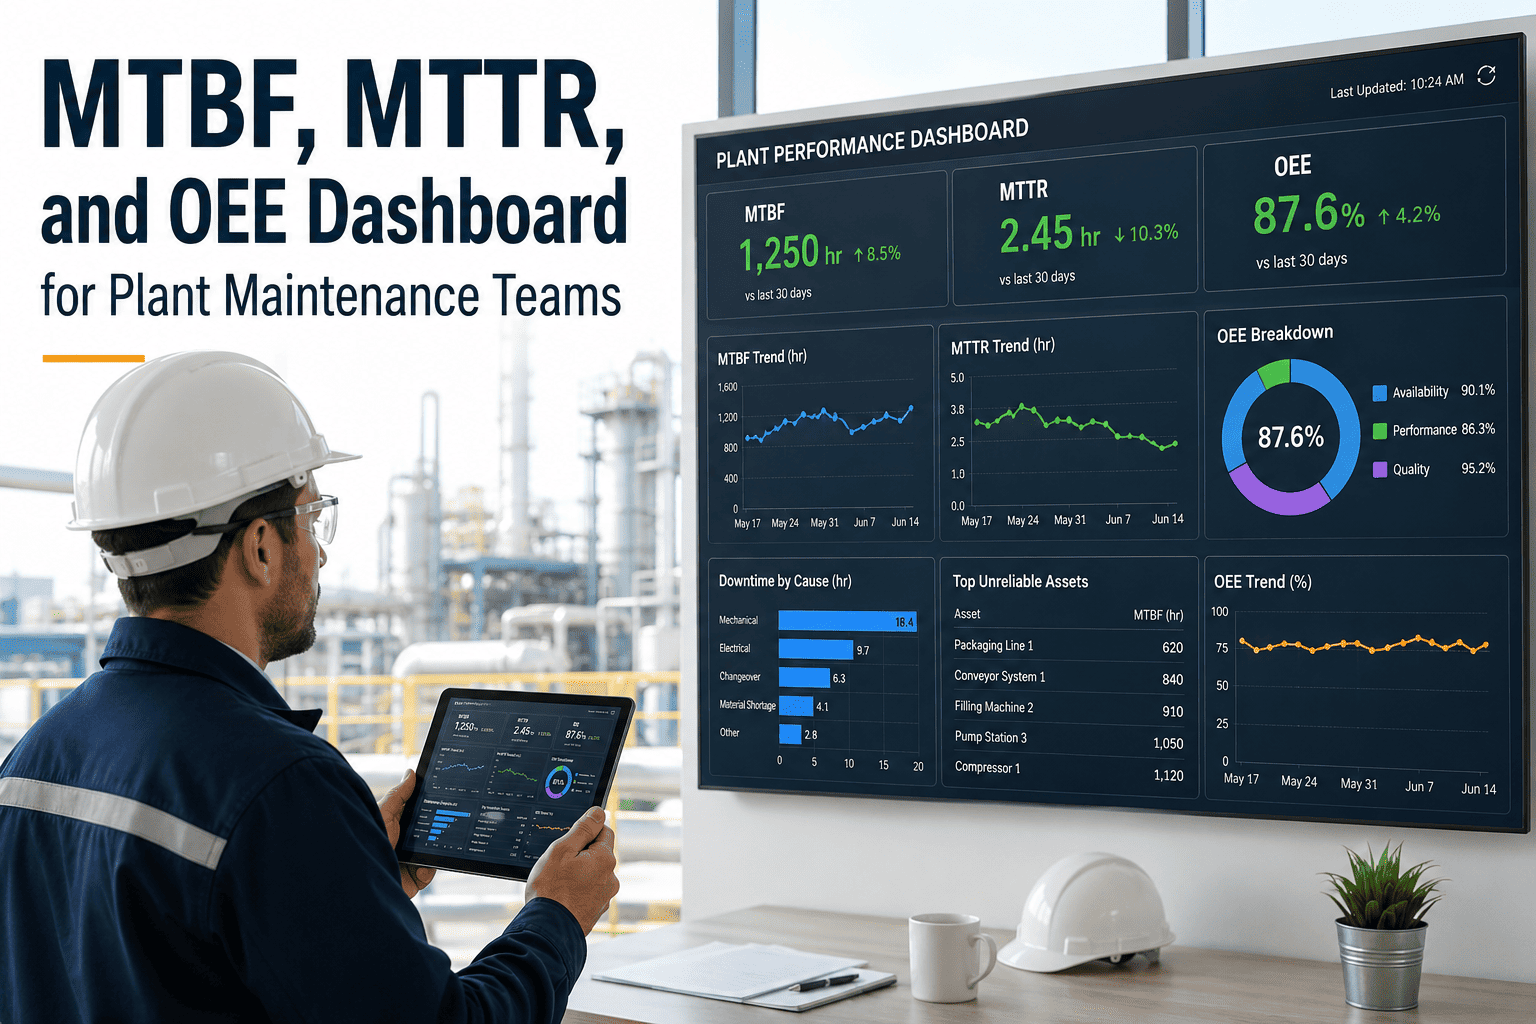
1. Asset Health & Condition Monitoring
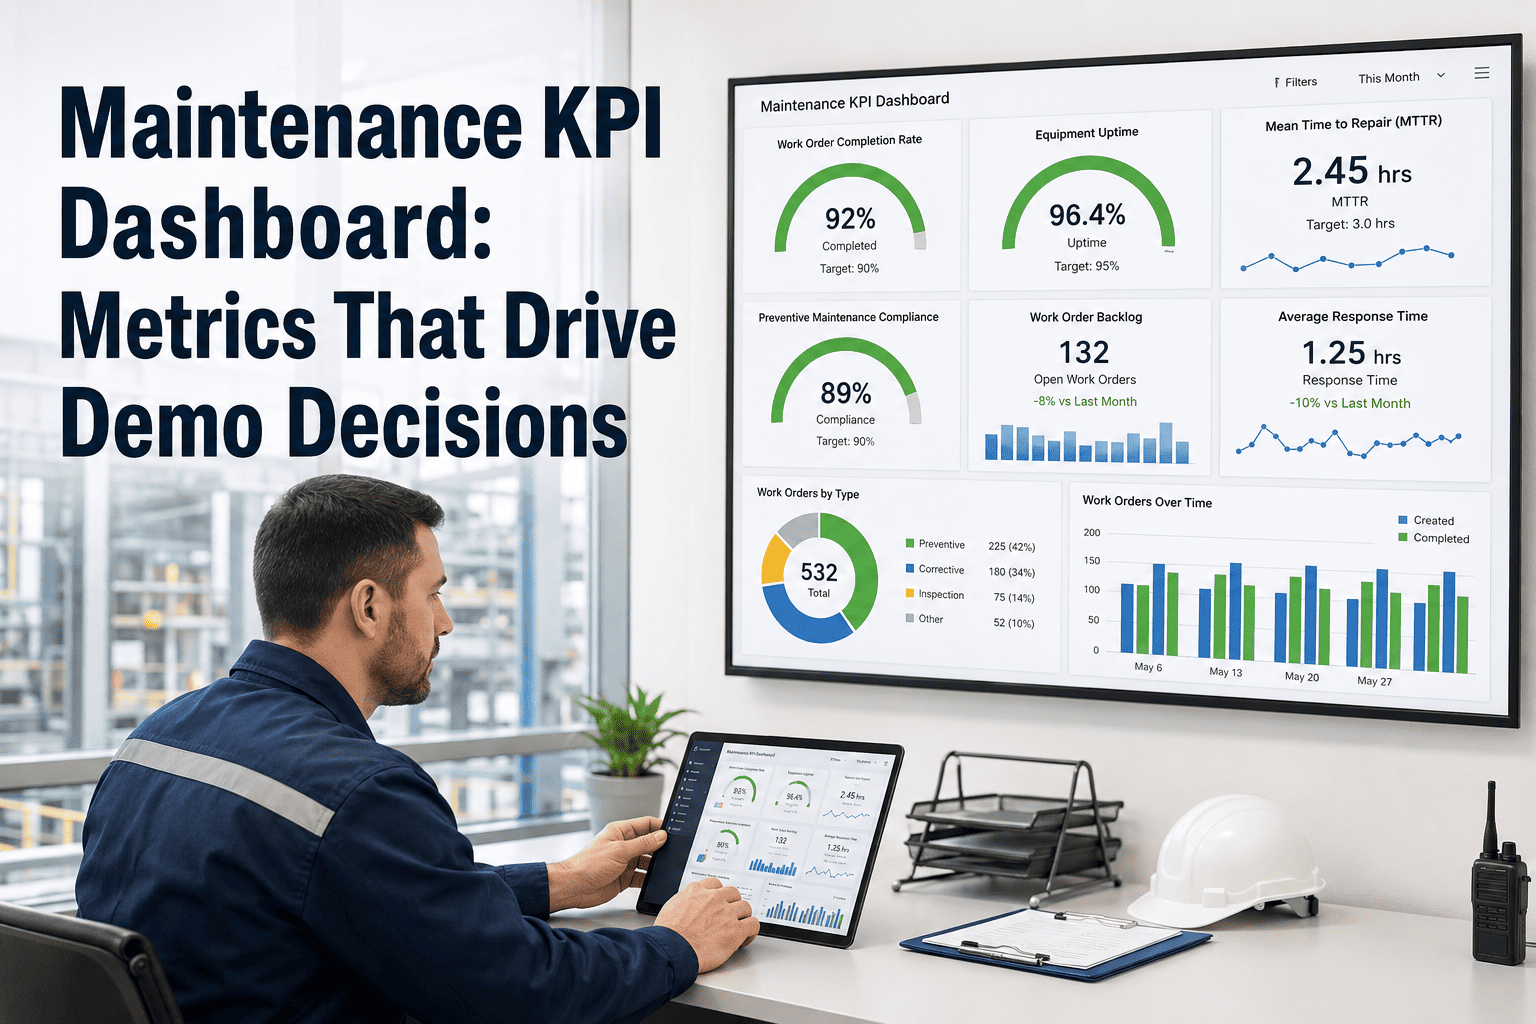
2. Maintenance Operations Metrics
3. Financial & Resource Data
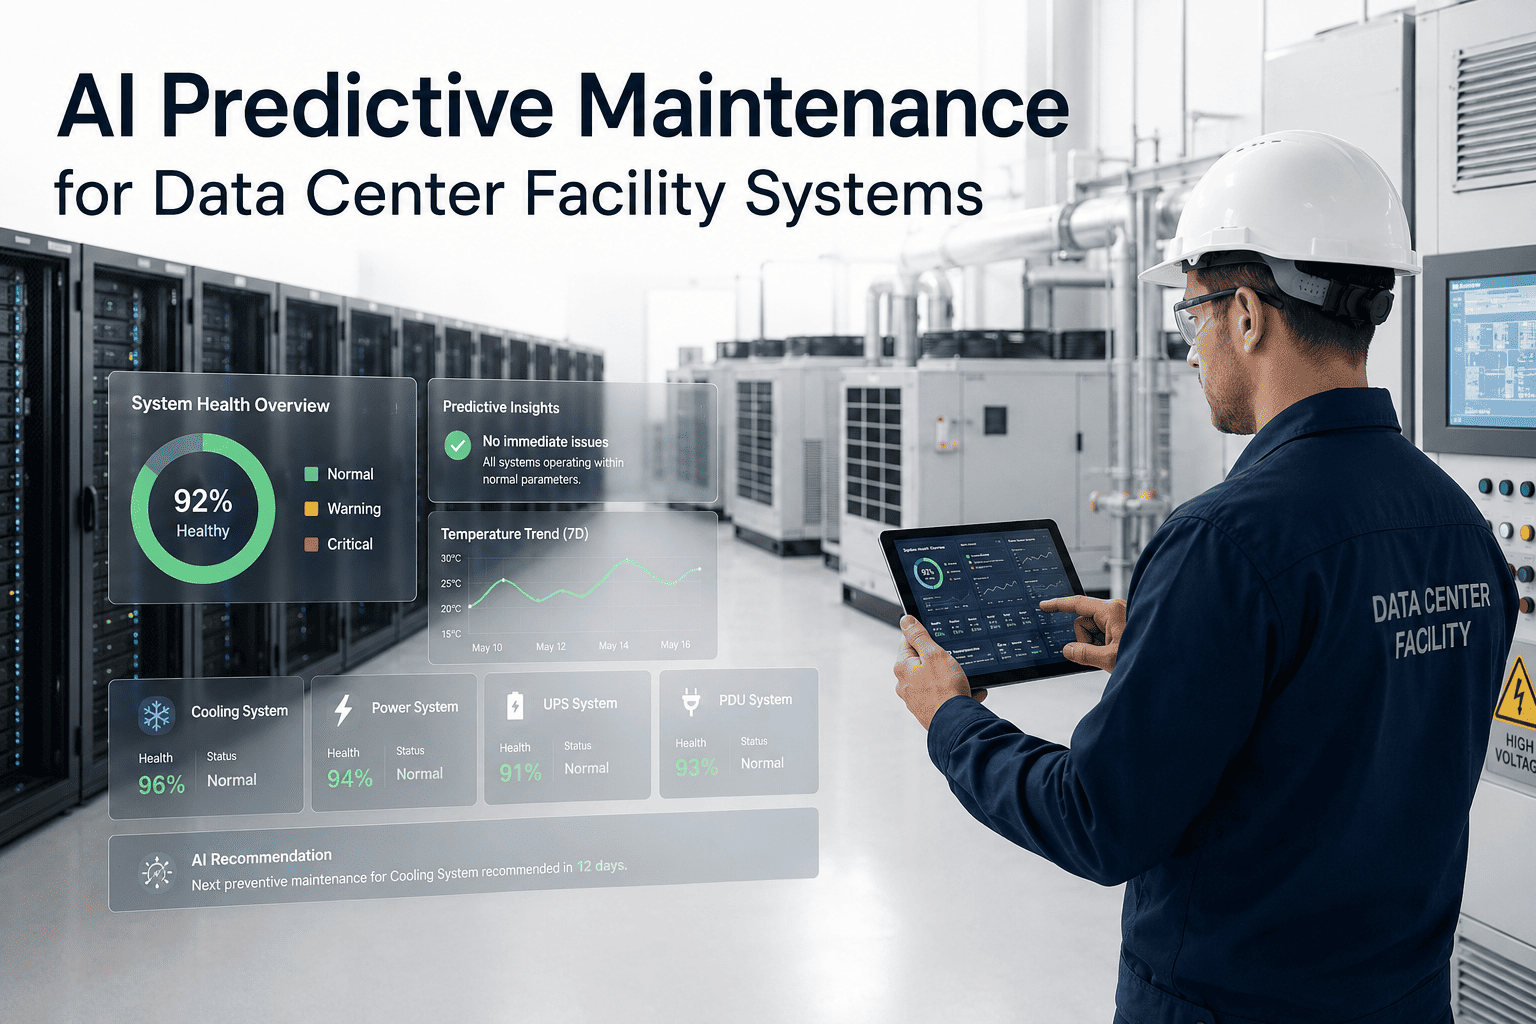
Moving from Reactive to Predictive
Not all data requires the same action. Knowing when to simply monitor a trend versus when to shut down an asset immediately can mean the difference between a minor repair and a destroyed machine. To ensure your team is always working from the latest data, you can get started with our data analytics dashboard.
Data-Driven Action Guide
Centralize Your Maintenance Data
Stop using disconnected spreadsheets and paper logs. Oxmaint automatically aggregates your asset data, calculates key metrics, and generates actionable insights.
The Real Cost of Ignoring Data
Frequently Asked Questions
What is the most important metric to start tracking?
For beginners, Planned Maintenance Percentage (PMP) and Mean Time Between Failures (MTBF) offer the clearest picture of how reactive vs. proactive your current operations are.
How do I collect condition data on older equipment?
You don't need built-in sensors. Portable tools for vibration analysis, thermal imaging, and routine oil sampling can provide excellent data on legacy machines without expensive retrofits.
What is the difference between predictive and preventive maintenance?
Preventive maintenance occurs on a strict time or usage schedule regardless of condition, while predictive maintenance relies on real-time data to perform service only when an asset is actually showing signs of degradation.
How long does it take to see ROI from a data-driven program?
While basic workflow efficiency improves within weeks, hard ROI from prevented failures and optimized inventory typically becomes evident between 6 to 12 months as your historical data baselines mature.
Do I need to hire data scientists to understand this information?
No. Modern CMMS platforms and predictive maintenance software do the heavy lifting for you, automatically analyzing the data streams and translating them into simple, actionable alerts for your maintenance team.
Transform Your Maintenance Strategy Today
Join thousands of organizations using Oxmaint to turn their maintenance data into their most valuable asset.