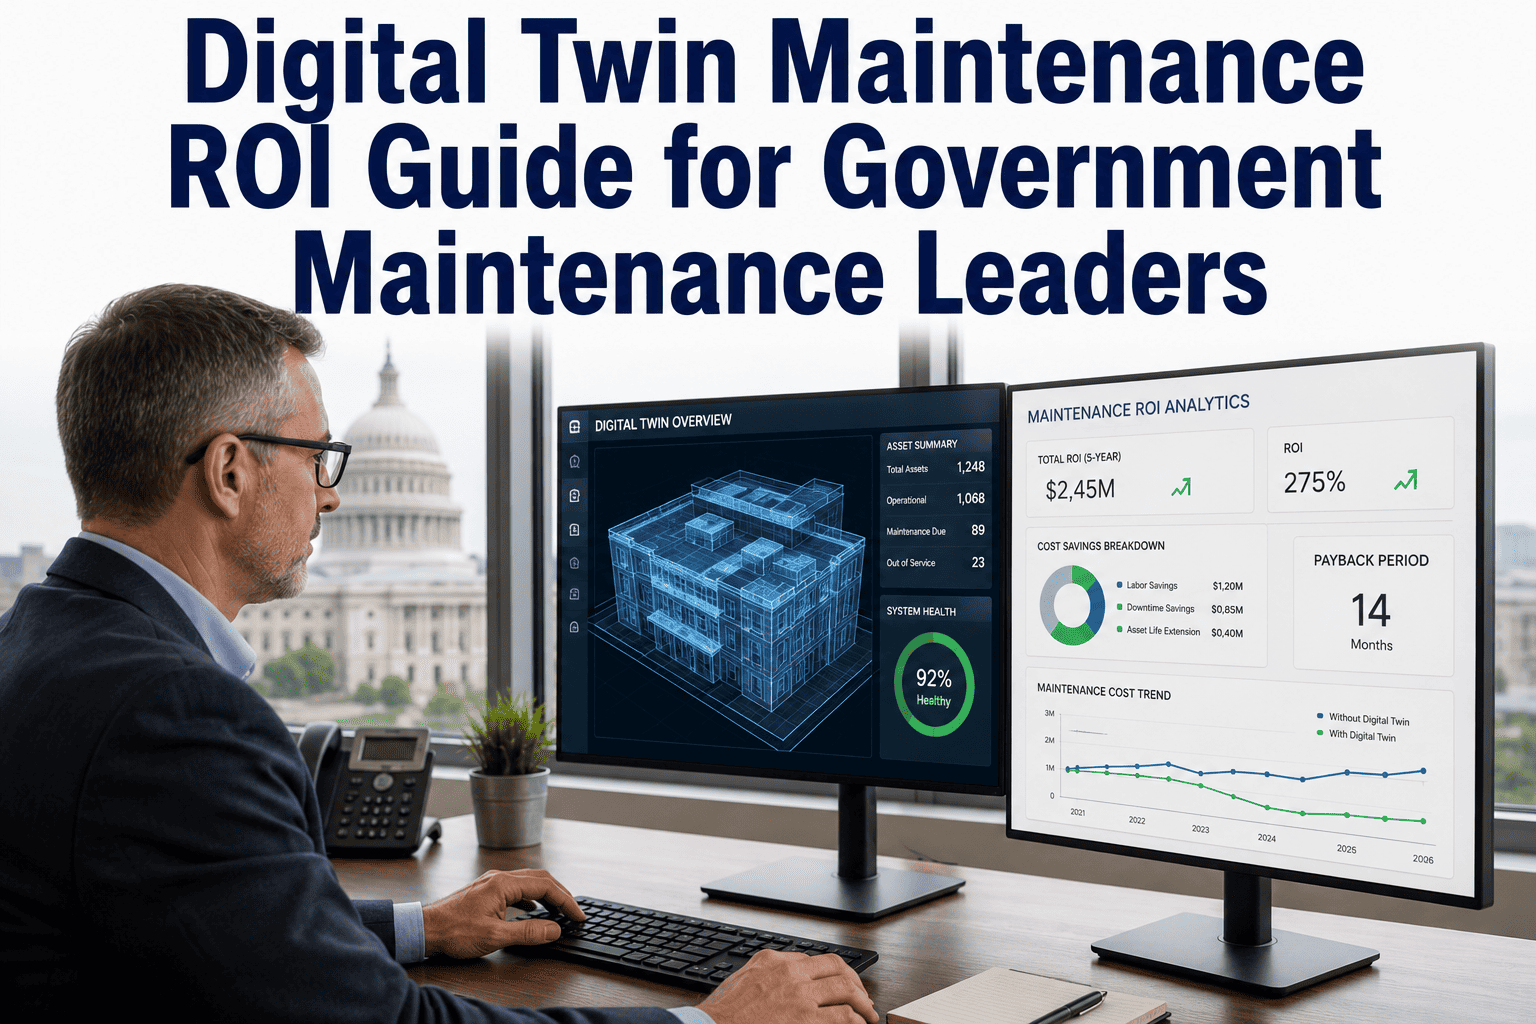
For a government maintenance leader, the case for any new system is not made in features — it is made in dollars, downtime avoided, and risk removed, defensible enough to survive a budget hearing and an auditor's review. Digital twin maintenance earns that case by turning a public agency's reactive, backlog-driven spending into planned work: a live model of each asset flags failures weeks ahead, so crews fix problems on schedule instead of paying the four-to-five-times premium of an emergency, and aging infrastructure runs longer before it has to be replaced. This guide lays out where the return actually comes from, how to size it, and which KPIs prove it — in the language a finance office and a council will accept. See how OxMaint Digital Twin Maintenance models the math. Book a demo to build the numbers around your own asset portfolio.
Digital Twin Maintenance ROI Guide for Government Maintenance Leaders
A numbers-first look at where digital twin maintenance pays back for public agencies — downtime avoided, emergency premiums eliminated, asset life extended, and every dollar defensible at the next budget review.
The Cost of the Status Quo
Every ROI case starts with the bill an agency already pays for doing nothing differently. Reactive, deferral-driven maintenance carries three compounding costs that rarely appear on a single line — which is exactly why they are easy to underfund and hard to defend.
Where the Return Comes From
Digital twin maintenance does not save money in one place; it removes cost across five distinct levers. These are the documented ranges reported across deployments — apply them to your own reactive spend to size the return.
Sizing the Return
The model is three numbers: what you invest, what you save each year, and how fast the first pays back the second.
The KPIs That Prove It
An ROI claim only holds if you can measure it afterward. Track these six and the program defends itself at every review.
Built for the Government Case
A public agency's ROI case has to clear bars a private facility never sees — a budget hearing, an auditor, and a duty to residents. Digital twin maintenance is built to clear all three.
What Public-Sector Leaders Say
A council does not fund "a digital twin" — it funds a number. Four to five times less per emergency repair, a deferred-maintenance backlog that finally starts shrinking instead of growing. When the projection is built straight from our own work-order history, the hearing gets short and the questions get easy to answer.
The repair savings are real, but the figure that actually moves a capital plan is deferred replacement. Extending an aging plant's useful life by even a fifth pushes a multi-million-dollar line item out by years. That is the kind of number a CFO and a council both understand without a translation.
Frequently Asked Questions
How quickly does digital twin maintenance pay back?
Across documented deployments, roughly 95% of organizations report positive ROI, with typical payback in 12 to 36 months and around a quarter reaching full payback inside the first year. The timeline depends on asset mix and how much reactive spend you are converting to planned work, which is why the projection should be built on your own data rather than a generic benchmark. Book a demo to model your payback period.
Where do the savings actually come from?
Five levers: a 20–50% cut in unplanned downtime, a 15–25% reduction in maintenance cost, roughly 20% longer asset life, a 20–30% smaller parts inventory, and fewer emergency and overtime callouts. No single lever carries the case alone — the return is the stack, applied to the reactive spending and downtime hours your agency already absorbs. Start free to map the levers to your assets.
Is the four-to-five-times emergency ratio real?
It is the most consistently documented figure in the field: a proactive, scheduled repair costs four to five times less than the same repair done as an emergency on a failed asset. For a public agency running largely reactive, that ratio alone often funds the program, before downtime, inventory, or asset-life savings are even counted. Book a demo to apply the ratio to your spend.
How do I justify this at a budget hearing?
By making every number traceable to your own records. The model draws on your asset inventory, downtime history, and reactive spend, so each projected saving has a source a finance office can check and an auditor can follow. As the program runs, the same KPIs that justified it become the evidence that it worked — which makes the next hearing easier than the first. Start free to build a defensible model.
Does it help with our deferred-maintenance backlog?
Directly — by modeling the worst-condition assets first, you convert a vague, intimidating backlog into a funded, sequenced plan with a quantified payoff per asset. One honest caveat: assets already carrying heavy deferred maintenance may show 15–30% lower early benefit, which is a reason to pair the twin with a catch-up plan rather than a reason to wait. Book a demo to triage your backlog.
Which KPIs should we track to prove it?
Unplanned downtime, total maintenance cost, asset useful life, parts inventory value, failure-warning lead time, and overall ROI. Those six tie the operational result back to the financial case, so the program is measured the same way it was sold. Tracking them continuously also surfaces where the next round of savings is hiding. Start free to set up your KPI dashboard.
Turn the Maintenance Budget Into a Return You Can Defend
OxMaint builds a digital twin on your own asset and work-order data, projects the savings lever by lever, and tracks every KPI as the program runs — so public maintenance spending becomes planned, provable, and defensible from the first hearing to the audit.