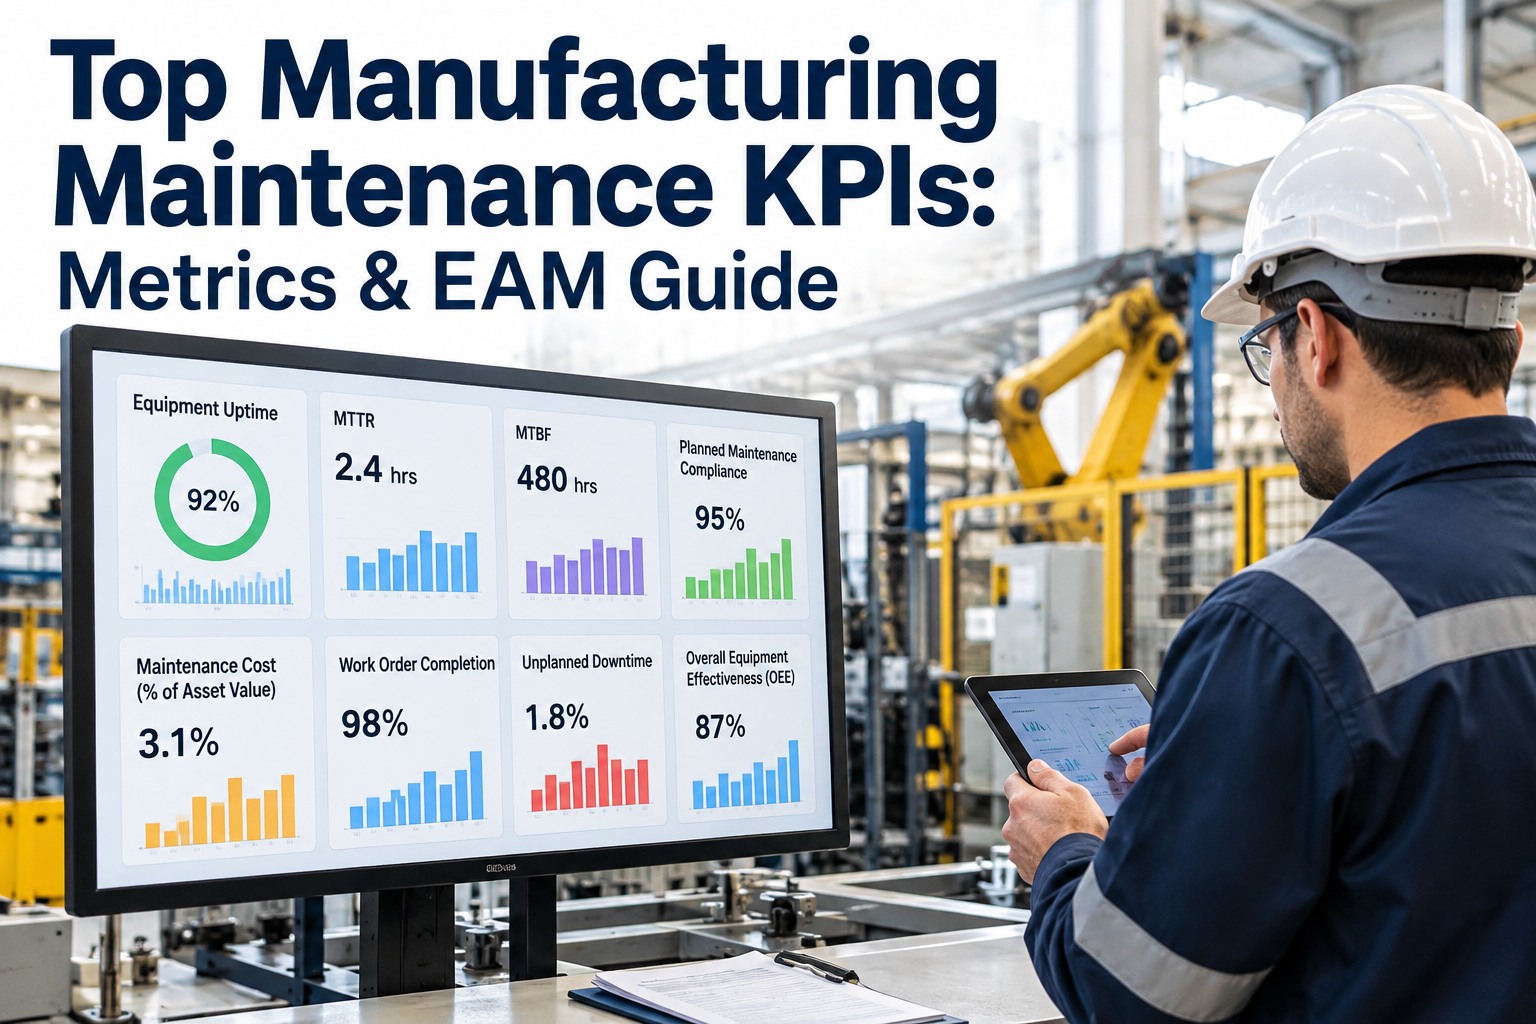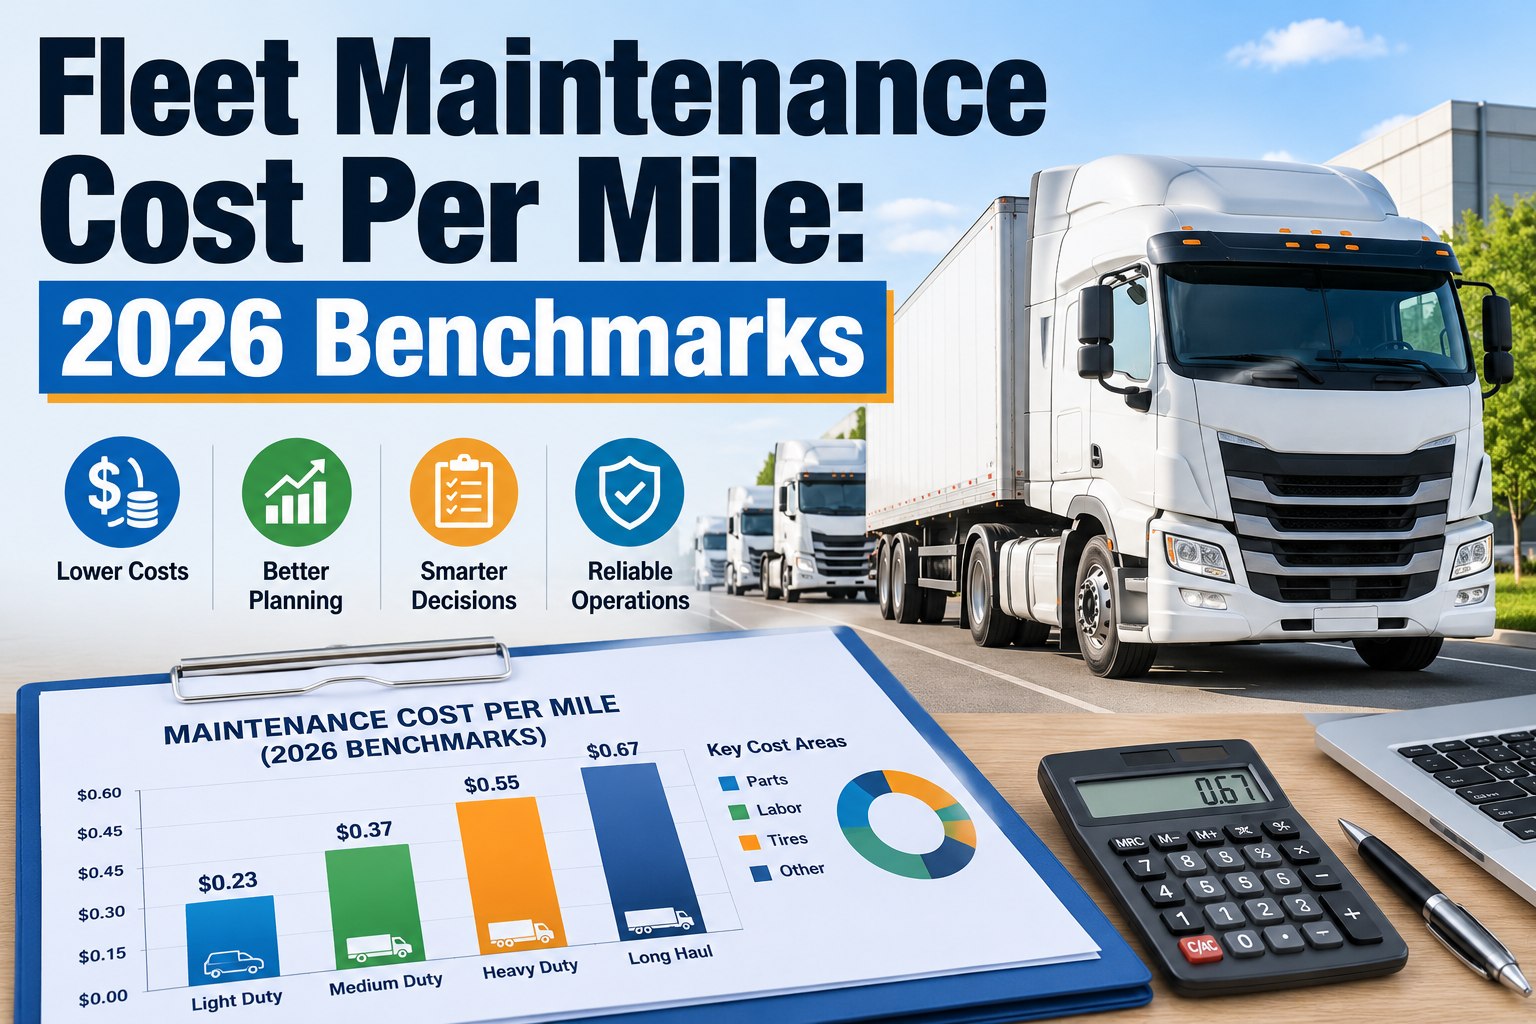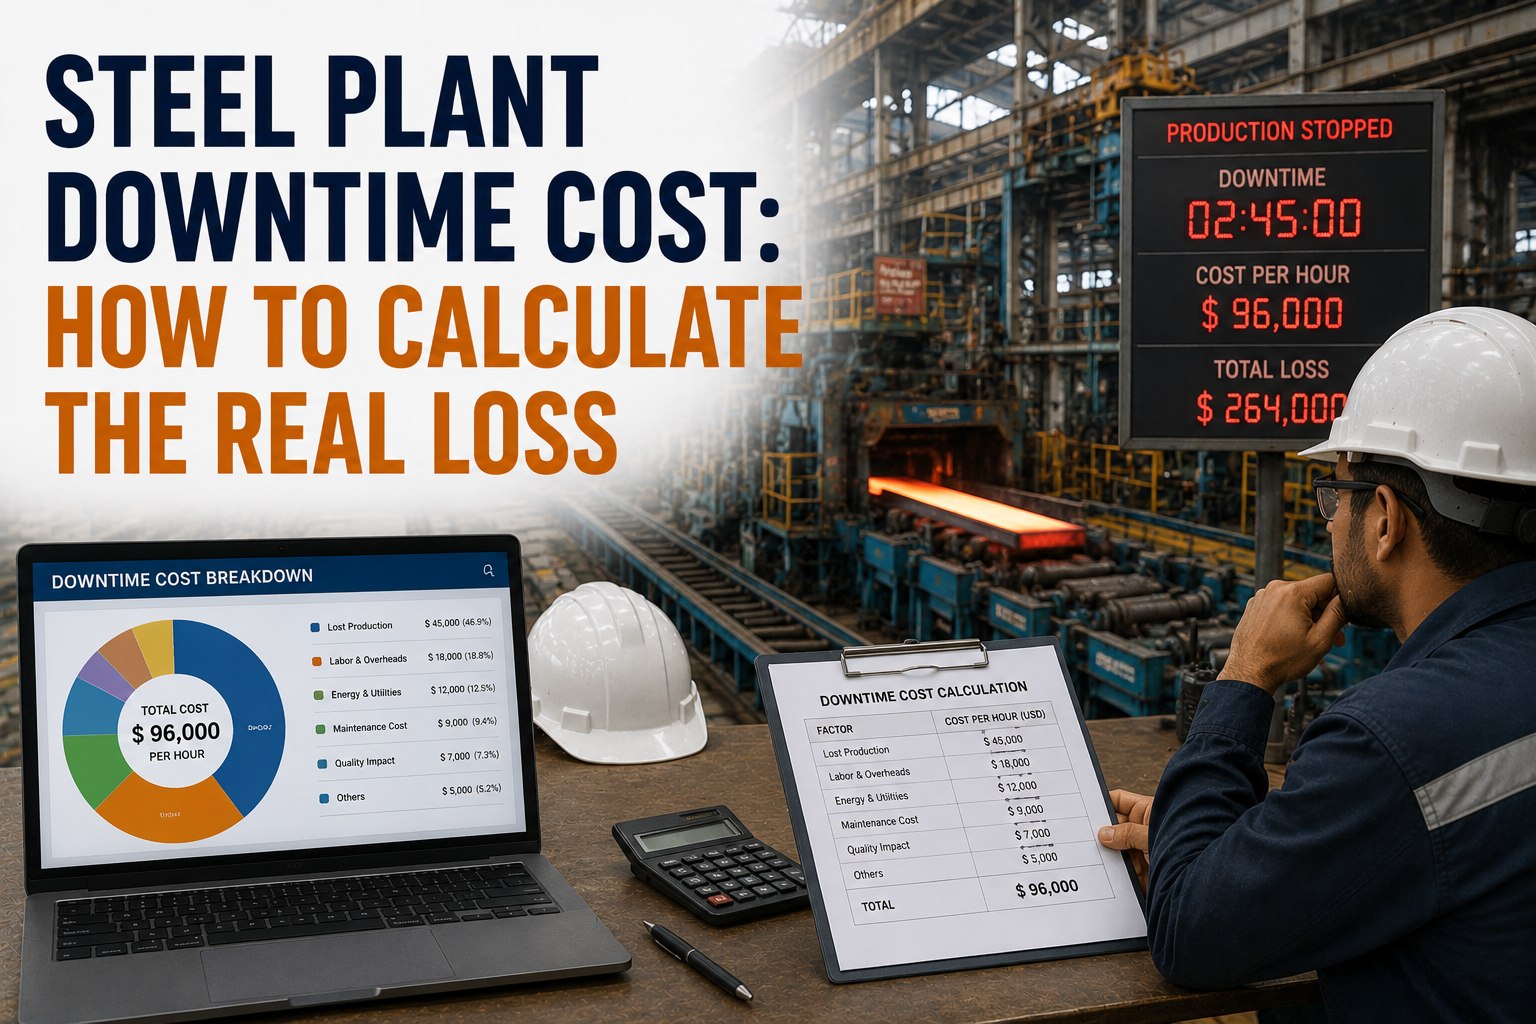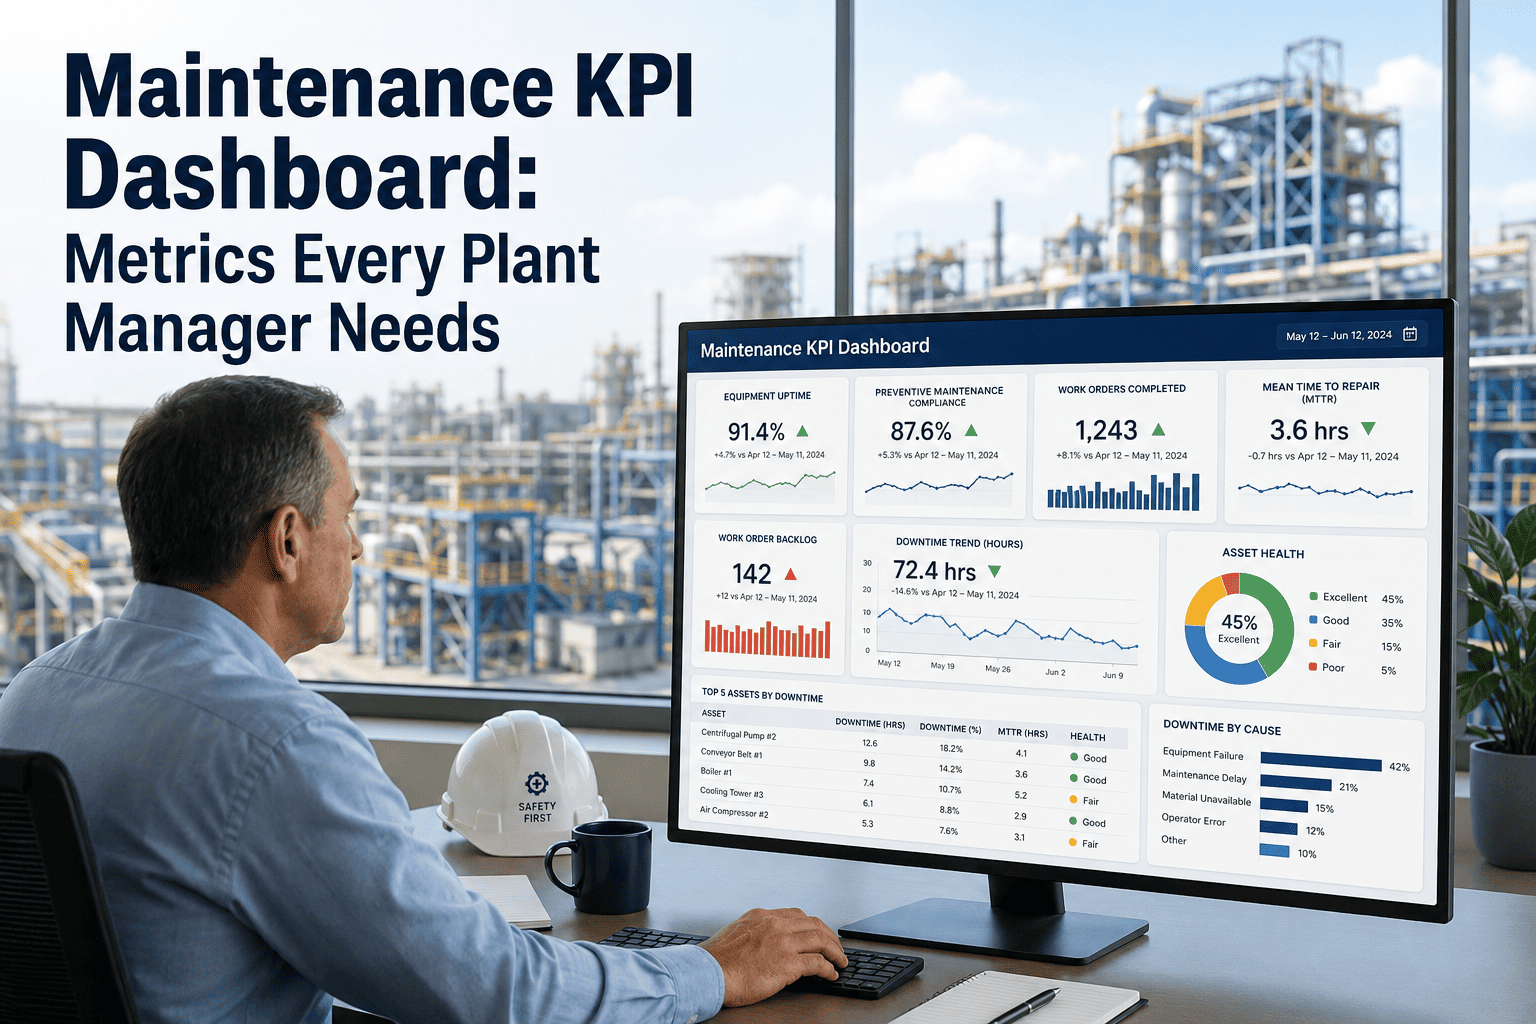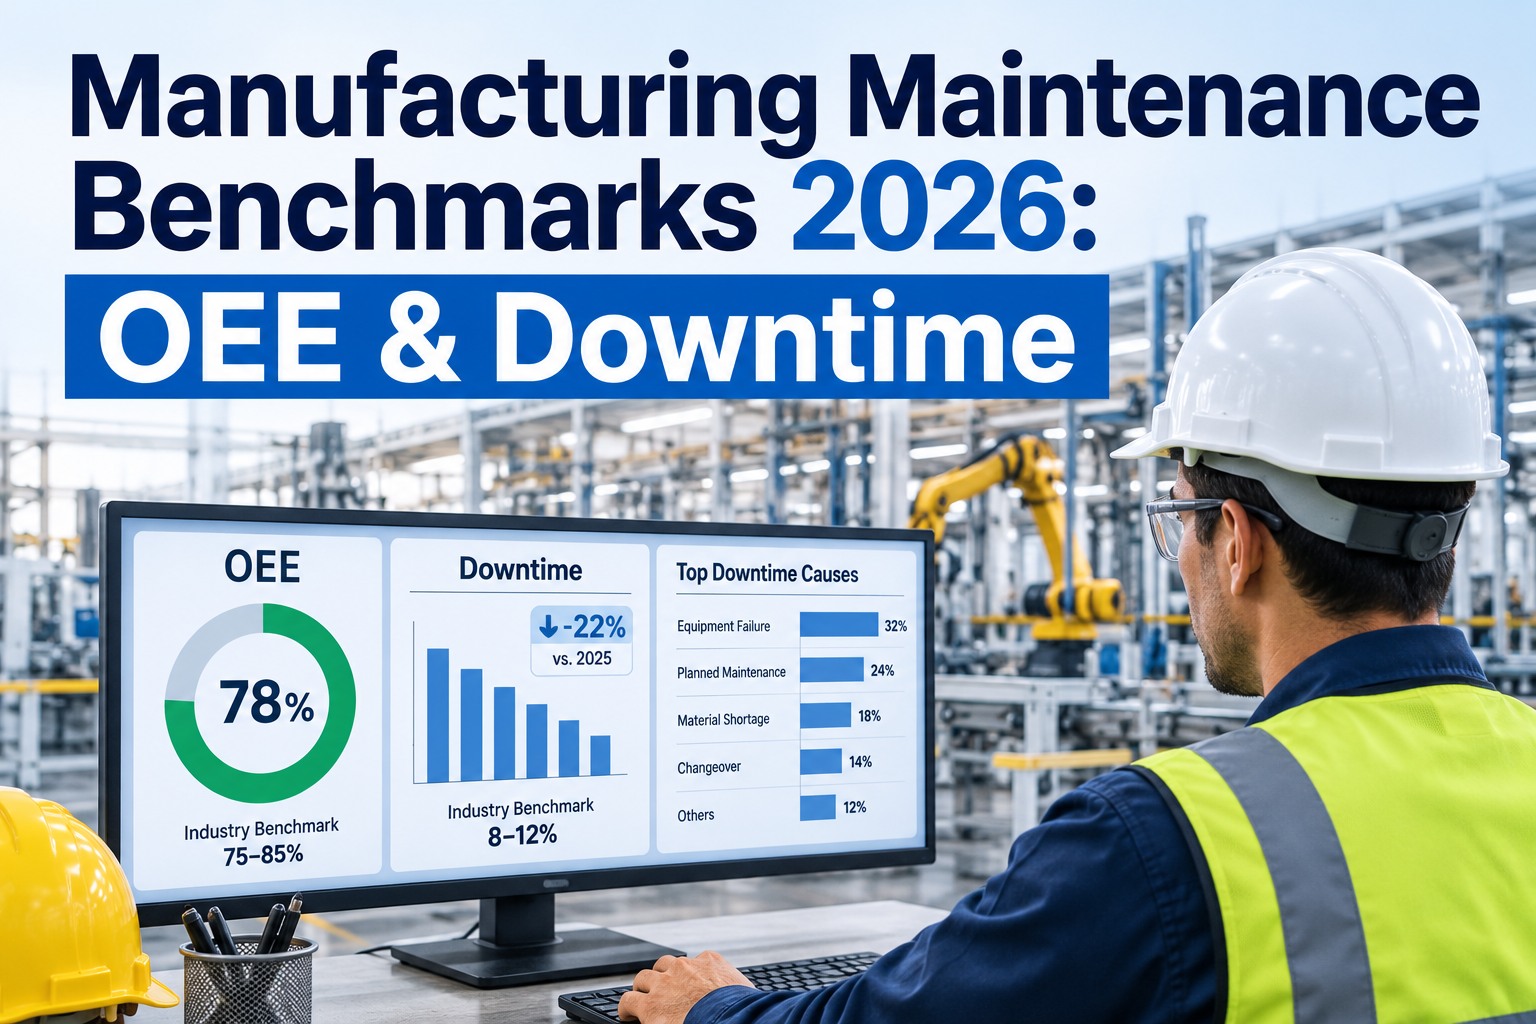
For most plants, the gap between a 45% OEE and a world-class 85% OEE is not a technology problem — it is a measurement problem. Maintenance benchmarks for 2026 show that manufacturers who actively track OEE, MTBF, MTTR and PM compliance against industry peers recover 15–20% more capacity from the same asset base, while laggards absorb six- and seven-figure downtime losses they never fully see. This page turns the latest reliability data into a practical yardstick you can hold your operation against, then shows how OxMaint converts those numbers into a closed improvement loop. When you are ready to stop estimating and start benchmarking, you can Start Free Trial and have your first KPI dashboard live the same day.
Stop guessing where your plant stands. Start measuring against world-class.
Industry data shows unplanned downtime now costs manufacturers an average of $260,000 per hour — and the average plant runs at 60% OEE while top-quartile peers exceed 80%. Benchmark your program, find the gap, close it.
Where the average plant actually sits in 2026
Reliability benchmarks only matter if they are honest. Below is the distribution of key maintenance KPIs across discrete and process manufacturers surveyed in the 2026 reliability data set — and where world-class performance actually begins.
| KPI | World-Class | Industry Average | Laggard (Bottom Quartile) |
|---|---|---|---|
| OEE | ≥ 85% | 60% | < 40% |
| MTBF | ≥ 400 hrs | 180 hrs | < 80 hrs |
| MTTR | ≤ 2 hrs | 17 hrs | > 36 hrs |
| PM Compliance | ≥ 95% | 74% | < 55% |
| Unplanned Downtime | < 5% | 17% | > 30% |
| Schedule Compliance | ≥ 90% | 68% | < 50% |
OEE, MTBF, MTTR and PM compliance — defined and decoded
Every maintenance benchmark rolls up to four numbers. If yours are not visible on a single dashboard by 8 a.m. every Monday, you are managing reactively.
OEE — Overall Equipment Effectiveness
The composite score. World-class is 85%; the average plant is 60%, meaning 40% of paid production capacity evaporates. Availability captures downtime, Performance captures speed loss, Quality captures scrap and rework.
MTBF — Mean Time Between Failures
Your reliability heartbeat. Below 100 hours means assets fail more often than weekly — a sign of run-to-failure culture. World-class plants sustain 400+ hours through condition-based maintenance and disciplined PM execution.
MTTR — Mean Time To Repair
How fast you recover. The 17-hour industry average reflects parts hunting, paperwork and waiting — not the wrench time itself. Best-in-class plants hold MTTR under 2 hours through kit staging, SOPs and mobile work order access.
PM Compliance — Planned Maintenance Execution
The leading indicator that predicts every other metric. Below 70% compliance, MTBF collapses within 90 days. Above 95%, unplanned downtime drops 30–40% within two quarters — the most leveraged number in reliability.
What downtime actually costs — and where the money goes
Unplanned downtime is rarely one cost. It is a cascade: lost throughput, idle labor, scrap, expedited freight, overtime and reputational penalties. Most plants capture only the first line.
Average across discrete manufacturers in 2026; automotive and semiconductor plants exceed $1.3M/hr.
The average plant loses nearly one shift in five to unplanned downtime — enough to erase a typical 8% operating margin.
A reactive repair costs 3.2× a planned equivalent — overtime, expedited parts and secondary damage to adjacent equipment.
A worked example: the 180-asset plant that closed the gap in 6 months
A mid-sized food & beverage manufacturer ran 58% OEE, 19% unplanned downtime and 62% PM compliance. Here is the quarter-by-quarter path to 74% OEE and $1.6M in recovered margin.
Deployed OxMaint CMMS across 180 assets. Baseline benchmark report revealed 38% of PMs were overdue and 12 critical assets carried zero spare parts coverage. PM compliance lifted from 62% to 81% by week 12.
Introduced condition-based monitoring on the 12 critical assets. MTBF rose from 140 hrs to 230 hrs. Unplanned downtime dropped from 19% to 13% as failures were caught in the P-F interval instead of at breakdown.
Reassigned 35% of reactive wrench time to planned work. MTTR fell from 14 hrs to 6 hrs through kit staging and mobile SOPs. PM compliance crossed 90%, and OEE reached 68%.
Closed the loop with KPI dashboards reviewed weekly. OEE settled at 74%, unplanned downtime at 8%, and the plant recovered $1.6M in annualized gross margin — a 14-week payback on a $38K CMMS and training investment.
How OxMaint turns benchmark data into continuous improvement
Benchmark reporting
Auto-generated reports compare your OEE, MTBF, MTTR and PM compliance against industry quartiles — so every Monday meeting starts with the gap, not opinions.
Gap analysis
Pinpoint the exact assets, shifts and failure modes dragging your numbers down — ranked by financial impact, not just frequency.
KPI dashboards
Live tiles for OEE, downtime, PM compliance and wrench time — role-filtered for plant managers, reliability engineers and maintenance leads.
CMMS analytics
Trend analysis, failure-mode Pareto and P-F interval tracking — the analytics layer that keeps maintenance performance visible and continuously improving.
See your benchmark gap in one week — not one quarter.
Upload your asset list and work order history. OxMaint returns a baseline benchmark report, KPI dashboard and prioritized improvement plan.
Answers to the questions maintenance leaders ask first
What is a good OEE benchmark for manufacturing in 2026?
World-class OEE is 85% or higher, but only the top quartile of plants sustain that. The 2026 industry median sits at 60%, with the bottom quartile below 40%. If you are between 60% and 70%, you are average — not good — and the fastest lever is usually PM compliance, not new equipment. A target of 75% within 12 months is realistic for most plants that deploy a CMMS and enforce weekly KPI reviews.
How is MTTR calculated and what is a realistic target?
MTTR is total repair time divided by the number of repair events. The industry average is 17 hours, but most of that is not wrench time — it is parts hunting, approvals and waiting for a technician. A realistic first-year target is to cut MTTR by 40–50% through kit staging, mobile work orders and pre-attached SOPs. World-class plants sustain MTTR under 2 hours. You can Start Free Trial and measure your current MTTR within the first day of deployment.
What does unplanned downtime really cost per hour?
The 2026 average across discrete manufacturing is $260,000 per hour, but the figure varies sharply by industry: food & beverage plants average $30K–$50K/hr, automotive $1.3M/hr and semiconductor over $2M/hr. The true cost includes lost throughput, idle labor, scrap, expedited parts and recovery overtime — most plants capture only the first item and therefore understate the real impact by 60% or more.
How quickly can a CMMS move our benchmarks?
Visibility improvements show in the first 30 days — overdue PMs surface immediately and compliance typically lifts 15–20 points within a quarter. Meaningful MTBF and OEE gains appear in 90–180 days as condition-based monitoring and planned-work ratios take hold. Full benchmark transformation — moving from the median quartile to the top — usually takes 6 to 12 months of disciplined weekly KPI review.
Which maintenance KPI should we improve first?
PM compliance. It is the leading indicator that predicts MTBF, MTTR and OEE. If your PM compliance is below 80%, fix that first — everything else will follow within two quarters. Once compliance exceeds 90%, shift focus to condition-based monitoring and failure-mode analysis to push MTBF above 300 hours. To map your starting point, Book a Demo and we will run a 30-minute benchmark assessment against your asset list.
Measure first. Improve next. Lead the quartile.
Join the plants using OxMaint to benchmark OEE, MTBF, MTTR and PM compliance — and turn the data into a closed improvement loop.
Free 14-day trial · No credit card