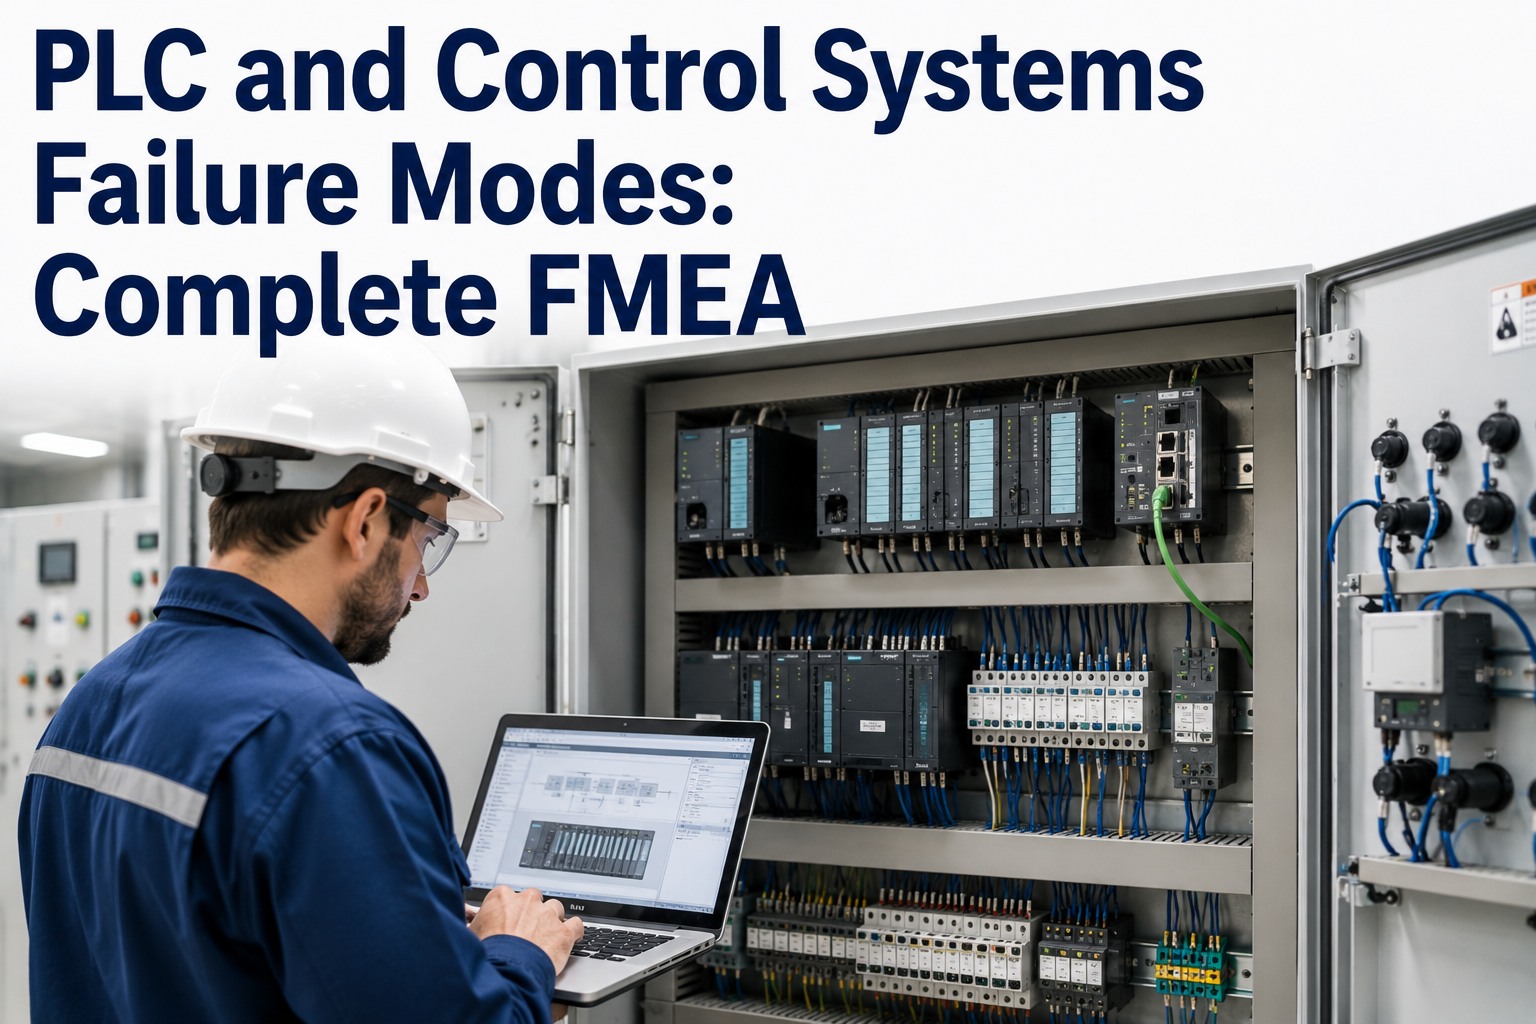
Criticality analysis for PLC & control systems is the process of scoring each controller, I/O rack, and power supply by its consequence of failure — so your maintenance budget goes to the assets that can actually stop production. A single failed PLC on a bottleneck line can cost $10K–$50K per hour in lost output, yet most plants still treat every control asset with the same calendar-based PM. This guide walks you through a defensible consequence-of-failure scoring model, a 5×5 risk matrix, and the maintenance strategy each criticality tier demands under Reliability-Centered Maintenance (RCM). If you want to skip the spreadsheets and run this ranking inside a live asset hierarchy, Start Free Trial with OxMaint and score your first control system in under an hour.
Which of your PLCs can afford to fail — and which one would cost you $260K before lunch?
If you can't answer that in 10 seconds, your preventive maintenance plan is guessing. Consequence-of-failure scoring turns PLC & control systems criticality ranking from opinion into arithmetic — and tells you exactly where predictive monitoring, spares, and PM hours belong.
Why PLC & Control Systems Criticality Ranking Matters More Than Ever
Unplanned industrial downtime now averages $125,000 per hour across process and discrete manufacturing — and control-system failures are disproportionately expensive because they stop entire lines, not single machines.
A packaging plant running 40 PLCs, 300 I/O points, and 60 power supplies cannot give every component equal attention — the math doesn't work. Reliability studies consistently show that 10–20% of assets drive 80% of downtime cost. Without a structured PLC & control systems risk assessment, teams over-maintain low-impact hardware (a non-critical HMI gets quarterly inspections) while a sole-sourced CPU on the main line runs to failure with no spare on the shelf. Criticality ranking fixes this by assigning every control asset a defensible priority score based on what actually happens when it fails — safety exposure, production loss, redundancy, repair time, and parts availability. It is the foundation of RCM, ISO 55000 asset management, and any credible maintenance budget conversation with plant leadership.
The 6 Criticality Criteria for PLC & Control Systems Failure Impact Scoring
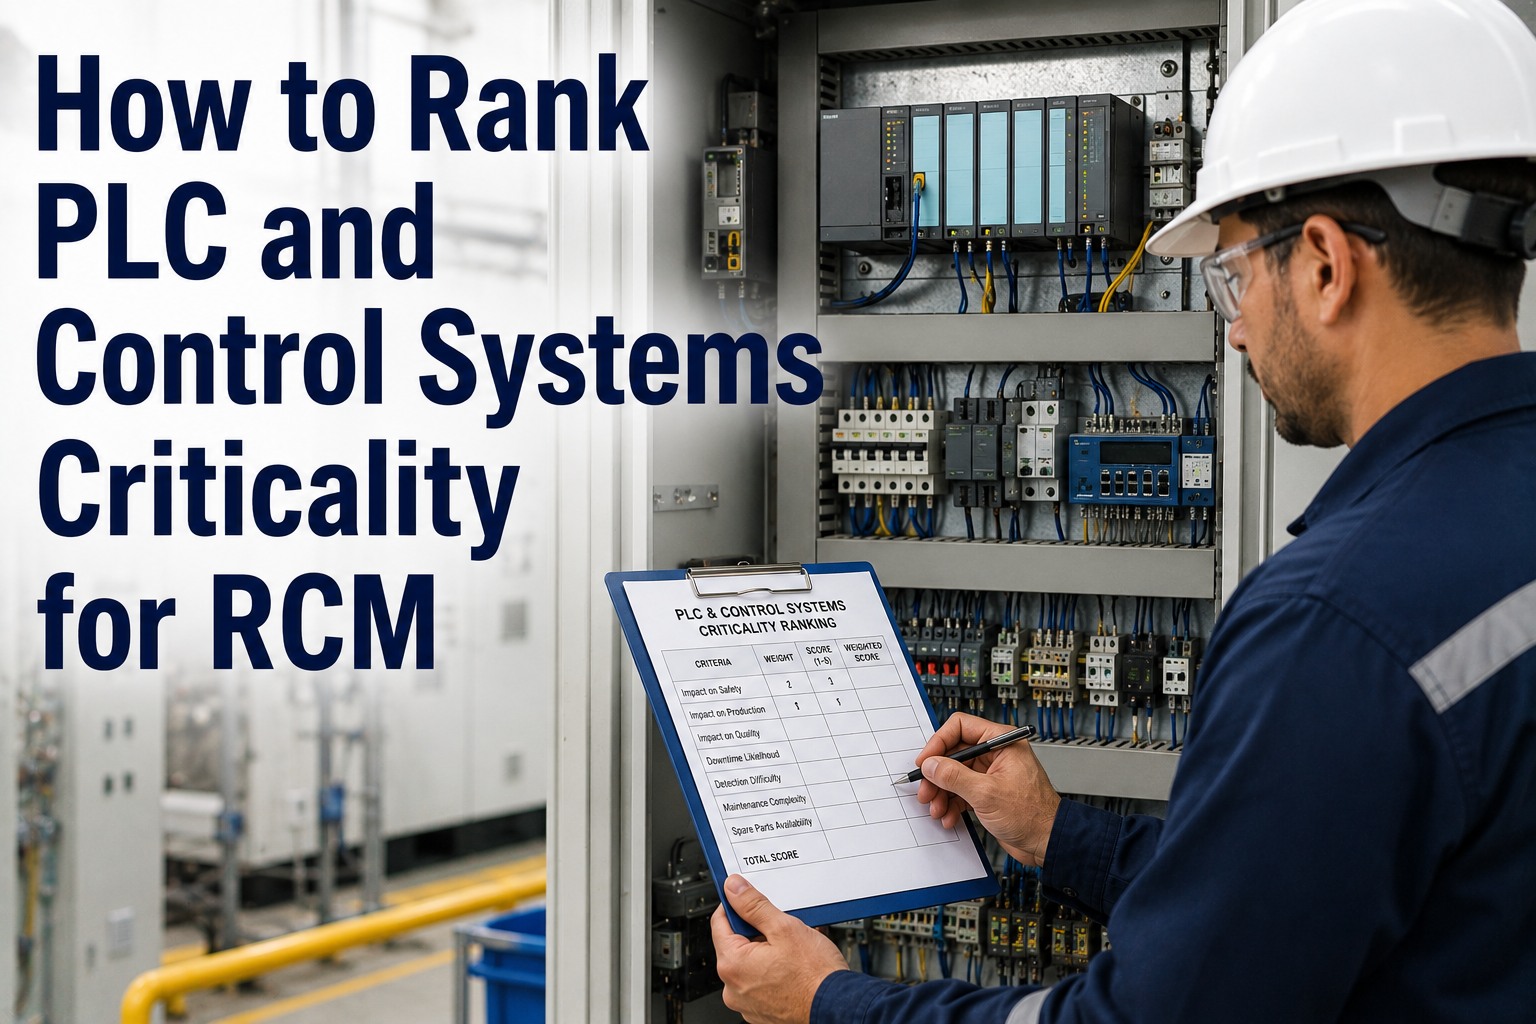
A defensible PLC & control systems criticality criteria set scores every asset 1–5 on six dimensions — then weights them into a single consequence score from 6 to 100.
Does failure disable an interlock, ESD loop, or emissions control? Any safety-instrumented function scores 5 automatically — no debate. Weight: 25%.
Quantify lost output per hour. A PLC controlling a $20K/hr bottleneck line scores 5; one on a bypassable utility scores 1–2. Weight: 25%.
Hot-standby CPU with automatic failover? Score 1. Single controller, no manual workaround? Score 5. Redundancy is the biggest score modifier. Weight: 15%.
Mean time to restore, including program reload and loop checkout. Obsolete platforms with 2-week lead times score 5; shelf-spare swaps score 1. Weight: 15%.
Can a failed analog input or drifting PID loop scrap a batch before anyone notices? Off-spec product, rework, and customer escapes live here. Weight: 10%.
Age, heat, vibration, power quality, and I/O & power supply failure history. Capacitors in 24VDC supplies degrade predictably after 5–7 years. Weight: 10%.
Each criterion rated 1–5. Result: 20–100. Example: a non-redundant PLC on a safety-relevant bottleneck line — (5×25 + 5×25 + 5×15 + 4×15 + 3×10 + 3×10) ÷ 5 = 89 → Tier 1, Critical.
PLC & Control Systems Risk Matrix: From Score to Maintenance Strategy
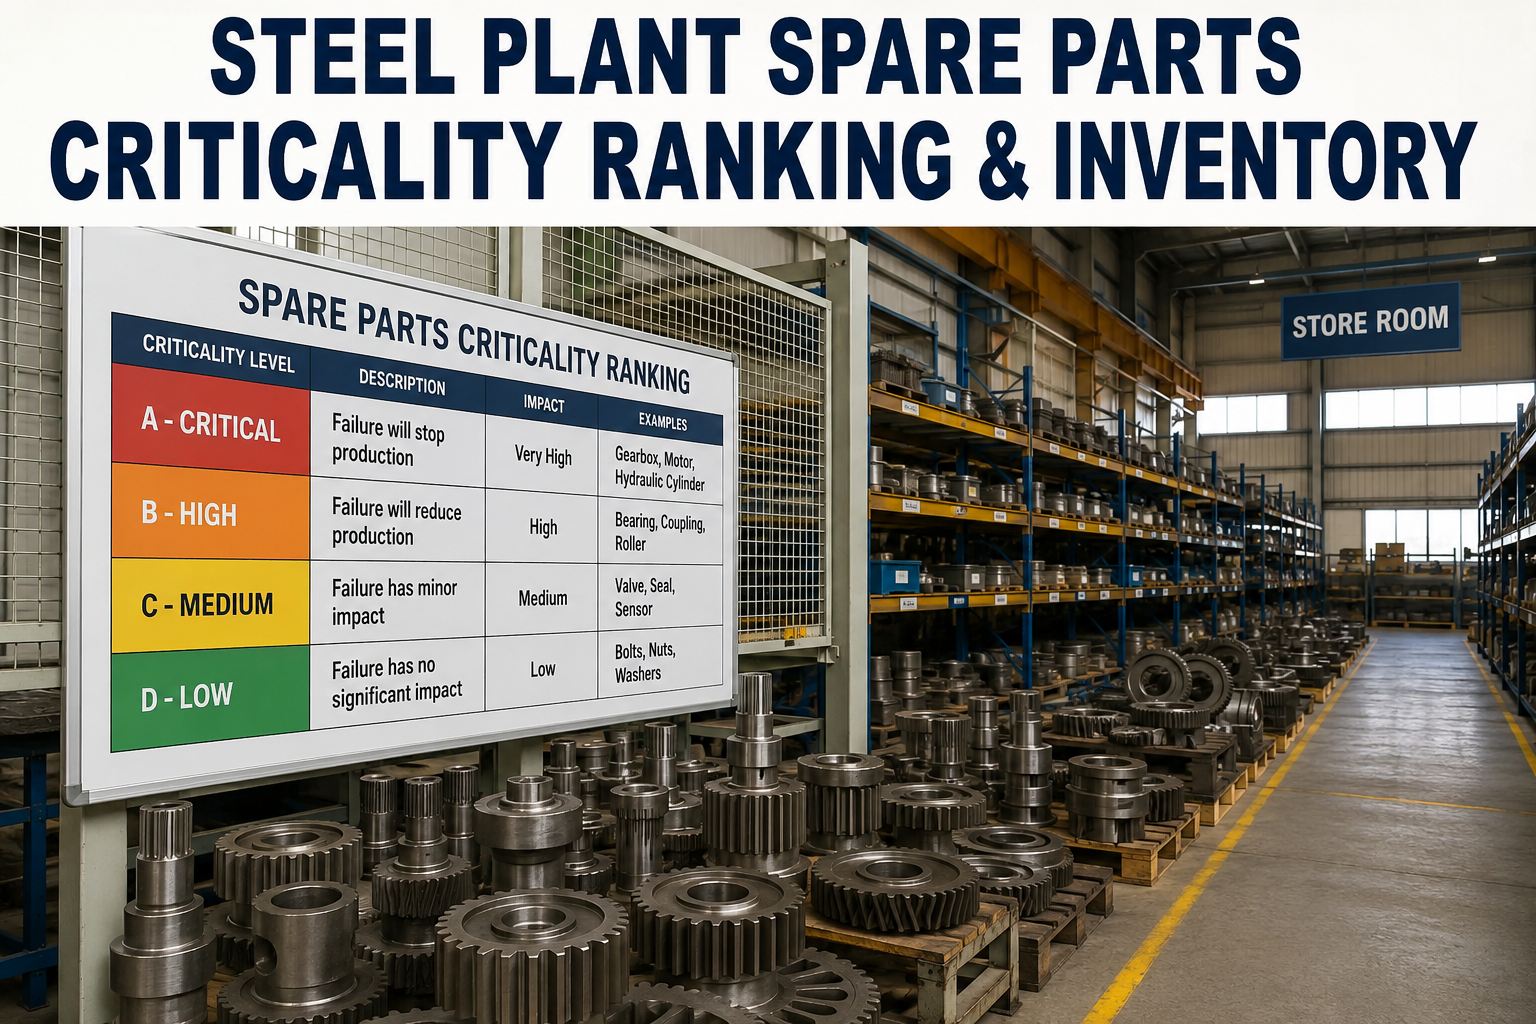
Four tiers cover 95% of plants. Each tier gets a fundamentally different maintenance strategy — this is where PLC & control systems maintenance priority becomes action.
| Tier | Score Range | Asset Examples | RCM Maintenance Strategy | Spares Policy |
|---|---|---|---|---|
| Tier 1 · Critical | 80–100 | Line-master PLCs, safety interlock controllers, sole-sourced CPUs | Predictive monitoring (diagnostics, temperature, power-supply health), quarterly PM, firmware & backup audits, failure-mode reviews | 100% on-site spares, tested annually |
| Tier 2 · High | 60–79 | Cell controllers, main I/O racks, network switches on critical loops | Semi-annual PM, condition checks, program backup every 90 days, battery replacement on schedule | Key spares on-site or 24-hr vendor SLA |
| Tier 3 · Medium | 40–59 | Redundant I/O, utility-system controllers, standalone HMIs | Annual PM, visual inspection, backup on change only | Shared spares pool across similar assets |
| Tier 4 · Low | 20–39 | Non-critical monitoring points, bypassable auxiliary controls | Run-to-failure with documented replacement procedure | No dedicated spares; standard lead-time order |
The payoff is immediate: Tier 1 assets get the predictive attention and spare inventory that prevent the $125K/hr event, while Tier 4 assets stop consuming PM hours that were never protecting anything. Plants that re-tier their control systems typically reallocate 25–35% of PM labor from low-value to high-value work without adding headcount.
How One Plant Re-Ranked 140 Control Assets in 3 Weeks
A 180-asset food & beverage facility spending $42K/year on control-system maintenance discovered 60% of its PM hours protected assets that couldn't stop production.
All 140 PLCs, I/O racks, power supplies, and network components imported into a structured hierarchy — site → area → line → control panel → component. OxMaint's CSV import cut this from a projected 2 weeks of data entry to 3 days.
A 4-hour workshop with production, EHS, and maintenance scored all six criteria per asset. Disagreements resolved with real downtime cost data — the filler-line PLC debate ended when someone pulled the $18K/hr line-rate figure.
22 assets moved to Tier 1–2 with quarterly PMs and on-site spares; 58 dropped to run-to-failure. Result: PM hours rebalanced with zero added budget, and the two highest-risk power supplies got redundant feeds within the quarter.
"We'd been inspecting a warehouse lighting controller quarterly for six years while our main pasteurizer PLC had no verified program backup. The criticality ranking exposed that in the first afternoon."
Run Your PLC & Control Systems Risk Assessment Inside OxMaint
Criticality ranking dies in spreadsheets. OxMaint keeps scores, tiers, PM plans, and spares live — connected to every work order your team touches.
Store consequence scores, tier, and criteria detail directly on each PLC, I/O rack, and power supply record. Work orders auto-inherit the tier — Tier 1 failures escalate instantly. Outcome: zero critical assets hidden in the queue.
Generate quarterly PMs for Tier 1, annual for Tier 3, none for Tier 4 — automatically. OxMaint schedules by tier so PM labor follows consequence, not habit. Outcome: 25–35% of PM hours reallocated to assets that matter.
Flag Tier 1 CPUs and power supplies as must-stock with min/max levels and reorder alerts. When a critical controller fails at 2 a.m., the spare is on the shelf — not on a 2-week lead time. Outcome: restore time cut from days to hours.
Dashboards show MTBF, failure history, and downtime cost filtered by tier — so you can prove to leadership that Tier 1 failures dropped 40% and justify the next reliability investment. Outcome: audit-ready, ISO 55000-aligned reporting.
Book a 30-minute demo — we'll build a live criticality ranking on three of your PLCs
Bring your asset list. Leave with a scored risk matrix, tier assignments, and a PM plan you can act on Monday morning.
PLC & Control Systems Criticality Analysis — Answered
It's a structured scoring method that ranks every control asset — PLCs, I/O modules, power supplies, network gear — by the consequence of its failure. Each asset is rated on safety impact, production loss, redundancy, repair time, and quality risk, producing a priority score that drives maintenance strategy, spares policy, and PM frequency under RCM.
Rate six criteria from 1–5 (safety, production loss, redundancy, repair time, quality impact, failure likelihood), apply weights — typically 25% each for safety and production, 15% each for redundancy and repair time, 10% each for quality and likelihood — then normalize to a 20–100 score. Scores of 80+ are Tier 1 critical assets requiring predictive monitoring and guaranteed spares.
Tier 1 assets get the full RCM stack: predictive condition monitoring (CPU diagnostics, cabinet temperature, power-supply health), quarterly preventive inspections, verified program backups every 90 days, battery replacement on schedule, and 100% on-site spares tested annually. You can automate tier-based PM scheduling in OxMaint — Start Free Trial and set it up in an afternoon.
Review annually at minimum, and immediately after any line reconfiguration, new equipment commissioning, significant failure event, or obsolescence notice from the vendor. Rankings decay fast — a Tier 3 PLC becomes Tier 1 the day its redundant partner is removed. Treat the risk matrix as a living document tied to your asset hierarchy, not a one-time project.
Yes. A modern CMMS like OxMaint stores criticality scores and tiers on each asset record, auto-generates PM schedules by tier, links spare-parts minimums to criticality, and escalates work orders on Tier 1 failures. This removes the spreadsheet drift that kills most ranking programs within 18 months — Book a Demo to see the workflow on your own asset structure.
Your most critical PLC already knows which one it is. Do you?
Import your control assets, score consequence of failure, and let OxMaint drive tier-based PMs, spares, and escalations — before the next $125K hour.