The industrial maintenance landscape is shifting faster in 2026 than at any point in the past two decades. Facilities still running paper-based PM logs and reactive repair queues are watching their competitors cut downtime by 50% and maintenance costs by a third — not through larger teams, but through smarter systems. Oxmaint's analytics dashboard gives maintenance leaders the real-time visibility, AI-driven alerts, and trend analysis to act on these shifts rather than fall behind them. This guide covers every major trend defining industrial maintenance in 2026 and what each one means for your operations today.
── HERO DASHBOARD ──Top Industrial Maintenance
Trends in 2026
From AI-powered anomaly detection to autonomous inspection robots, the forces reshaping industrial maintenance are moving from pilot programs to production deployment. Here is what is actually happening on plant floors this year — and how Oxmaint's analytics dashboard positions your team ahead of each shift.
The 6 Trends Reshaping Industrial Maintenance This Year
These are not projections — each trend is actively in deployment at industrial facilities in 2026, with measurable results already documented across manufacturing, energy, and heavy industry.
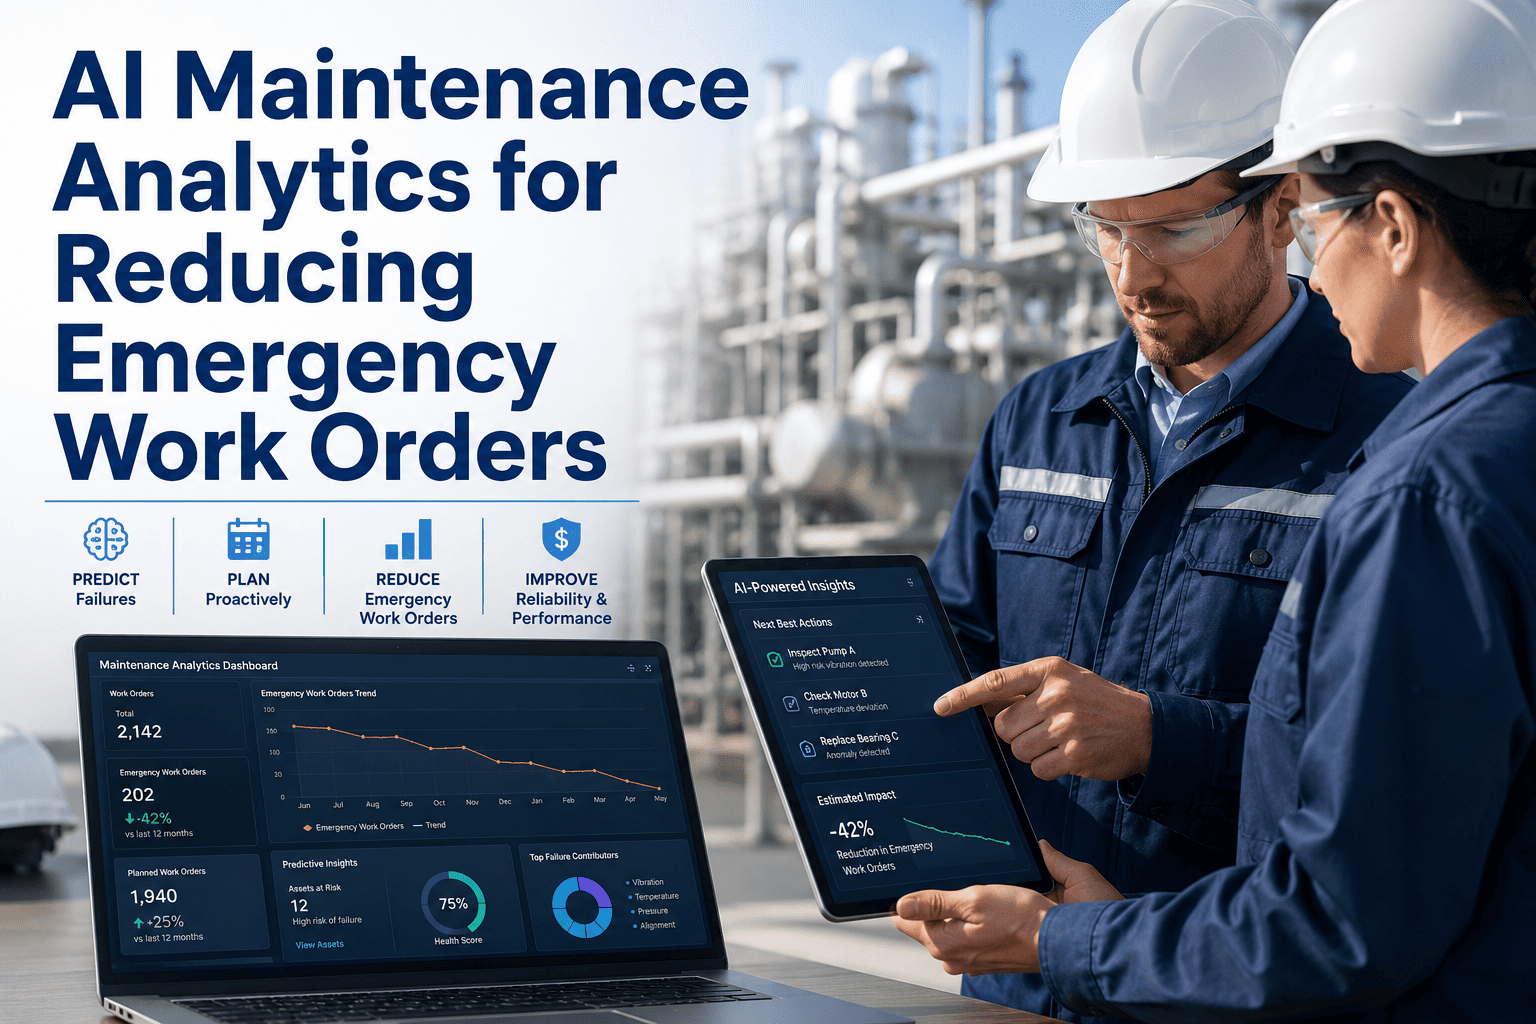
AI-Driven Failure Prediction at Scale
Machine learning models trained on vibration, thermal, and electrical sensor streams now deliver weeks of advance warning before equipment failure — across entire asset fleets, not just pilot assets. In 2026, this moves from proof-of-concept to standard operating procedure at competitive facilities. Start predicting failures with Oxmaint today.
Real-Time Analytics Dashboards Replacing Weekly Reports
Maintenance managers who once waited for end-of-week CSV exports now have live dashboards showing MTBF trends, work order backlogs, technician utilization, and asset health scores — all updating in real time. Oxmaint's analytics dashboard surfaces the insights that drive decisions, not just data that describes what already happened.
Industrial IoT Sensor Density Crossing the Tipping Point
Wireless vibration, thermal, and current sensors have dropped in cost by over 60% since 2020. In 2026, facilities are instrumenting entire production lines — not just priority assets — creating the continuous data streams that AI models require to deliver accurate predictions across every asset class.
Autonomous Inspection Replacing Hazardous Manual Rounds
Robotic inspection platforms now patrol acid areas, high-temperature zones, and confined spaces that previously required extensive PPE and time-limited human entry. Early deployments — including Outokumpu's three-site rollout — document 80%+ reduction in worker hazardous substance exposure alongside 20% fewer maintenance interventions through earlier anomaly detection.
AI-Optimized PM Intervals Eliminating Over-Maintenance
Fixed-interval preventive maintenance programs service 40% of assets when they are still in good condition — consuming labor and parts unnecessarily. In 2026, AI systems analyze actual usage patterns, load profiles, and failure history to recommend asset-specific PM intervals, targeting service only when condition data indicates genuine need. Activate interval optimization in Oxmaint to stop servicing healthy assets.
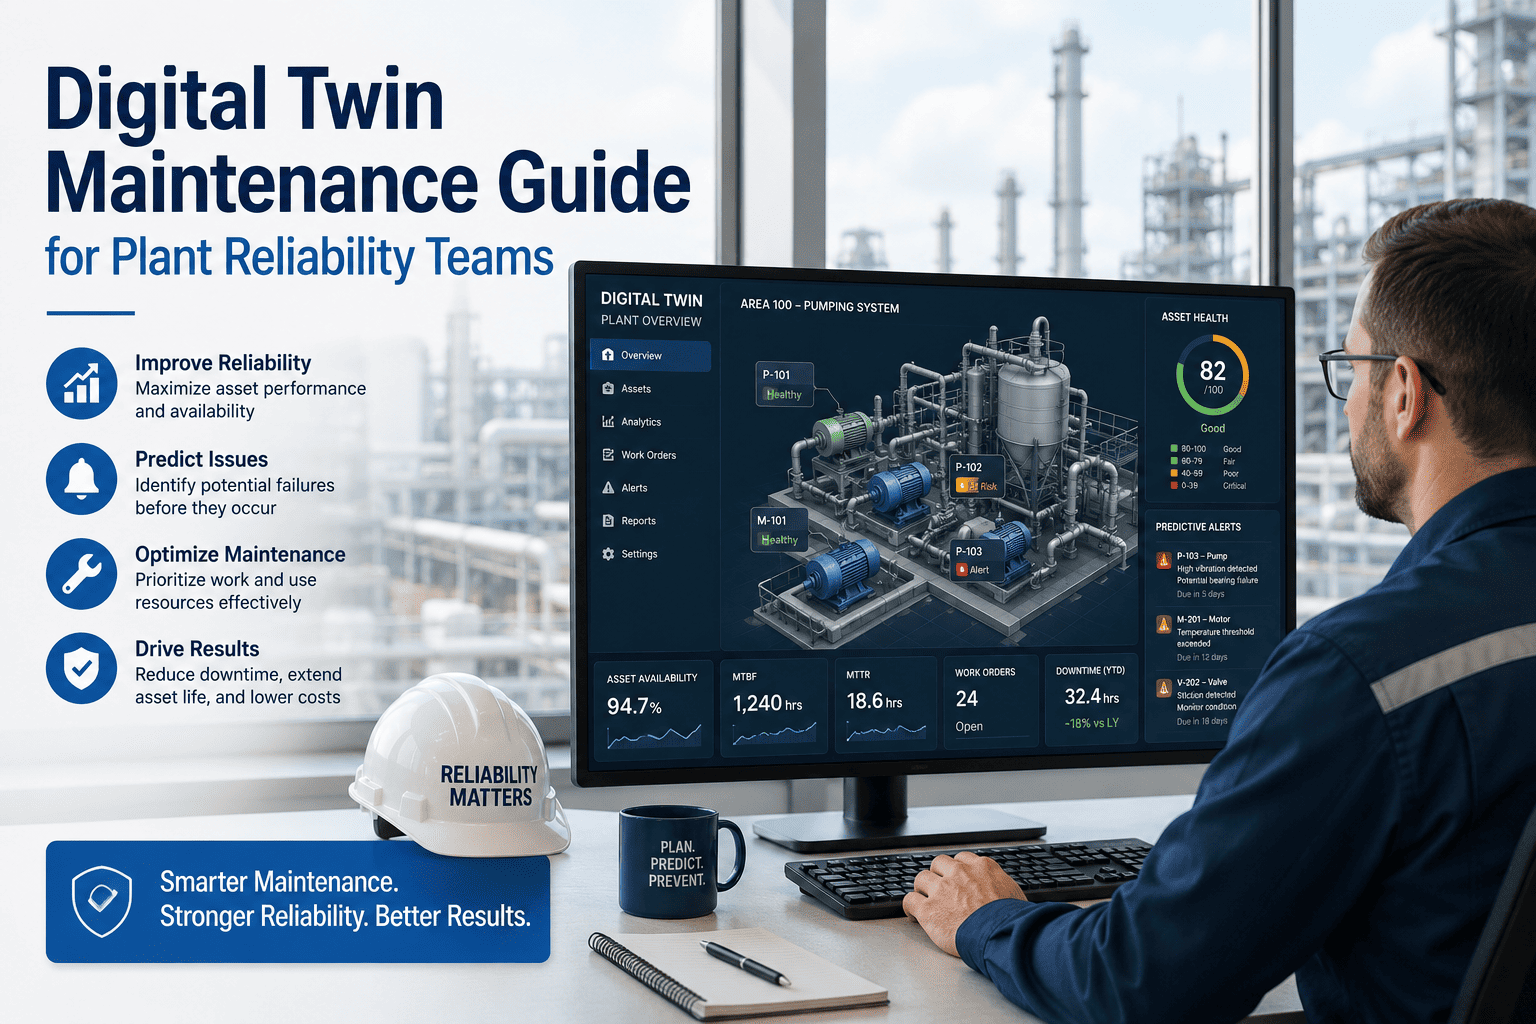
Digital Twin Technology for Aging Infrastructure
Digital twin models create virtual replicas of physical assets, enabling maintenance teams to simulate failure scenarios, test intervention strategies, and forecast remaining useful life without touching production equipment. Facilities using digital twins for aging infrastructure management extend equipment lifespan by up to 25% while reducing unplanned replacement costs.
Your Competitors Are Already Deploying These Systems
The gap between facilities using AI-driven maintenance analytics and those still operating on paper-based PM logs is widening faster in 2026 than any previous year. ArcelorMittal, Tata Steel, and major CPG manufacturers have moved from pilot programs to full-plant deployment. Oxmaint gives mid-market and enterprise facilities the same analytics capabilities — without the enterprise price tag or multi-year implementation timeline. Teams using Oxmaint's analytics dashboard report measurable improvements within the first 30 days.
2026 Trend Adoption Rates by Industry Sector
Adoption velocity and achievable cost reduction potential vary significantly by sector. Facilities that align their maintenance investments to their sector's primary cost driver see the fastest payback.
| Industry Sector | Primary Cost Driver | Top 2026 Trend | AI Adoption Rate | Cost Reduction Potential |
|---|---|---|---|---|
| Automotive | Line downtime ($22K/min) | AI Failure Prediction | Leading | 25–35% |
| Steel & Metals | Furnace energy & unplanned stops | Digital Twins + IIoT | High | 25–40% |
| Food & Beverage | Compliance & energy costs | Analytics Dashboards | Growing | 20–30% |
| Pharmaceuticals | Regulatory overhead | Automated Compliance Reporting | Growing | 15–25% |
| Plastics & Packaging | Material scrap and waste | AI-Optimized PM Intervals | Growing | 20–35% |
| Energy & Utilities | Grid reliability & compliance | Autonomous Inspection | High | 20–32% |
| Electronics | Precision equipment costs | Condition Monitoring + Calibration | Early | 18–28% |
| Adoption rates reflect 2026 deployment data from Deloitte, McKinsey, and Oxmaint customer deployments. Cost reduction ranges from documented outcomes across multiple facilities. | ||||
How to Apply These Trends Without a Multi-Year Transformation Project
The facilities capturing the most value from 2026 maintenance trends are not running massive digital transformation programs. They are making targeted, sequenced investments that compound.
Start with Your Analytics Foundation
No AI trend delivers value without a clean data foundation. The first step is digitizing work orders, asset records, and PM schedules into a CMMS that captures actual maintenance history — not just scheduled activity. Most facilities that have been reactive for years discover $50,000–$100,000 in identifiable waste within the first 30 days of structured data capture alone. Sign up for Oxmaint free to begin building your data foundation immediately with no implementation delay.
Deploy Sensors on Your 10–15 Highest-Value Assets
You do not need to instrument every pump and motor to capture the majority of predictive maintenance value. Vibration sensors on motors, compressors, and fans — the assets with the highest failure cost and highest failure frequency — cover roughly 70% of your unplanned downtime exposure. Industrial wireless sensors are now cost-effective enough that the first tier of deployment typically pays back within 60–90 days through a single avoided emergency repair. Oxmaint integrates with all major IIoT sensor protocols and begins surfacing anomaly alerts within weeks of deployment.
Activate Your Analytics Dashboard to Replace Weekly Report Reviews
Maintenance leaders who review last week's data on Friday cannot act on trends that escalated Tuesday. Oxmaint's real-time analytics dashboard surfaces MTBF trends, open work order aging, technician utilization, and asset health scores in a single view — updated continuously. The shift from weekly report review to live dashboard management is one of the fastest productivity gains available in 2026 maintenance operations, requiring no additional sensors or hardware.
Let AI Optimize Your PM Interval Schedule
Once you have 60–90 days of work order history in your CMMS, Oxmaint's AI can analyze actual asset usage patterns, failure frequencies, and condition data to recommend optimized PM intervals per asset. Facilities that move from fixed-calendar PM to AI-optimized intervals consistently reduce unnecessary PM labor by 25–30% — freeing technician time for higher-value condition monitoring and corrective work. Book a demo to see how interval optimization is configured in your environment.
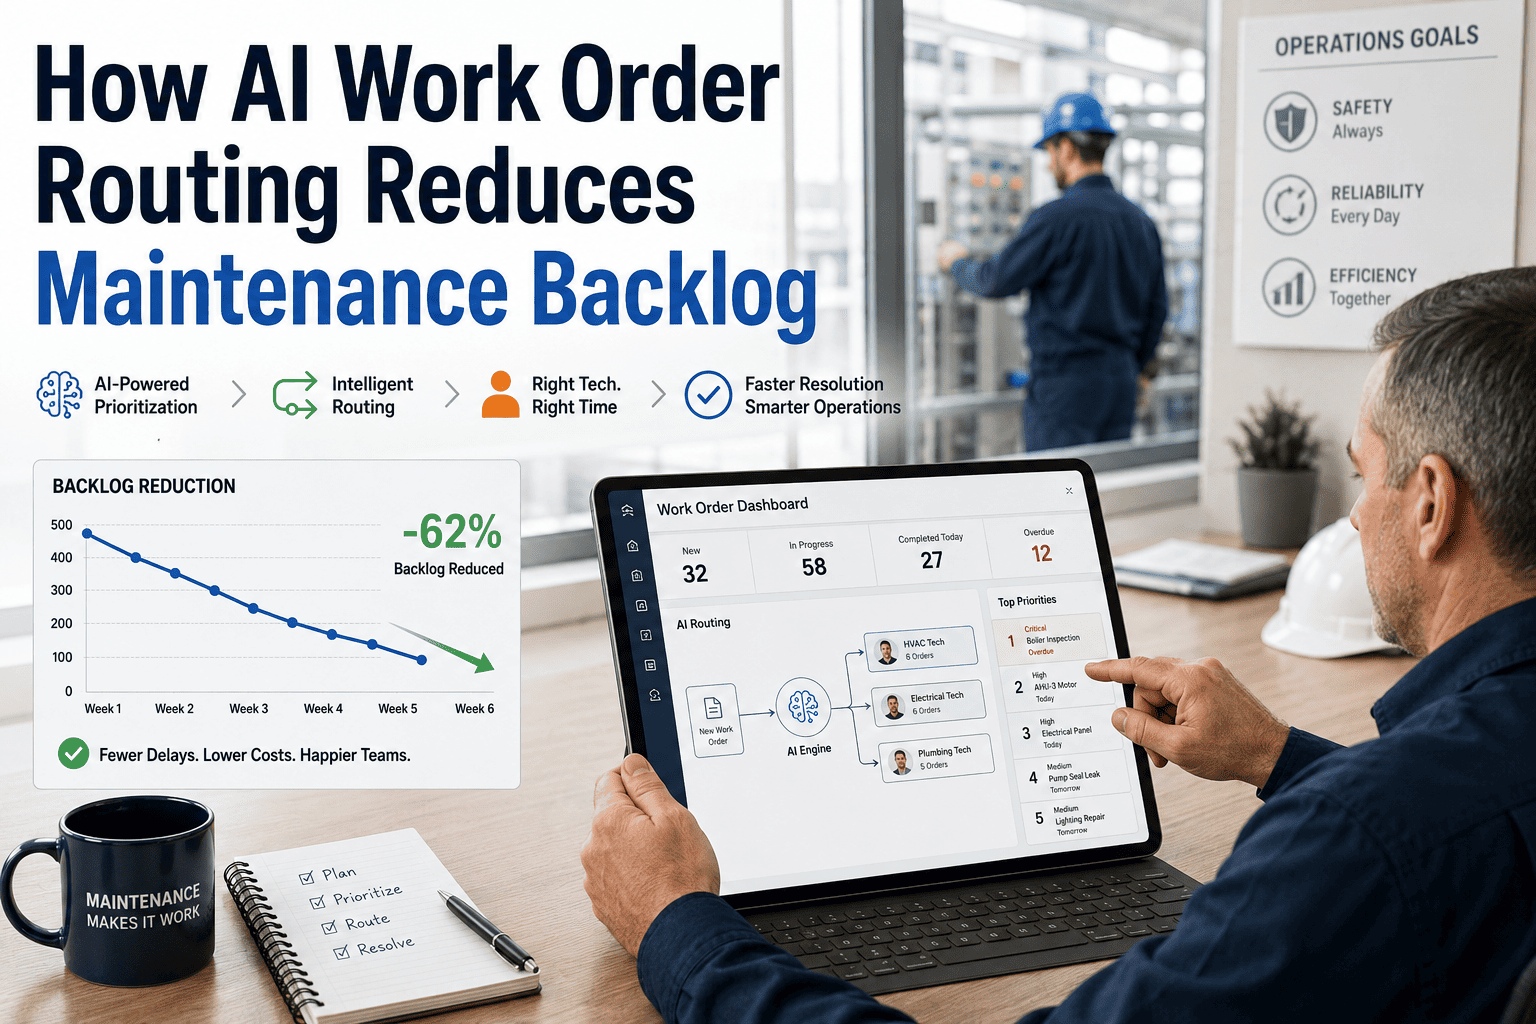
Build Cross-Site Benchmarking into Your Reporting
For multi-site operations, the 2026 trend that creates the most competitive separation is plant-to-plant performance benchmarking. Oxmaint's analytics dashboard consolidates maintenance KPIs — downtime rates, MTTR, PM compliance, cost per asset — across all sites into a unified view. This surfaces which facilities are outperforming and which processes drive that advantage, allowing rapid knowledge transfer across your entire operation rather than siloed local improvement.
How Oxmaint Addresses Every 2026 Maintenance Trend
Oxmaint's analytics dashboard is built around the trends that are driving maintenance performance in 2026 — not last decade's feature set. Here is the capability map.
The biggest myth in manufacturing is that you need massive capital investment to cut costs significantly. Most of your waste is invisible — hidden in reactive maintenance, excess inventory, and manual processes. A good analytics platform makes it visible, and once you can see it, you can eliminate it.
Frequently Asked Questions
Position Your Maintenance Program for 2026 and Beyond
Every week without real-time analytics is another week of preventable downtime, over-serviced assets, and missed early warnings. Oxmaint gives your team the AI-powered dashboard, predictive alerts, and PM optimization tools to capture every trend advantage available in 2026 — starting today.