A modern cement plant produces between 3,000 and 10,000 tons of clinker per day, generates $300,000 to $1.5 million in daily revenue, and loses $18,000 to $45,000 for every hour the kiln stops unexpectedly — with catastrophic ID fan or main bearing failures pushing that figure as high as $100,000 per hour. The mathematics that maintenance leaders are now asked to defend in front of CFOs are unambiguous: 73% of critical cement equipment failures show measurable sensor anomalies 4 to 8 weeks before catastrophic breakdown, and the average plant that invests in a structured IoT sensor + CMMS architecture sees an 8:1 to 12:1 ROI over the first 18 months of operation. The question is no longer whether to instrument the kiln, the raw mill, and the main fans — it is which sensors to deploy first, what they cost to integrate, what their measured payback looks like month by month, and how the work-order automation in your CMMS converts a vibration spike into a planned outage rather than a 5-day emergency. Oxmaint's IoT/Sensor Integration platform connects vibration, temperature, motor current, oil analysis, and shell-scanner data streams to automated work orders against kiln, mill, crusher, and conveyor assets — closing the gap between what your equipment is signalling and what your maintenance team can actually do about it. This ROI guide quantifies the investment, the return, the payback curve, and the per-asset economics for cement-plant maintenance leaders who need to make the financial case to capex committees — including how a properly-architected cement plant CMMS with IoT integration architecture turns sensor noise into balance-sheet impact.
ROI Guide · IoT / Sensor Integration · Cement Plant Maintenance Leaders
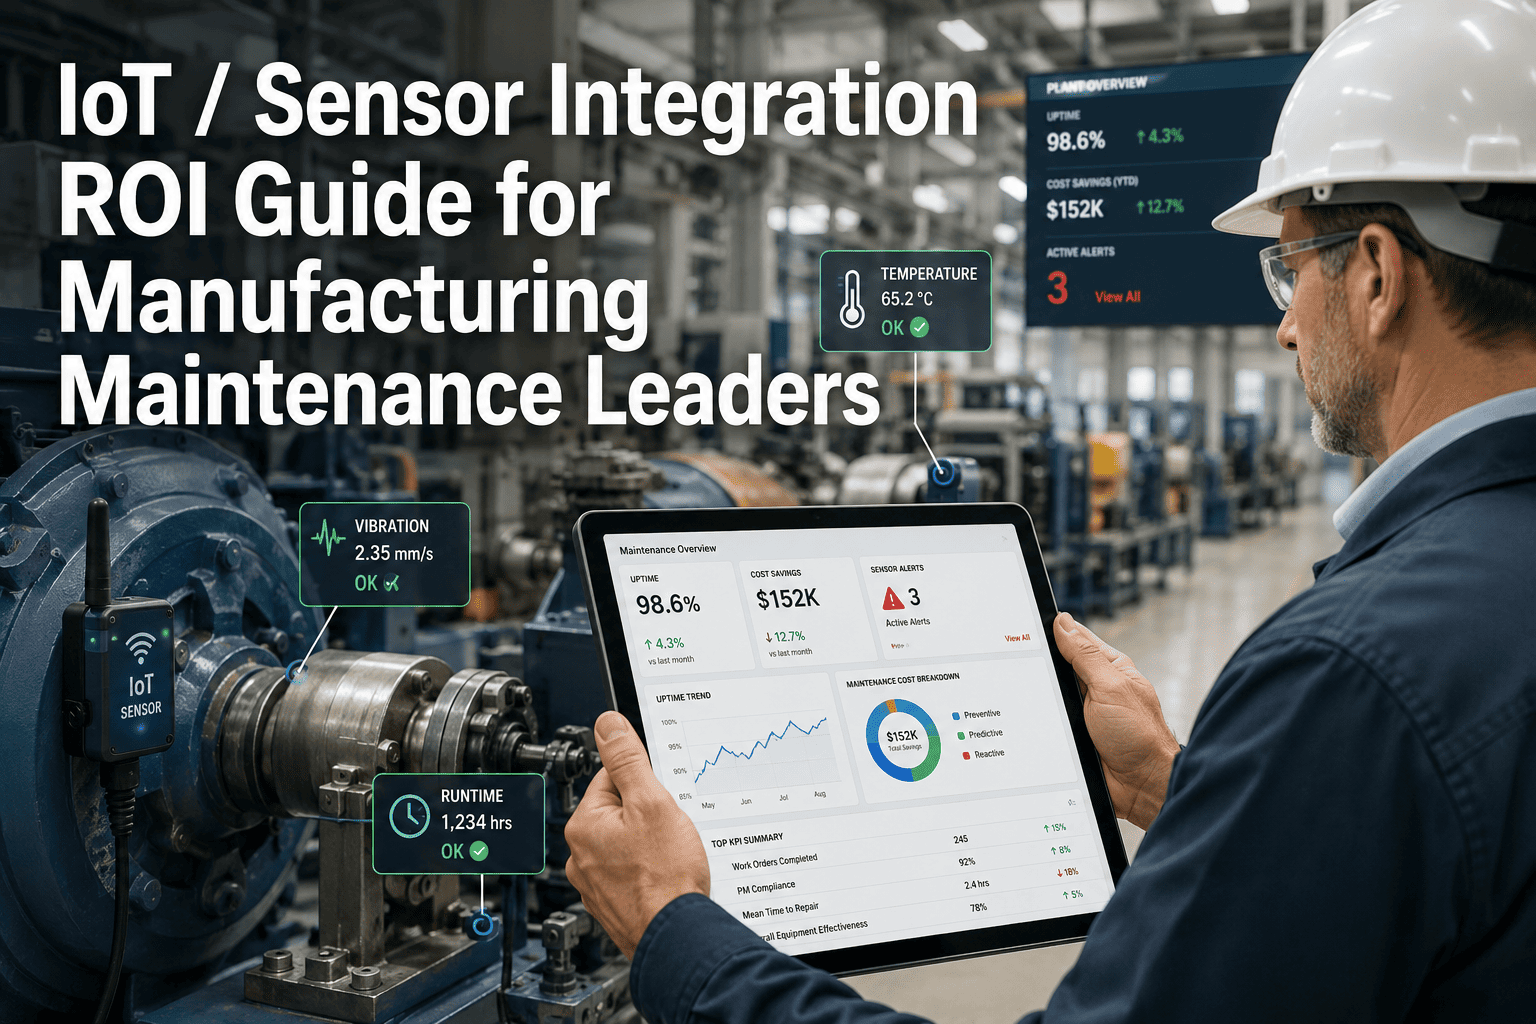
IoT / Sensor Integration ROI Guide for Cement Plants Maintenance Leaders
The full financial picture — investment cost, return composition, payback curve, and asset-by-asset economics — for cement plant maintenance leaders building the capex case for sensor + CMMS integration.
Investment
$180K – $420K
Year-1 outlay · 2-kiln plant
Vibration sensors (40-80 points)$45K – $110K
Temperature + shell scanner$60K – $140K
IoT gateway + edge compute$25K – $60K
CMMS + integration services$50K – $110K
Return (Year 1)
$1.4M – $3.6M
8:1 to 12:1 first-cycle multiple
Avoided unplanned kiln stops (2-4 events)$650K – $1.8M
Emergency spare parts reduction$180K – $420K
Secondary damage avoidance (-78%)$280K – $640K
Overtime + emergency labor (-70%)$140K – $320K
Capital deferral · extended life$150K – $420K
$18K–$45K
Cost per hour of unplanned kiln stop · catastrophic events reach $100K/hr
73%
Of critical cement failures show measurable signals 4-8 weeks before breakdown
5–7 mo
Median payback period for sensor + CMMS deployment at typical 2-kiln plant
40/60 → 88/12
Planned-to-unplanned maintenance ratio shift achievable at 18-month maturity
The Production-Loss Equation: Where the Money Actually Goes
Before any maintenance leader presents an IoT business case to a capex committee, they need the production-loss arithmetic on a single page. The calculator below traces the cost of one unplanned kiln stop through the four cost layers a CFO will challenge — and shows why a single prevented event typically covers the full Year-1 sensor investment.
Single Unplanned Kiln Stop · 5,000 t/day Plant · Avg. 18-hour Stop
L1
Lost Clinker Production
5,000 t/day
÷
24 hr
×
18 hr stop
×
$48/t margin
=
$180,000
L2
Emergency Repair & Spare Parts
Bearing + shaft replacement
+
Air freight premium
+
Contractor mobilization
=
$145,000
L3
Secondary Damage · Thermal Cycling
Refractory damage
+
Shell deformation risk
+
Downstream conveyor stress
=
$95,000
L4
Overtime & Schedule Disruption
Weekend OT (24 techs × 18 hr)
+
Deferred planned PM cost
=
$58,000
Total cost · One unplanned kiln stop event
$478,000
Sensor-to-Asset Coverage Matrix: Which Sensors Protect Which Equipment
Not every sensor type belongs on every asset. The matrix below maps the six dominant industrial sensor classes against the seven highest-impact cement plant asset categories. Darker cells indicate the sensor is high-priority for that asset class. Plants typically deploy in Tier 1 cells first, expand to Tier 2 in Year 2, and reach full coverage by Year 3.
Sensor ▼ · Asset ►
Rotary Kiln
Ball Mill
VRM
Crusher
ID / Main Fan
Conveyor
Bucket Elevator
Vibration
High
High
High
High
High
Med
Med
Temperature (RTD/IR)
High
High
High
Med
High
Med
Low
Motor Current (MCSA)
High
High
High
High
High
High
High
Oil Analysis
High
High
High
Med
Med
N/A
N/A
Shell Scanner (IR)
High
N/A
N/A
N/A
N/A
N/A
N/A
Ultrasonic / Acoustic
Med
Med
Med
Low
High
Med
Low
High · Tier-1 deployment
Med · Tier-2 expansion
Low / Not applicable
From sensor signal to scheduled outage
Every Sensor Spike Becomes an Oxmaint Work Order — Not Just a Dashboard Alert
Oxmaint connects to your existing sensor network via OPC-UA, MODBUS TCP, and REST API — no rip-and-replace of Bently Nevada, Pruftechnik, ABB, Siemens, or Schneider infrastructure. When a vibration anomaly crosses threshold, the system auto-generates a work order with the recommended repair, parts list, and outage scheduling window.
Three-Tier Sensor Investment Roadmap
Cement plants rarely instrument every asset in Year 1 — and they should not. The roadmap below is how Oxmaint customers typically phase deployment to front-load ROI: Tier 1 captures 60-70% of the financial return on roughly 35% of the total program cost. Each tier compounds on the last, and pairs naturally with a cement plant kiln asset tracking software framework that links each instrumented asset back to its work-order history.
Tier 1
Year 1 · 35% of program cost · 60-70% of Year-1 ROI
Critical Production Path
Kiln drive gearbox + thrust roller — vibration + temperature + oil analysis
Kiln shell scanner — full 360° IR with hot-spot AI classification
Main raw mill + cement mill bearings — vibration + motor current
ID fan + cooler fan bearings — vibration + acoustic
Typical budget: $90K – $200K
Tier 2
Year 2 · 40% of program cost · 22-28% of cumulative ROI
Secondary Process Equipment
Crushers (primary + secondary) — vibration + motor current
Bucket elevators + conveyor drive units — vibration + temperature
Pre-heater fan + coal mill — vibration + ultrasonic
VRM hydraulic cylinders — pressure + flow + temperature
Typical budget: $80K – $170K
Tier 3
Year 3 · 25% of program cost · 10-15% of cumulative ROI
Auxiliary & Reliability Optimization
Bag house / ESP fans — vibration + amp draw
Compressed air system — flow + pressure + leak detection
Cooling water pumps — vibration + flow
Material handling diversions + dampers — position + actuator current
Typical budget: $50K – $120K
The Payback Curve: Month-by-Month ROI Accumulation
A capex committee will not approve "trust me, it pays back" — they want the cumulative cash position by month. The chart below is what a typical Tier-1 deployment looks like on a monthly basis: investment outflow in months 1-3, sensor commissioning gradient through month 5, first avoided event typically falling between months 4-7, and the breakeven crossover at month 6 on a 2-kiln plant.
M1-M3 · Capex outflow phase. Sensor procurement, installation, commissioning.
M4-M5 · AI baseline learning phase. Early warnings start firing.
M6 · First prevented event. Typical breakeven crossover on Tier-1 deployment.
M12-M18 · Compounding returns. Spare parts savings + reduced overtime layer on.
Anomaly-to-Action: How a Sensor Signal Becomes a Closed Work Order
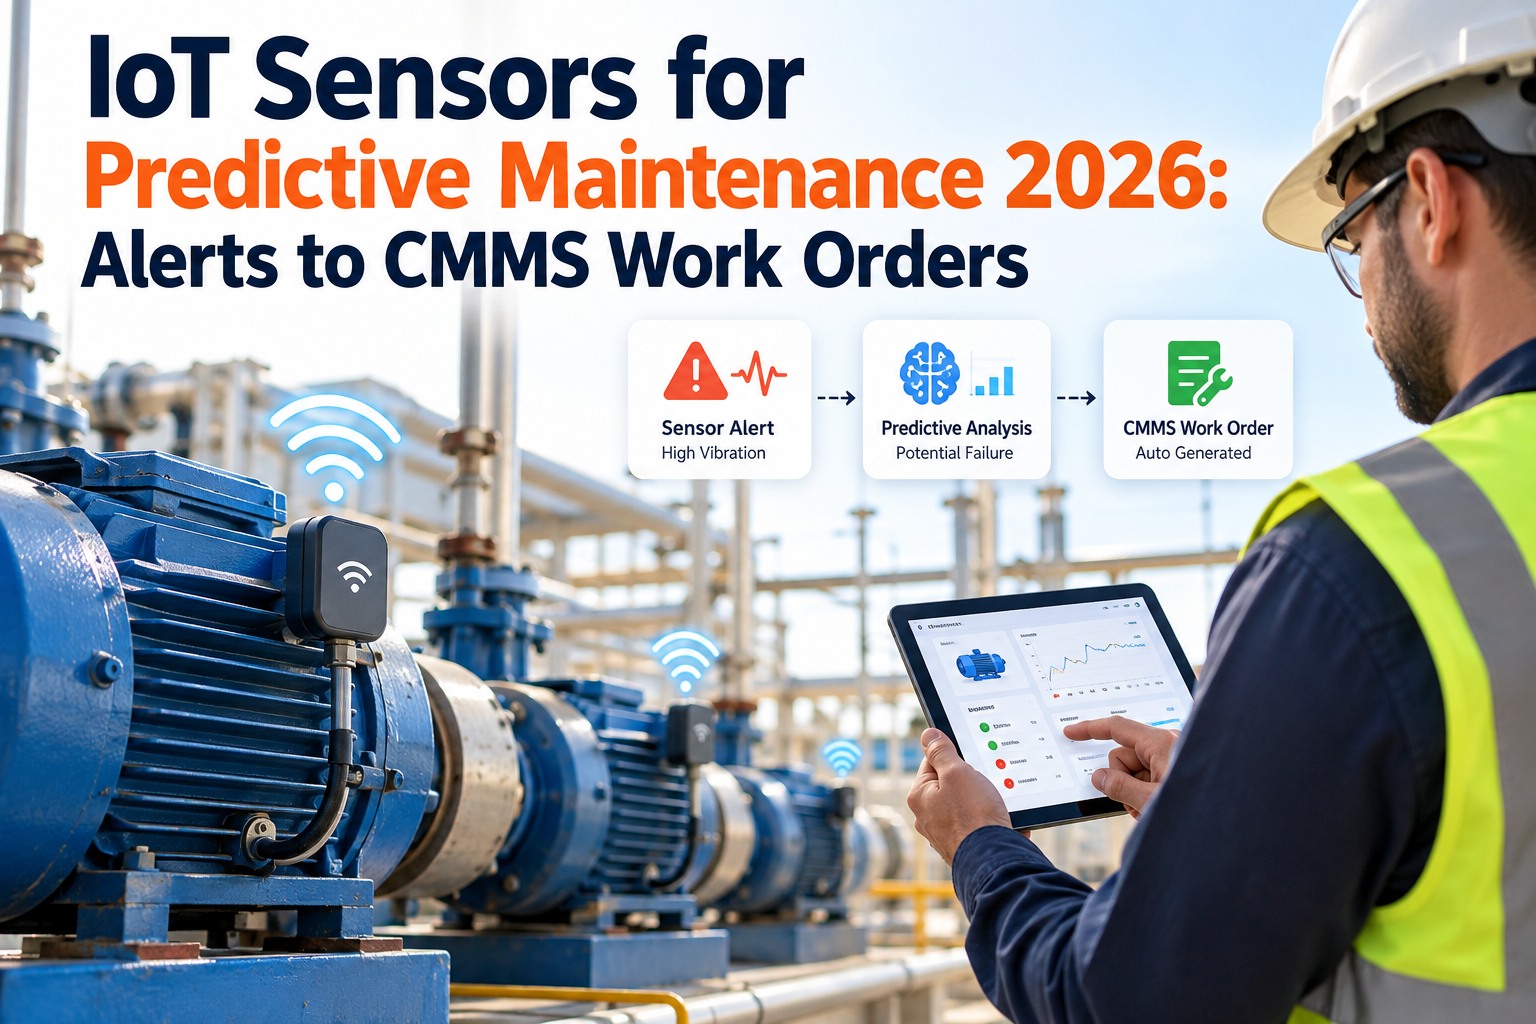
An ROI guide is incomplete without the operational mechanism that converts sensor data into financial outcome. The pipeline below shows what happens between a vibration spike on the kiln drive gearbox and the closed work order that protected the plant from a 5-day outage — and is the architecture cement plant vibration monitoring with work order automation systems are built around.
01
Sensor Detects
Vibration sensor on kiln drive gearbox · Bently Nevada 3500 · Anomaly: gear mesh harmonic +4.2 dB above 90-day baseline
02
Edge Analyzes
IoT gateway aggregates 14 days of trend data · AI model classifies as Stage-2 tooth wear · RUL estimate: 38-52 days
03
Oxmaint Receives
OPC-UA payload includes asset ID, anomaly type, confidence, RUL · Routed to kiln asset record with prior PM history
04
WO Auto-Created
WO-2026-7129 · Priority P2 · Pre-populated procedure · Parts list with stock check · Recommended outage window flagged
05
Outage Scheduled
Planner aligns to existing 14-day maintenance window · Production planning notified · Parts ordered at standard freight
06
Closed + Recorded
Gearbox replaced in planned 11-hour window · Cost: $42K vs $478K emergency · Avoided event logged to ROI dashboard
KPIs Maintenance Leaders Should Track Quarterly
Target: above 88%
Planned vs Unplanned Ratio
Ratio of planned maintenance hours to total maintenance hours. Industry baseline is 40/60. Mature sensor + CMMS programs reach 88/12 by month 18. This is the single best indicator of reliability program health.
Target: above 90%
Sensor Health Coverage
Percentage of Tier-1 assets with at least one online sensor reporting within the last 24 hours. Sensors that are physically installed but offline (dead battery, broken cable, gateway outage) provide no protection.
Target: 4-8 weeks
Mean Advance Warning
Average lead time between first AI-generated anomaly alert and the planned intervention window. Less than 2 weeks means parts cannot be procured at standard freight — eroding a key ROI component.
Target: above 85%
Anomaly-to-WO Conversion
Percentage of validated AI anomaly alerts that became tracked work orders. Below 50% indicates either threshold miscalibration generating false positives, or supervisors ignoring alerts — both kill ROI.
Target: 60-70% reduction
Emergency Spare Parts Spend
Annual spend on emergency-freight, expedited, and air-shipped spare parts as percentage of total parts budget. Advance warning enables standard procurement, which typically delivers a 62% reduction by Year 2.
Target: under 12 mo
Verified Payback Period
Months from program go-live to cumulative-positive cash position, audited against prevented-event documentation. The CFO-facing number that determines whether Tier 2 and Tier 3 expansion is approved.
Expert Review
"
The single mistake I see cement plants make when building the IoT business case is treating it as a technology purchase rather than as a production-economics intervention. The CFO is not buying sensors — they are buying avoided kiln stops, and the ROI argument has to be framed in their currency, not ours. After 19 years across European and Middle Eastern cement plants, I can say with confidence that the plants that get the financial case right deploy in three tiers, not all at once. Tier 1 captures 60 to 70 percent of the financial return on roughly a third of the total program cost, and that is the only data point that matters for the capex committee. Once Tier 1 is paying back at month six or seven, Tier 2 and Tier 3 get approved without a fight. The platform decision matters less than the architecture decision — but a CMMS that auto-creates work orders from sensor anomalies, links them to asset history, and feeds the ROI dashboard the controllers will actually trust is the only operational backbone I would deploy today. Oxmaint's sensor integration architecture is one of the few I have seen that connects the field signal to the financial outcome without three layers of manual reconciliation in between.
Dr. Ingrid Brennecke, CMRP, CRL
Reliability Engineering Director · 19 years cement plant maintenance leadership across Europe & MENA · Certified Maintenance & Reliability Professional · Certified Reliability Leader · Specialism in IoT capex-case development for heavy industrial operators
Frequently Asked Questions
Q1
What is the realistic Year-1 ROI multiple for IoT sensor + CMMS integration at a typical 2-kiln cement plant?
Aggregated data across cement plant deployments shows
first-cycle ROI between 8:1 and 12:1 on Year-1 investment. A typical 2-kiln plant invests $180K-$420K and recovers $1.4M-$3.6M in the first 12 months — composed of avoided unplanned kiln stops (45-65% of return), emergency parts savings (12-18%), overtime reduction (8-12%), secondary damage avoidance (15-20%), and capital deferral (8-12%). Plants with higher historical reactive event counts see faster payback because the avoided-event value compounds quickly.
Book a demo to run the ROI calculator against your plant's historical event data.
Q2
Does Oxmaint require us to replace existing Bently Nevada, Pruftechnik, ABB, or Siemens infrastructure?
No. Oxmaint's architecture is explicitly designed for non-disruptive integration with existing plant control infrastructure. The platform connects to ABB, Siemens, Rockwell, and Schneider DCS systems via OPC-UA, MODBUS TCP, and REST API bridges, and reads vibration data from Bently Nevada, Pruftechnik, SPM, and similar systems through documented connector libraries. Kiln shell scanners from ThyssenKrupp Polysius, FLSmidth, and KIMA integrate via their native APIs. The point of integration is the existing sensor data — the new investment is in the work-order automation, asset linkage, and ROI tracking layer that current SCADA/DCS systems do not provide.
Q3
How quickly does the AI model become reliable enough to act on its anomaly alerts?
The platform begins generating useful anomaly alerts within
3-5 weeks of sensor commissioning, but reaches full prediction reliability between months 4-6 as the model learns the asset's normal operating envelope across load variations, ambient conditions, and seasonal effects. Prediction accuracy for kiln drive and mill bearing failures typically reaches
89-94% after 18 months of model maturation. During the early learning period, alerts route to a maintenance reliability engineer for validation before becoming auto-WOs — once accuracy crosses your configured threshold (usually 80%), the system progresses to auto-WO generation.
See the model maturation curve in detail in the architecture reference.
Q4
What happens when a sensor itself fails — does the system know its own blind spots?
Yes. Oxmaint runs a sensor health layer separate from asset health. Each sensor is treated as an asset in its own right with its own PM schedule, calibration record, and online-status monitoring. A sensor that stops reporting for more than 4 hours auto-generates a Tier-2 work order against the sensor itself, and the parent asset's reliability score is flagged as degraded until the sensor is restored. This prevents the silent-failure scenario where a plant believes a critical asset is being monitored when in fact the sensor went offline 17 days ago.
Q5
How do we structure the capex paper to get the IoT + CMMS investment approved?
The most successful capex submissions follow a three-element structure: (1)
Historical event ledger — list every unplanned event in the prior 24 months with date, duration, root cause, and direct cost. (2)
Tier-1 ROI scenario — model preventing 2 of the historical events at the median direct cost, sized against Tier-1 program cost only (not the full multi-year vision). (3)
Payback gate structure — propose Tier 2 and Tier 3 conditional on Tier 1 reaching documented breakeven by month 7. This structure is what controllers can sign because it limits initial exposure and gates further spend on verified results.
Start an Oxmaint free trial to import your historical event ledger and generate the Tier-1 scenario directly.
From Sensor Data to Balance-Sheet Impact
Build the IoT Business Case Your Capex Committee Will Sign
Oxmaint connects your existing sensor network to automated work orders, links every prevented event to a quantified avoided cost, and surfaces the ROI dashboard your plant controller will actually trust. Tier-1 deployment in 60-90 days. First prevented event typically funds the program inside the first year.