Maintenance budgets don't disappear in large, obvious chunks — they drain slowly through a dozen small leakages that never appear as single line items on any report. OxMaint's cost analytics module makes these leakages visible: overtime patterns, emergency purchase spikes, repeat failure costs, and parts that sit unused for 18 months — all quantified and traceable back to specific decisions that can be changed.
Maintenance Cost Leakage: Where Budgets Quietly Disappear
If your maintenance budget keeps running over and no one can explain where the money went, you have cost leakage. Every leak has a source — and a fix. This guide shows you both.
Book a Demo Start FreeThe 5 Biggest Cost Leakage Sources
Each leakage source below represents money that's leaving your maintenance budget without producing proportional value. The good news: all five are preventable with CMMS data.
Cost Leakage Diagnostic: What to Measure
Run these five metrics in your CMMS monthly. Any metric outside the target range points directly at a specific leakage source.
| Metric | Healthy Range | Warning Signal | Leakage Type |
|---|---|---|---|
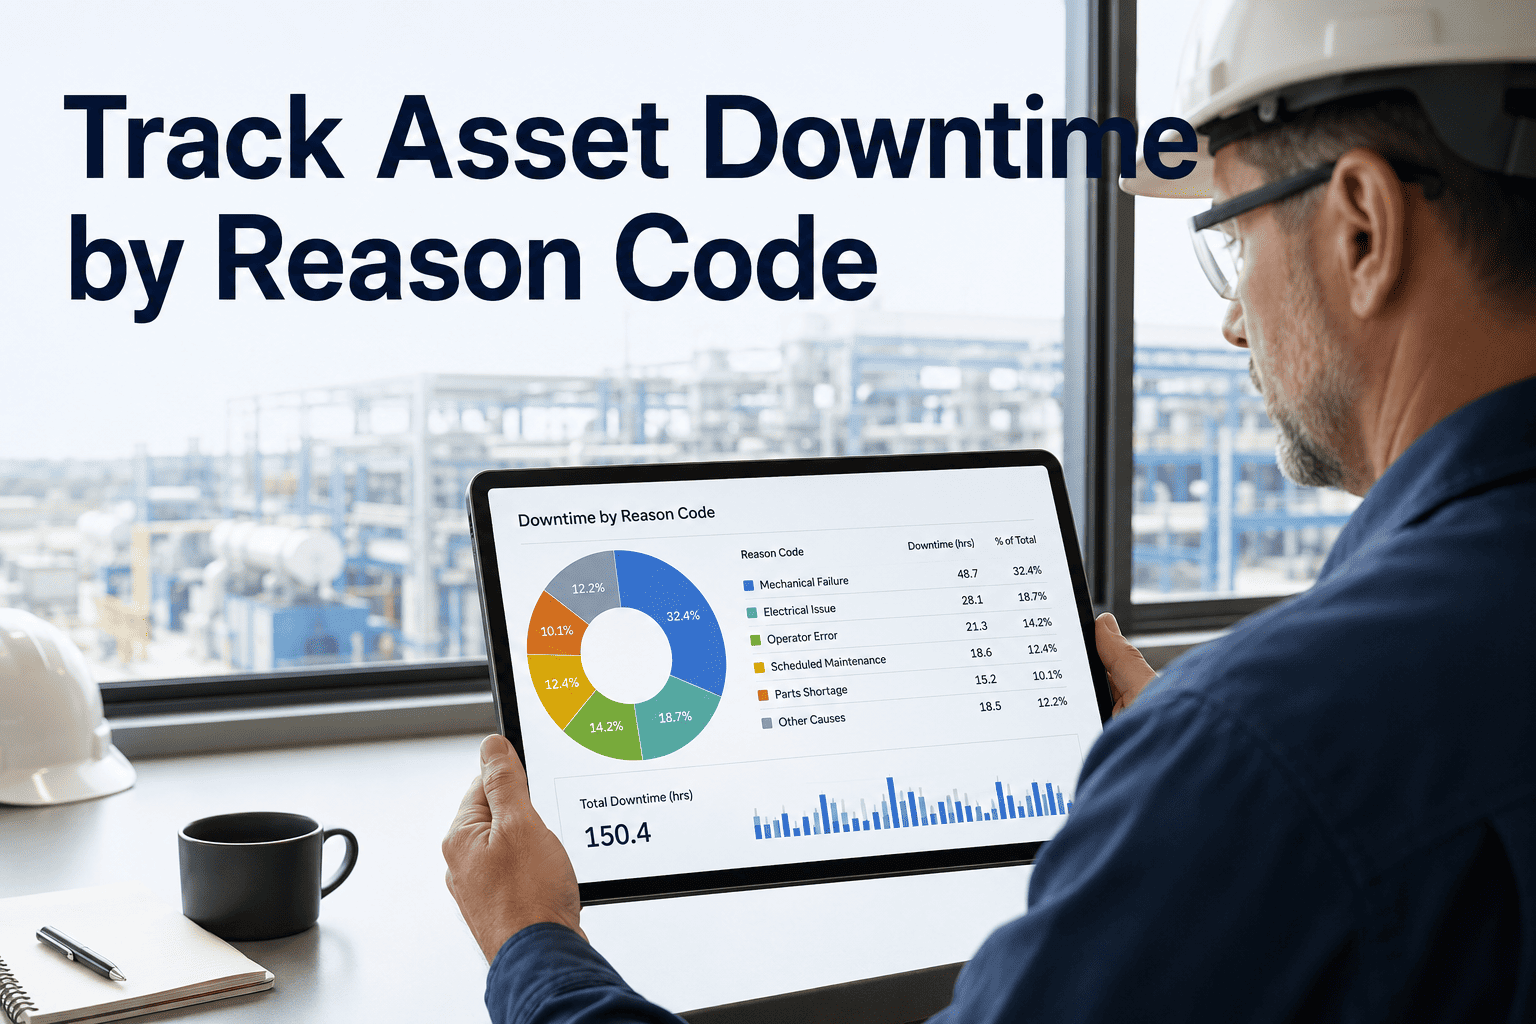
| Emergency vs Planned Work Ratio | < 20% | > 35% | Overtime + Emergency purchases |
| Repeat Failure Rate (same asset, 90 days) | < 5% | > 15% | Repeat repair cost |
| Emergency PO Spend as % of Parts Budget | < 8% | > 20% | Premium purchasing |
| Zero-movement Inventory (12 months) | < 10% | > 25% | Stale capital |
| PM Compliance Rate | > 90% | < 75% | Reactive cost escalation |
See Exactly Where Your Budget Is Going — Before It Disappears.
OxMaint tracks labor costs, parts spend, emergency purchase premiums, and repeat failure rates per asset — automatically, from your work order data. No manual spreadsheets. Just clear numbers that show where to act first.
"The single most common thing I find when auditing maintenance budgets is that the biggest cost driver is never what the maintenance manager thinks it is. They'll say 'labor costs are high' — and when we run the data, it turns out 60% of the overtime is coming from three specific assets that nobody's flagged as problematic. The money is always there in the data. What's missing is the reporting structure that makes it visible. Once teams can see the actual cost by asset, by failure type, and by purchase urgency, budget conversations completely change. You stop arguing about total spend and start talking about specific fixes."
— Maintenance Cost Optimization Consultant, former VP of Maintenance at a Fortune 500 manufacturer