Industrial maintenance is typically the second or third largest operating cost in a plant — and in most facilities, 30–40% of that spend is wasted on unnecessary work, emergency repairs that could have been prevented, and parts replaced on schedule rather than condition. AI-driven maintenance analytics change the calculation: instead of spending on maintenance time, you spend on maintenance insight. Start optimising your maintenance costs with Oxmaint's cost analytics today.
Maintenance Cost Optimization Using AI
A practical guide to cutting industrial maintenance costs using predictive analytics, AI-driven failure forecasting, and CMMS cost tracking — with real strategies for reducing reactive maintenance spend, optimising PM intervals, and building the data infrastructure for sustainable cost reduction.
Where Maintenance Budget Goes Without AI Cost Visibility
Most maintenance managers know their total maintenance budget. Very few know where that budget actually goes at asset, failure mode, or work order level. Without cost analytics, maintenance spend decisions are based on intuition and precedent — not data. The result is four predictable cost leak patterns that compound year after year.
Emergency Repair Premium
Emergency repairs cost 3–5x more than planned maintenance for the same work scope — expedited parts, overtime labour, crane hire, and production loss all stack on top of the base repair cost. Every failure that could have been predicted and planned is effectively billed at a 300–500% surcharge.
Over-Maintained Equipment
Calendar-based PM wastes labour and parts on equipment that does not need servicing yet. A compressor serviced every 2,000 hours because the OEM manual says so — regardless of actual running conditions, load profile, or measured vibration — is consuming maintenance budget that condition-based analytics would redirect to higher-risk assets.
Invisible Parts Consumption
Without parts consumption tracking linked to work orders and asset records, inventory is replenished based on habit rather than actual demand patterns. Excess stock ties up capital; insufficient stock causes repair delays. AI-driven demand forecasting based on work order history reduces both overstock and stockout events.
Repeat Failure Cost
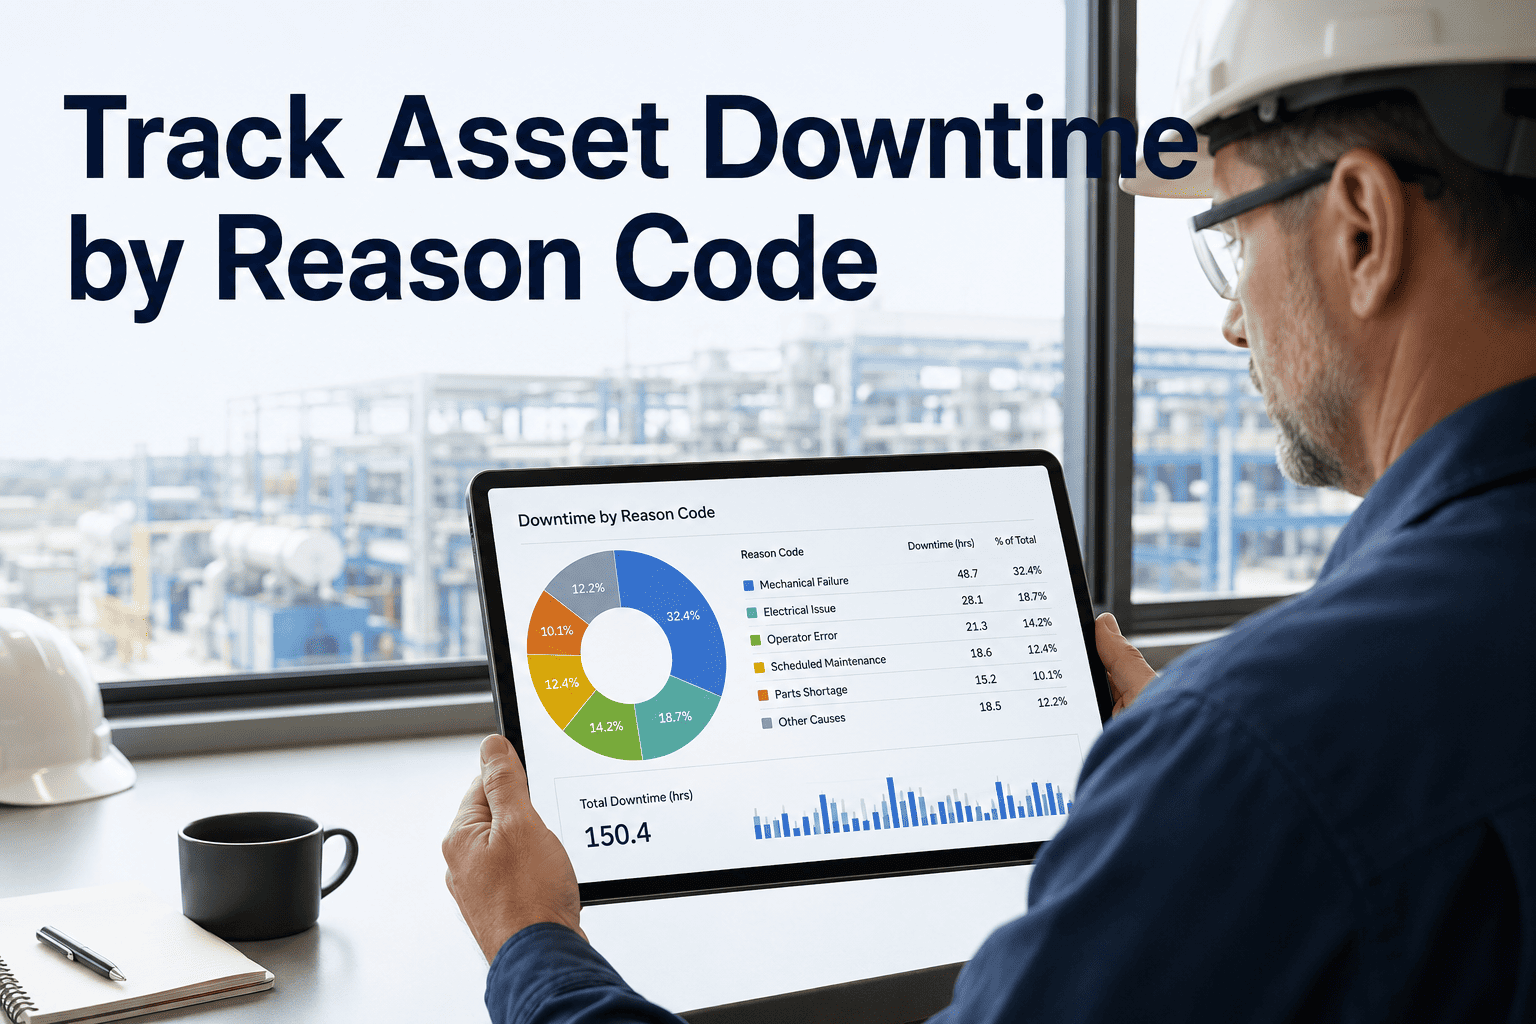
Assets that fail repeatedly on the same failure mode are the highest-cost items in any maintenance budget — but they are invisible without failure mode analytics. A pump replaced three times in two years for the same bearing failure is not a maintenance problem: it is an operating condition problem that root cause analysis from CMMS data would identify and eliminate.
How AI Reduces Maintenance Cost — the Actual Mechanisms
AI in maintenance is not a single technology — it is a set of analytical capabilities that each target a different cost driver. Understanding which mechanism addresses which cost leak is essential for setting realistic expectations and measuring the right outcomes. Oxmaint's cost analytics module makes each of these mechanisms operational without requiring a data science team.
Predictive Failure Forecasting
AI models trained on sensor data, maintenance history, and operational parameters identify assets trending toward failure days or weeks ahead. This converts emergency repairs (high cost) into planned replacements (low cost) — the single highest-return AI maintenance application.
Condition-Based PM Scheduling
AI replaces fixed-interval PM with condition-based triggers — each asset is serviced when its condition warrants it, not when the calendar says. Low-utilisation or low-stress assets are serviced less frequently; high-load or high-wear assets more frequently. The result is labour and parts spend directed to where it has the highest impact.
AI-Driven Inventory Optimisation
By analysing work order history and failure patterns, AI forecasts parts demand at the asset and failure mode level — replacing intuition-based reorder decisions with data-driven minimum stock levels. Reduces overstock capital tied up in slow-moving parts and eliminates stockout delays that extend repair time.
Repeat Failure Elimination
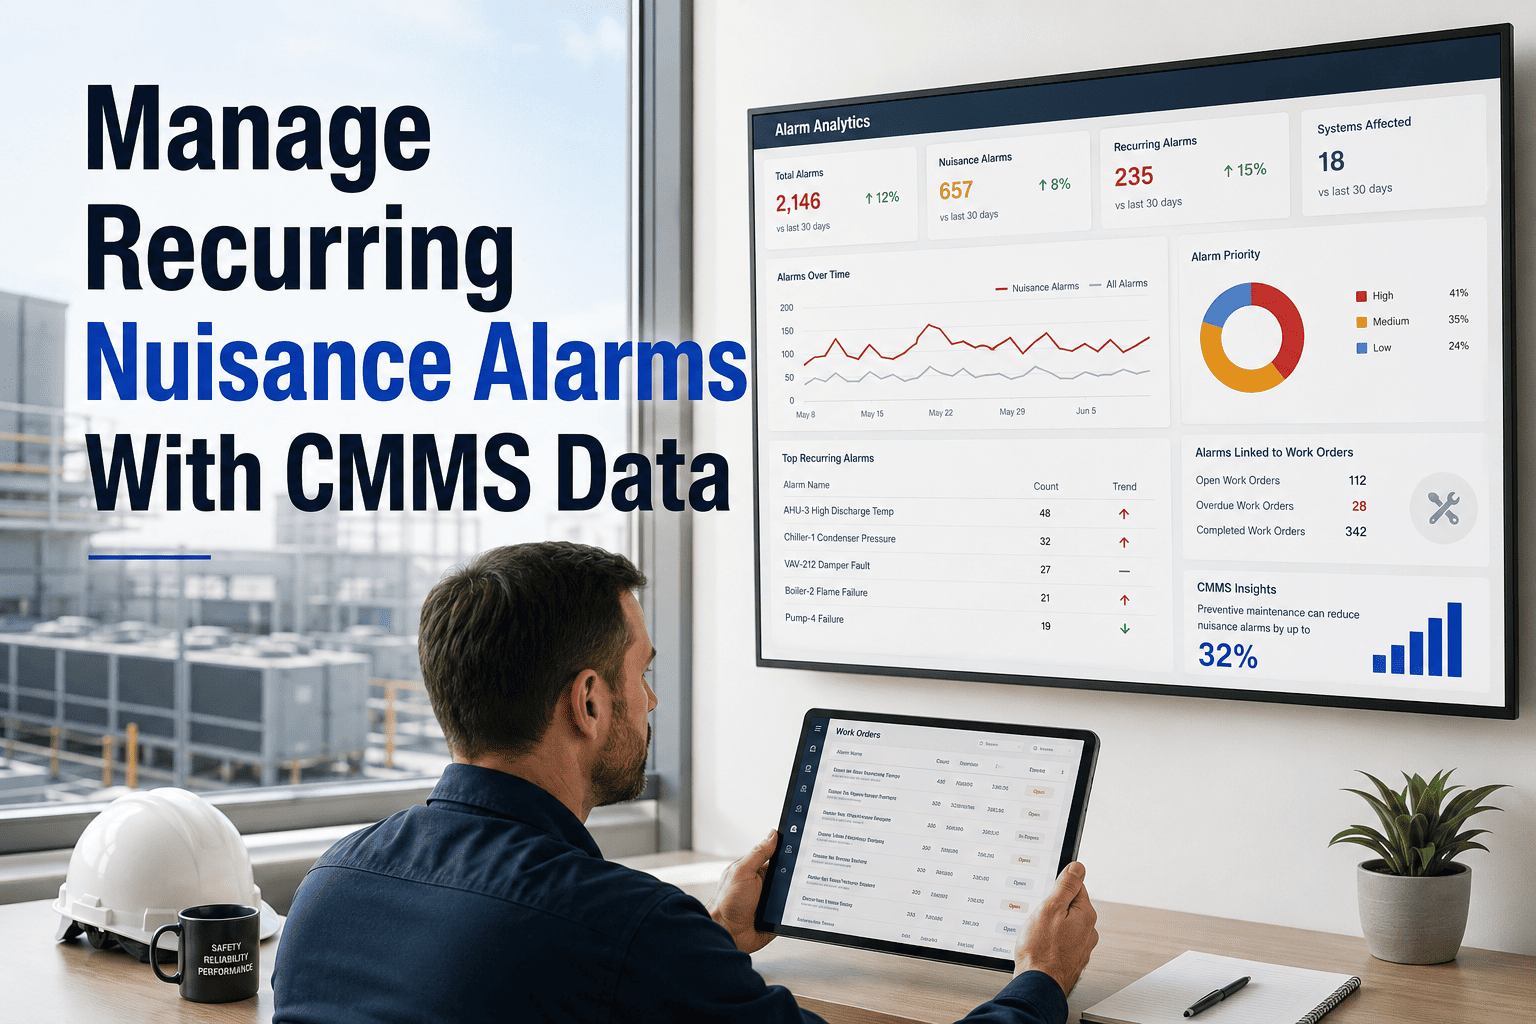
AI clustering of failure events by asset type, failure mode, and operating condition surfaces repeat failure patterns that manual analysis misses. When AI identifies that 60% of pump bearing failures occur within 90 days of a specific maintenance action, that is an actionable root cause finding — not an observation buried in a spreadsheet.
5 Maintenance Cost Reduction Strategies That Work in Practice
Theory does not reduce maintenance costs — specific, measurable actions do. These five strategies are the highest-return interventions available to maintenance managers with a functioning CMMS and cost analytics capability. Oxmaint enables all five out of the box — no custom development required.
Stratify Assets by Criticality and Cost Consequence
Not all assets deserve the same maintenance investment. A criticality stratification that maps failure consequence (production loss, safety risk, replacement cost) against failure probability creates three tiers: critical assets receiving maximum PM attention and predictive monitoring, important assets receiving scheduled PM, and non-critical assets repaired on failure. Most plants over-invest in low-consequence assets and under-invest in critical ones — stratification redirects the same budget more effectively.
Replace Calendar PM with Condition-Based Triggers
Calendar-based PM was designed for an era without data. Today, every asset leaves a data trail — runtime hours, vibration readings, temperature trends, fluid analysis results — that tells you when it actually needs maintenance. Converting the top 20% of your PM tasks by cost from calendar to condition-based scheduling consistently delivers double-digit savings without increasing risk, because servicing stops when it is needed and starts when it is needed.
Convert Reactive to Planned Maintenance Using Trend Data
The highest single source of maintenance cost reduction is the conversion of reactive repairs to planned work. A pump replacement planned during a scheduled outage uses standard parts from stock, normal labour, and pre-arranged rigging — total cost $8,000. The same replacement executed as an emergency failure repair uses expedited parts, overtime labour, and production loss of $40,000+. The trend data to predict most pump failures 2–4 weeks ahead exists in your CMMS — it just needs to be surfaced and acted on. Oxmaint's predictive analytics module makes this trend data visible without a data science team.
Eliminate Repeat Failures Through Root Cause Analysis
Repeat failures — the same asset failing on the same failure mode multiple times within a campaign — are the most visible waste in any maintenance cost report, yet they persist because each event is treated as an isolated incident rather than a pattern to investigate. CMMS failure mode data, when aggregated across asset type and operating unit, reveals the systematic causes that drive repetition: wrong lubricant specification, inadequate seal design for the process fluid, operator handling practices that accelerate wear.
Optimise Parts Inventory Using Work Order Demand Data
Most plant maintenance stores carry 20–30% of inventory value in parts that have not moved in over two years — capital tied up in parts ordered once, over-ordered, or no longer relevant to the current asset fleet. Simultaneously, 5–10% of work orders are delayed by parts unavailability. AI demand forecasting using work order history and failure pattern data addresses both problems simultaneously — reducing slow-moving overstock while increasing stock availability for high-demand items. Book a demo to see inventory optimisation in Oxmaint.
Asset Lifecycle Cost: Where CMMS Data Changes the Capital Decision
The most expensive maintenance decision a plant makes is also the least data-driven: when to replace an asset. Without lifecycle cost visibility from the CMMS, the replacement decision is made on age, gut feel, or the urgency of the latest failure — not on the total cost trajectory. AI-driven lifecycle cost analysis changes this by aggregating actual maintenance spend, failure frequency, parts consumption, and downtime cost per asset to produce a replacement curve that shows exactly when continued maintenance costs more than replacement.
Low maintenance cost, warranty coverage, OEM PM schedule. CMMS value: establish baseline failure rates and parts consumption that will benchmark condition in later years. Missing this baseline makes later AI analysis less accurate.
Stable maintenance cost if PM program is well-managed. AI begins to differentiate asset condition — units with higher actual wear identified for closer monitoring. Condition-based PM delivers peak cost efficiency in this phase.
Maintenance costs rising, failure frequency increasing. AI identifies inflection points where cost per run-hour begins to accelerate. Capital replacement planning should begin when the 3-year maintenance cost trajectory crosses the asset replacement cost threshold.
CMMS lifecycle cost data provides the financial case for capital replacement — total maintenance spend to date, projected future cost based on failure trend, downtime cost attributable to asset, and replacement cost payback period. Decisions made on data, not on the last failure event.
Plants that delay capital replacement decisions based on CMMS cost data — keeping assets in productive service 2–3 years longer than calendar-age would suggest — recover substantial capital budget without increasing maintenance risk, because the replacement decision is made on actual cost trajectory, not assumed age-based deterioration. Oxmaint builds this lifecycle cost view automatically from your work order and parts consumption data.
Oxmaint Cost Analytics: From Data to Cost Decision
Cost analytics is not a report — it is a decision support infrastructure. Oxmaint's cost analytics module aggregates work order cost data, parts consumption, labour hours, and downtime attribution to produce the insights that drive the five strategies above.
Cost per Asset Report
Total maintenance spend per asset over any period — broken down by labour, parts, contractor costs, and downtime attribution. Identifies the top 10% of assets by cost, which in most plants account for 60–70% of total maintenance spend. Drives criticality review, PM interval adjustment, and capital replacement planning.
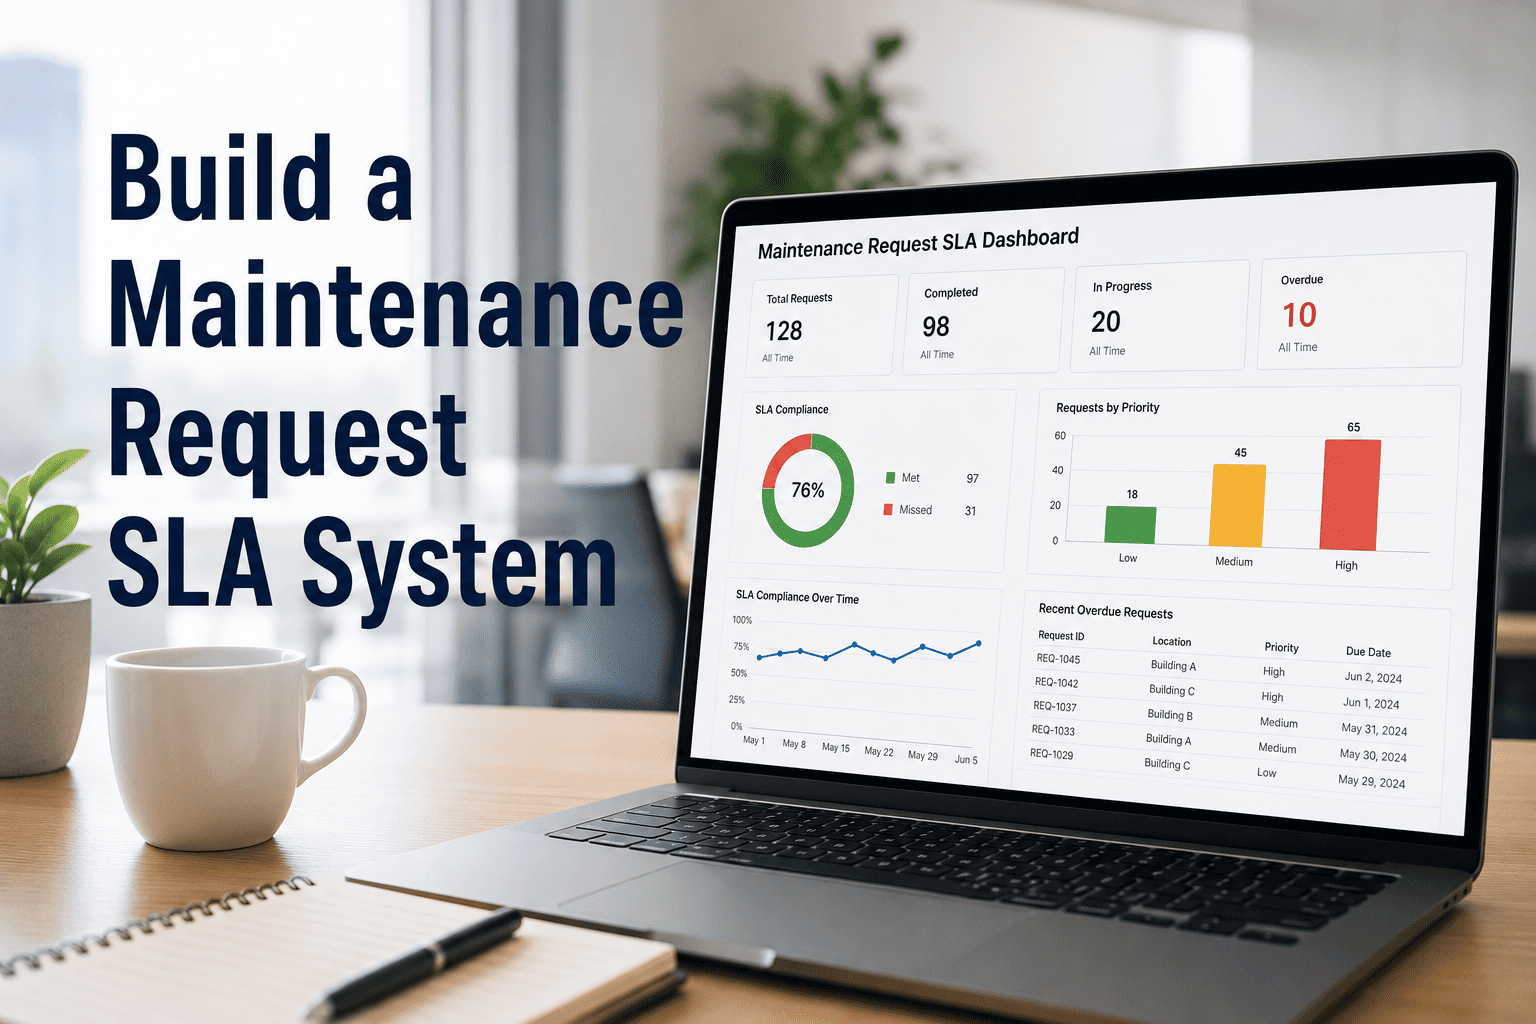
Reactive vs Planned Ratio
Tracks the split between reactive emergency repairs and planned maintenance work over time. The industry benchmark target is below 20% reactive. Trend analysis shows whether AI PM optimisation is shifting the ratio in the right direction month over month.
Failure Mode Cost Analysis
Aggregates total cost by failure mode across the asset fleet — revealing which failure types are driving the most spend. Enables targeted root cause investigation on the highest-cost failure modes rather than reacting to the loudest individual events.
PM Compliance vs Cost Correlation
Correlates PM task completion rate with downstream failure cost by asset group. Quantifies the actual cost of deferred maintenance — giving operations managers the financial case for protecting maintenance budget rather than cutting it as a short-term cost measure.
Spare Parts Demand Forecast
Uses work order history and failure pattern data to forecast parts demand at the SKU level — replacing manual min/max estimation with data-driven reorder points. Reduces overstock capital tied up in slow-moving parts and eliminates stockout delays.
Asset Lifecycle Cost Dashboard
Cumulative maintenance cost per asset tracked over time against the replacement cost threshold. AI identifies assets on an accelerating cost trajectory — flagging them for capital planning review before the next emergency failure forces the replacement decision under the worst possible cost conditions. Integrates with work order history, parts consumption, and downtime attribution to provide a complete total cost of ownership view per asset.
Your Maintenance Budget Is Already Generating the Data to Reduce Itself
Every work order, every parts request, every failure event creates data that AI can turn into a cost reduction insight. Start your Oxmaint cost analytics program free today and have your first asset cost report inside 48 hours of data entry.
Maintenance Cost Optimisation: Frequently Asked Questions
The Maintenance Budget That Reduces Itself Is the One Managed by Data
AI does not reduce maintenance costs by doing less maintenance. It reduces costs by doing the right maintenance, on the right assets, at the right time — and eliminating the emergency repair premium that inflates every reactive organisation's cost base. Oxmaint makes this intelligence operational without a data science team or a multi-year implementation project.