Tracking 15 maintenance KPIs on a spreadsheet you update once a month is not a dashboard — it is an archaeological dig. By the time you surface the data, the problem it reveals has already compounded for four weeks. The maintenance KPIs that prevent downtime are the ones reviewed weekly, displayed where the team sees them, and connected to a defined response when they fall below target. Unplanned downtime accounts for 34.2% of all OEE efficiency losses according to Godlan's 2024 benchmark study of 1,470+ manufacturing operations — and most of that loss is predictable weeks in advance from leading indicator KPIs that most teams collect but never act on. Book a demo to see OxMaint's live maintenance KPI dashboard — or start free and connect your first asset data today.
Guide · Analytics & Reporting · Maintenance KPIs
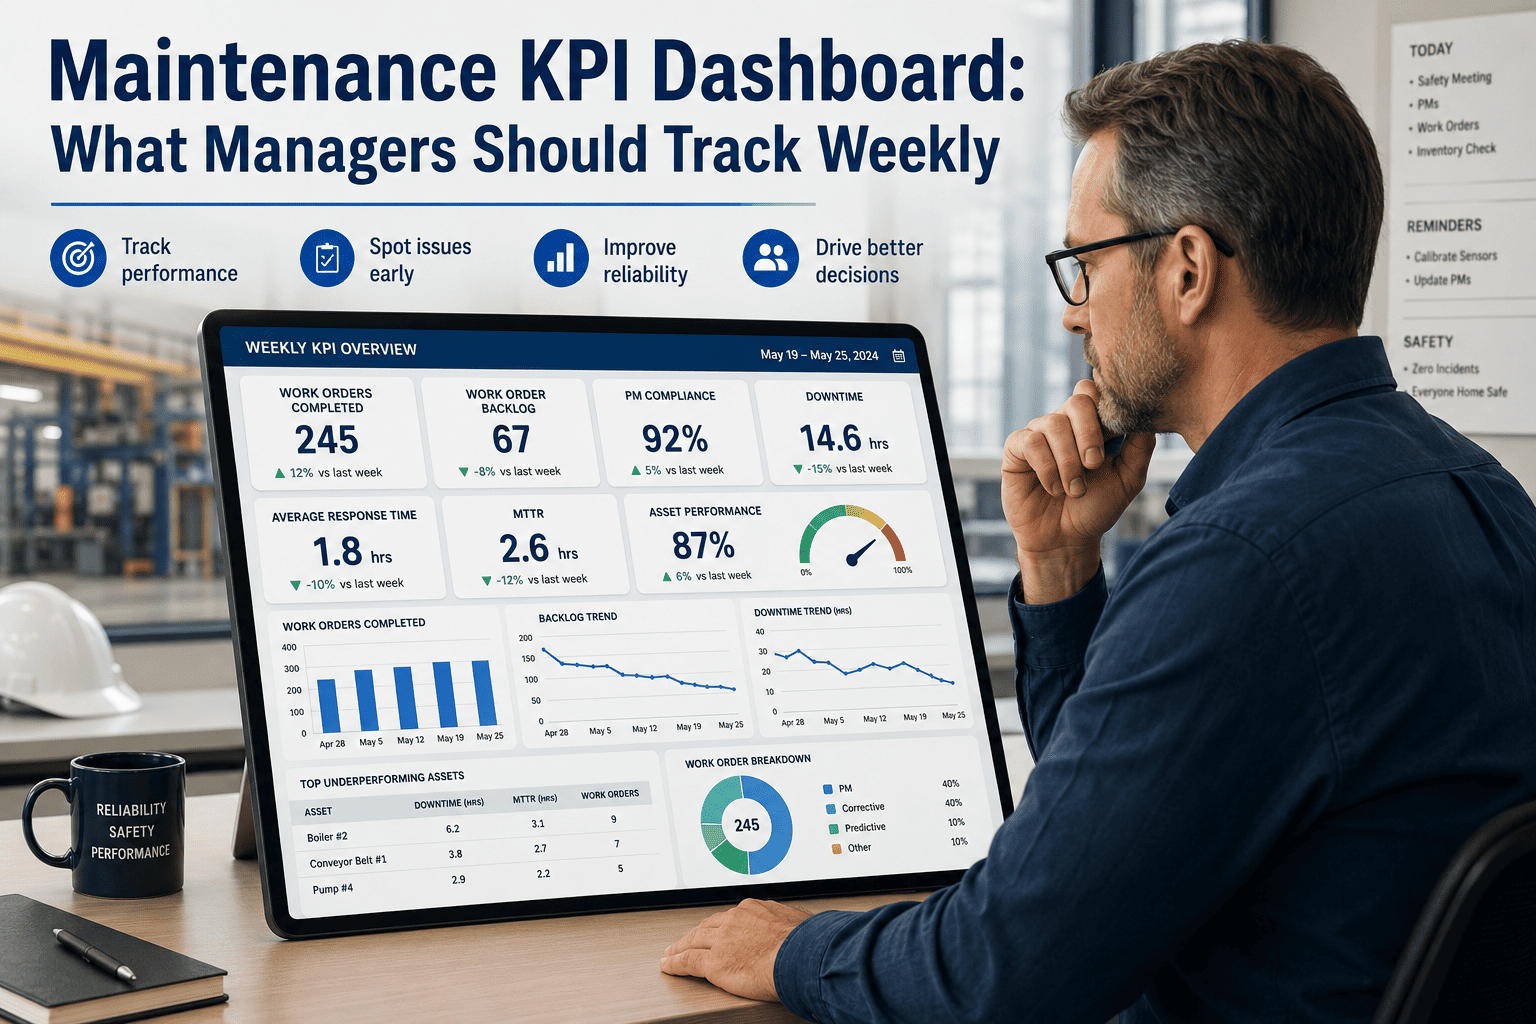
Maintenance KPI Dashboard: What Managers Should Track Weekly
The exact KPIs to review each week, each month, and each quarter — with industry benchmarks, formulas, and the decision each metric is supposed to drive.
OxMaint Live Dashboard — This Week
4.2 wks
Backlog (target 3–5 wks)
31%
Reactive Work (target <20%)
The Review Cadence — Weekly, Monthly, Quarterly
Not all KPIs need the same review frequency. Weekly KPIs are leading indicators you can still act on. Monthly KPIs are trend metrics that require data to accumulate. Quarterly KPIs are strategic metrics that inform budget and planning decisions.
Weekly
Leading indicators — act now or the problem grows
PM Compliance Rate
Schedule Attainment
Maintenance Backlog (weeks)
Reactive Work %
Work Order Completion Rate
Monthly
Trend metrics — meaningful after 3+ data points
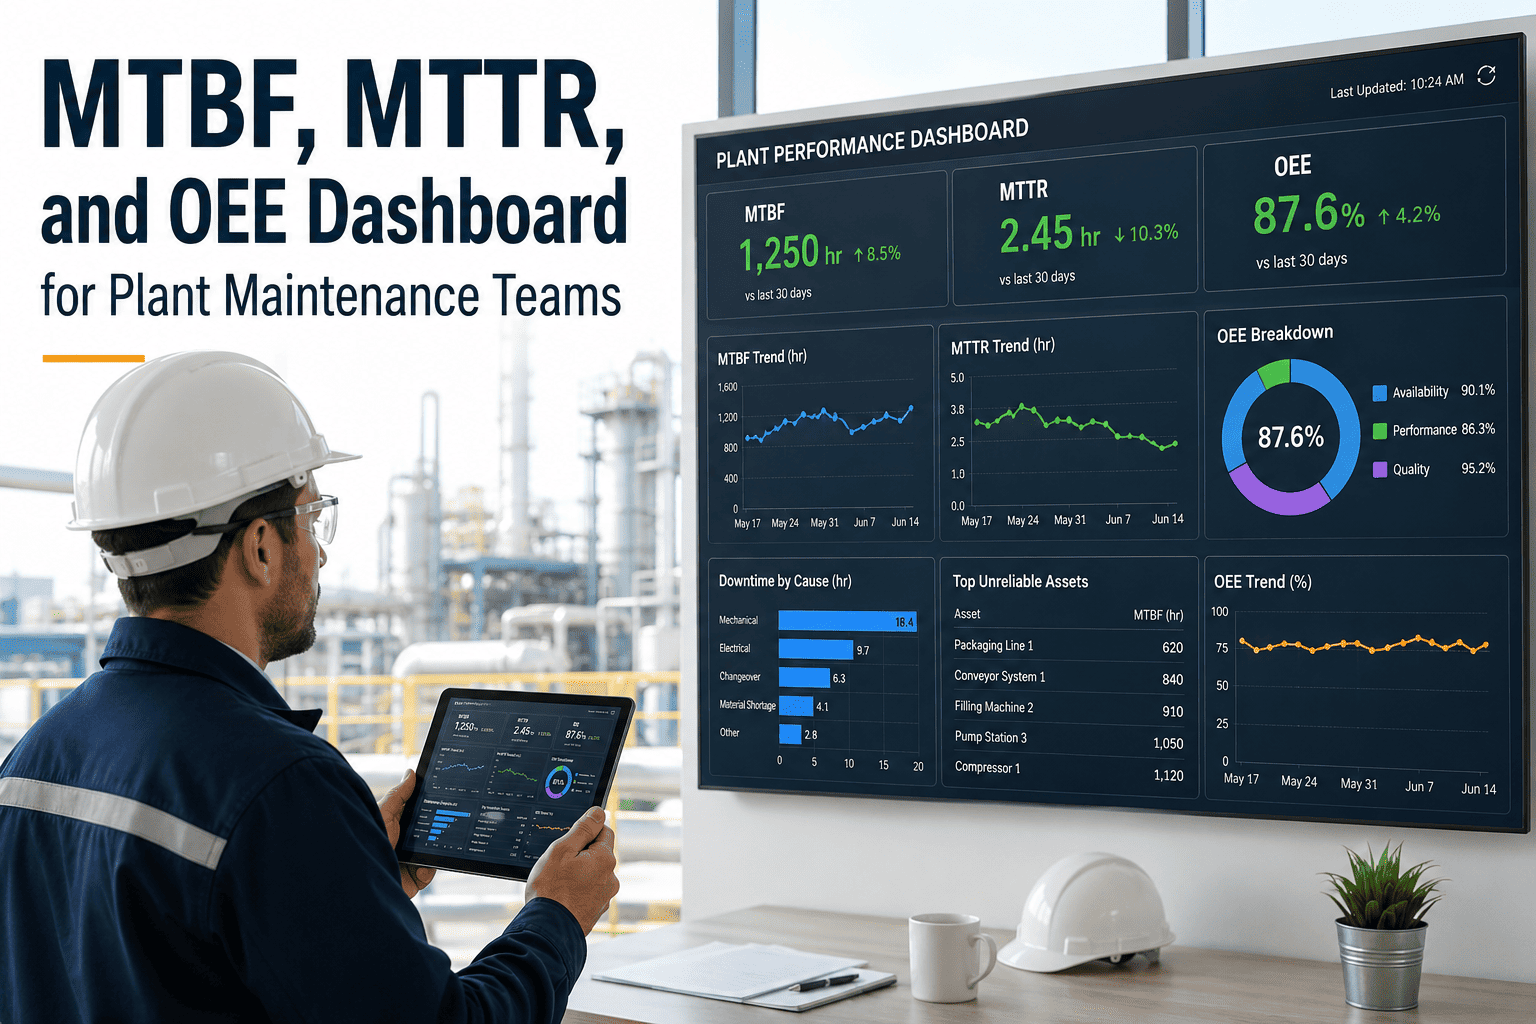
MTBF (Mean Time Between Failures)
MTTR (Mean Time To Repair)
Equipment Availability
Planned Maintenance %
Wrench Time
Quarterly
Strategic metrics — budget and planning drivers
Maintenance Cost as % of RAV
Cost per Work Order
OEE (Overall Equipment Effectiveness)
Emergency vs Planned Cost Ratio
Contractor vs In-house Labour Split
The 8 KPIs That Cover 95% of Maintenance Decisions
| KPI |
Formula |
World-Class |
Industry Average |
Below This = Act Now |
| PM Compliance Rate |
PMs completed on time ÷ PMs scheduled |
≥ 95% |
84% (Plant Engineering 2025) |
Below 80% — add resources or reduce PM scope; below 85% PM programme is at risk |
| Schedule Attainment |
Scheduled WOs completed ÷ Scheduled WOs planned |
≥ 85% |
60–70% |
Below 70% — planning is broken; investigate reactive overload or resource gaps |
| Reactive Work % |
Unplanned WO hours ÷ Total maintenance hours |
< 20% |
40–50% |
Above 30% — in firefighting mode; pause improvement projects and address top failure assets |
| Maintenance Backlog |
Total ready-to-schedule WOs ÷ Weekly crew capacity |
3–5 weeks |
6–10 weeks (unmanaged) |
< 2 weeks = insufficient scope; > 6 weeks = deferred risk accumulating |
| MTBF |
Total operating hours ÷ Number of failures |
Increasing trend |
Asset-class dependent |
Declining MTBF on specific asset = PM ineffective or end-of-life — schedule RCA |
| MTTR |
Total repair time ÷ Number of repairs |
< 4 hrs (critical assets) |
81 min avg (Siemens 2024 data) |
Above 4 hrs on critical assets — investigate parts availability, documentation, or skills gaps |
| Equipment Availability |
MTBF ÷ (MTBF + MTTR) |
≥ 95% |
85–90% |
Below 90% = firefighting mode; unplanned downtime = 34.2% of OEE losses |
| Planned Maintenance % |
Planned WO hours ÷ Total maintenance hours |
85–90% |
50–60% |
Below 50% = reactive plant; every other KPI will be poor until this is fixed first |
ANALYTICS & REPORTING · OXMAINT
Every KPI in This Guide Is Auto-Calculated in OxMaint — Zero Spreadsheets.
OxMaint calculates PM compliance, MTBF, MTTR, availability, backlog, and reactive work % automatically from work order data as your team works — updating live dashboards that managers can review in 5 minutes every Monday morning.
The KPI Cause-and-Effect Chain — Fix One, Improve All
Maintenance KPIs do not operate independently. They form a cause-and-effect chain where improving one metric drives cascading improvements across all the others. Understanding the chain tells you where to intervene first.
1
Increase Planned Maintenance %
The root metric. Moving from reactive to planned maintenance is the intervention that makes every downstream improvement possible. Every organisation stuck at 50% planned work has poor scores on every other KPI below — not because those KPIs are failing independently, but because the source issue has not been addressed.
2
PM Compliance Rises
When planned maintenance % increases, PM compliance becomes trackable and manageable. Teams executing planned work have time to complete it on schedule rather than being pulled off PMs to respond to reactive callouts.
3
MTBF Extends
Consistent PM execution reduces failure frequency. MTBF begins to increase — equipment runs longer between breakdowns because the conditions that cause failures are being addressed before they develop.
4
MTTR Decreases
When failures do occur, they are less complex (because PM has been preventing progressive degradation) and faster to repair (because parts are staged and procedures are documented from the PM programme). MTTR falls as repair quality and preparation improve.
5
Availability and OEE Improve
Higher MTBF and lower MTTR together drive the Availability calculation upward: Availability = MTBF ÷ (MTBF + MTTR). Higher availability directly improves OEE — unplanned downtime is the single largest OEE efficiency loss category at 34.2% of losses in manufacturing.
Expert Review
"The most common mistake I see with maintenance KPI dashboards is that teams track lagging indicators weekly and leading indicators monthly — exactly the wrong way around. MTBF is a lagging indicator: by the time it has declined meaningfully, the failures causing that decline have already happened for weeks. PM compliance is a leading indicator: if it is falling, failures will follow in 4–8 weeks. PM compliance and schedule attainment belong on a wall where every technician and supervisor sees them daily, not in a monthly management report. The metric that most teams undervalue is Planned Maintenance Percentage because it is uncomfortable — it requires the maintenance manager to admit that the organisation is predominantly reactive, and that is a conversation that usually implicates resourcing and scheduling decisions above maintenance's direct control. But PMP is the single metric that predicts the trajectory of every other KPI. An operation at 45% planned work will have poor MTBF, high MTTR, and poor availability — not because the technicians are inadequate, but because the system they are working in does not give them the time to prevent failures before they happen."
Marcus Webb, CMRP, CRL
Certified Maintenance and Reliability Professional (SMRP) · Certified Reliability Leader · 19 years industrial maintenance operations · SMRP Best Practices contributor · Specialist in maintenance programme transformation and KPI implementation
Frequently Asked Questions
Which 3 KPIs should a maintenance team start with?
Start with
Planned Maintenance % (PMP), PM Compliance Rate, and Equipment Availability. PMP tells you whether your maintenance approach is proactive or reactive — this is the root metric. PM compliance tells you whether planned work is actually being executed on schedule. Availability tells you the result: is equipment running when production needs it? These three form a cause-and-effect chain. High PMP drives high PM compliance, which drives high availability. Once these three are stable and data collection is reliable, add MTBF, MTTR, and cost metrics.
Book a demo to see all three auto-calculated in OxMaint.
What is a good PM compliance rate benchmark?
World-class PM compliance is 95% or above. Acceptable is 90%. Below 85% means the PM programme is at risk — either scope is too large for available resources, too many reactive callouts are interrupting planned work, or both. According to Plant Engineering 2025 data, only 28% of facilities achieve 95%+ PM compliance, with the industry average around 84%. Improving from 70% to 95% compliance reduces breakdown frequency by approximately 50%. The weekly review is critical because a compliance rate falling from 93% to 87% over three weeks is actionable — but only if you are looking at it weekly.
How is MTBF calculated and what does declining MTBF mean?
MTBF = Total operating hours ÷ Number of failures in that period. A pump running 2,000 hours per year with 5 failures has an MTBF of 400 hours.
Declining MTBF on a specific asset means failures are occurring more frequently — either the PM programme is not preventing degradation effectively, or the asset is approaching end-of-life. The decision when MTBF trends down for 2+ consecutive months is to review PM effectiveness and schedule a root cause analysis. A rising MTBF trend across the fleet is the primary evidence that your PM programme is working.
Start free to track MTBF automatically per asset in OxMaint.
What should the maintenance backlog target be?
A healthy maintenance backlog is 3–5 weeks of ready-to-schedule work per craft. Below 2 weeks means planners cannot build efficient schedules — they are working day-to-day without enough scope to optimise crew loading. Above 6 weeks means work is ageing and equipment risk is accumulating — deferred maintenance compounds at approximately 7% annually when left unaddressed. Backlog is a leading indicator reviewed weekly: a backlog growing consistently past 6 weeks requires either additional resources, PM scope reduction, or contractor augmentation to prevent it from becoming an uncontrolled deferred maintenance risk.
ANALYTICS & REPORTING · OXMAINT
Your Team Is Already Generating Every KPI in This Guide. OxMaint Calculates Them Automatically.
Every work order your team opens and closes feeds OxMaint's live KPI dashboard — PM compliance, MTBF, MTTR, availability, backlog, and reactive work % updated in real time, no spreadsheet required. Review your full maintenance performance in 5 minutes every Monday morning.