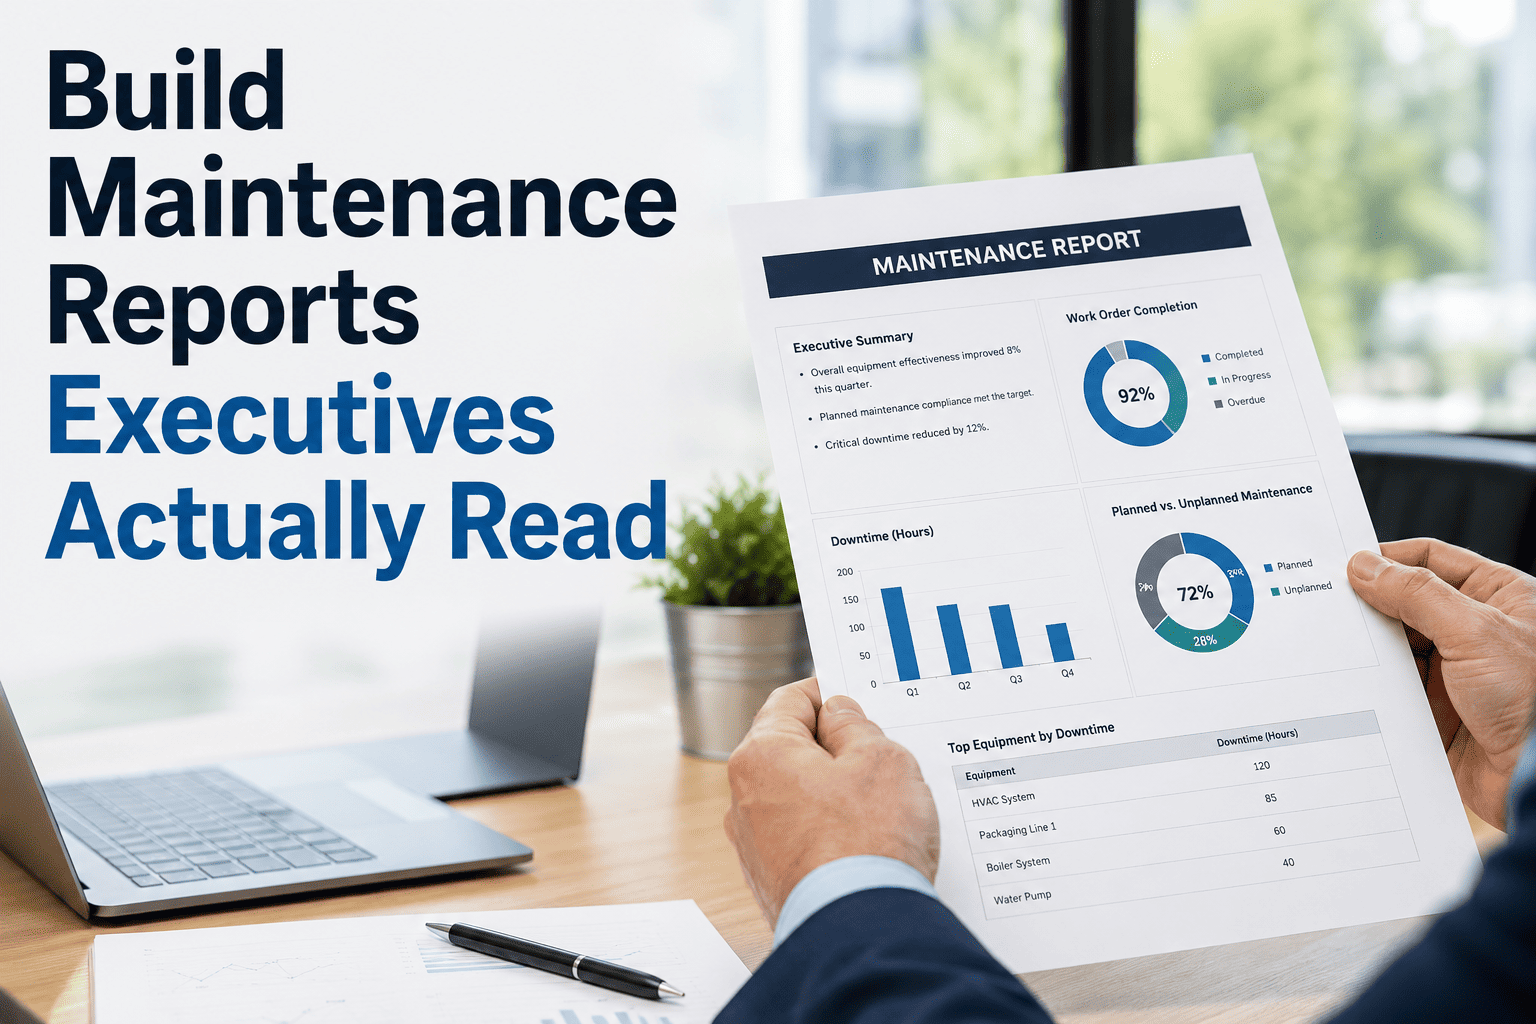
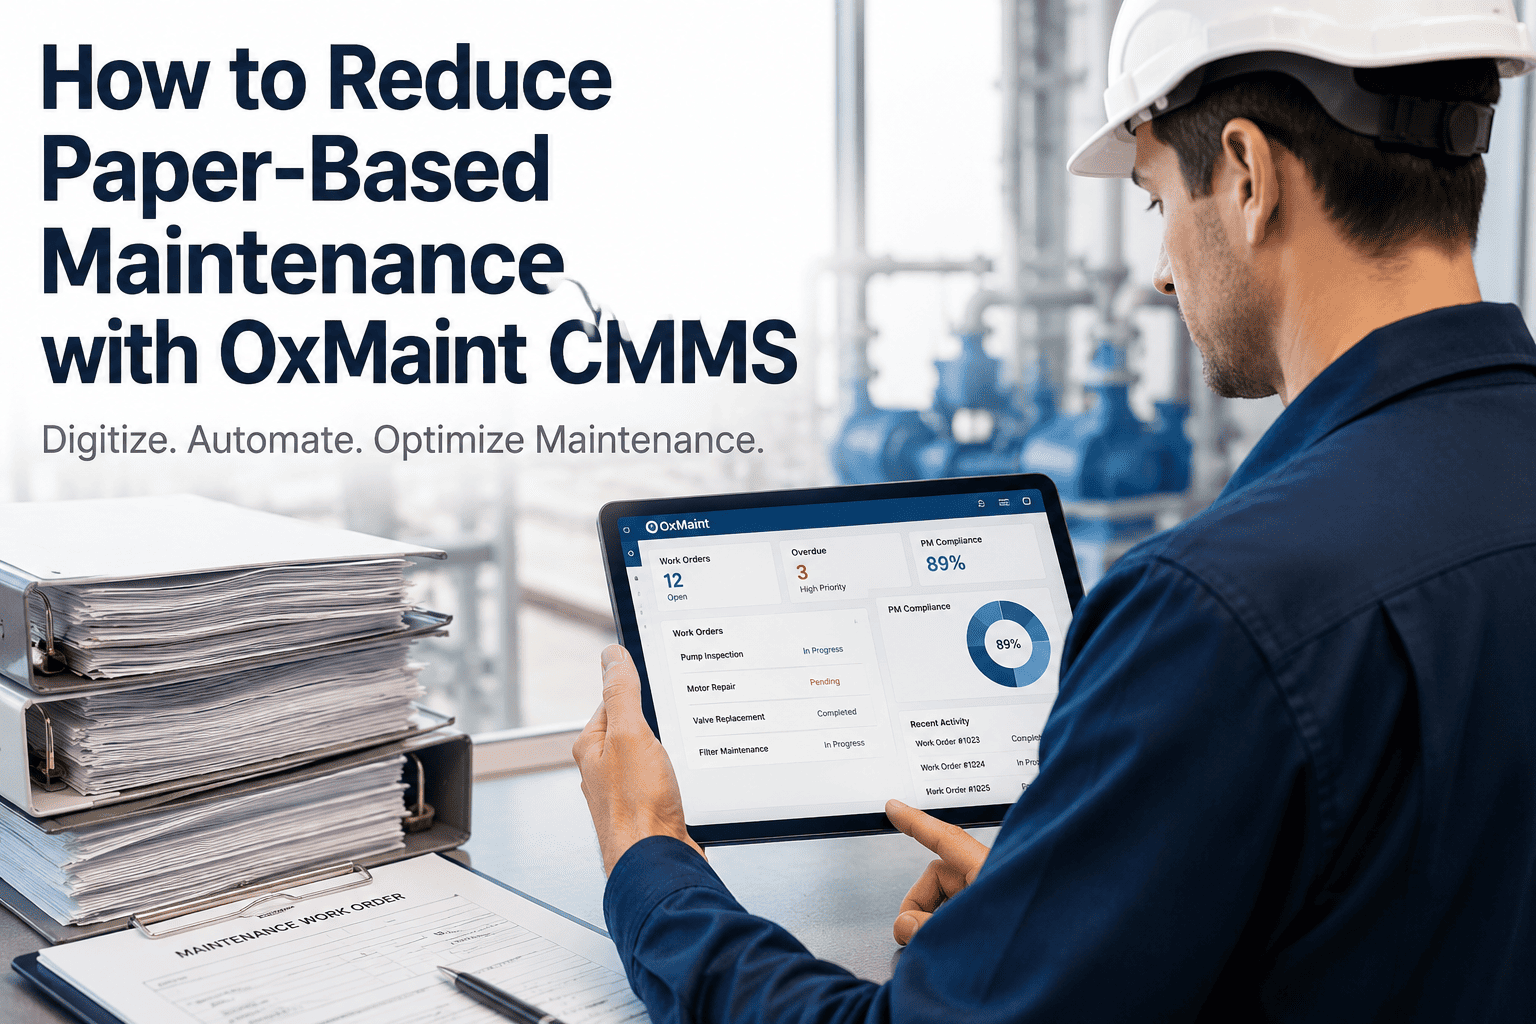
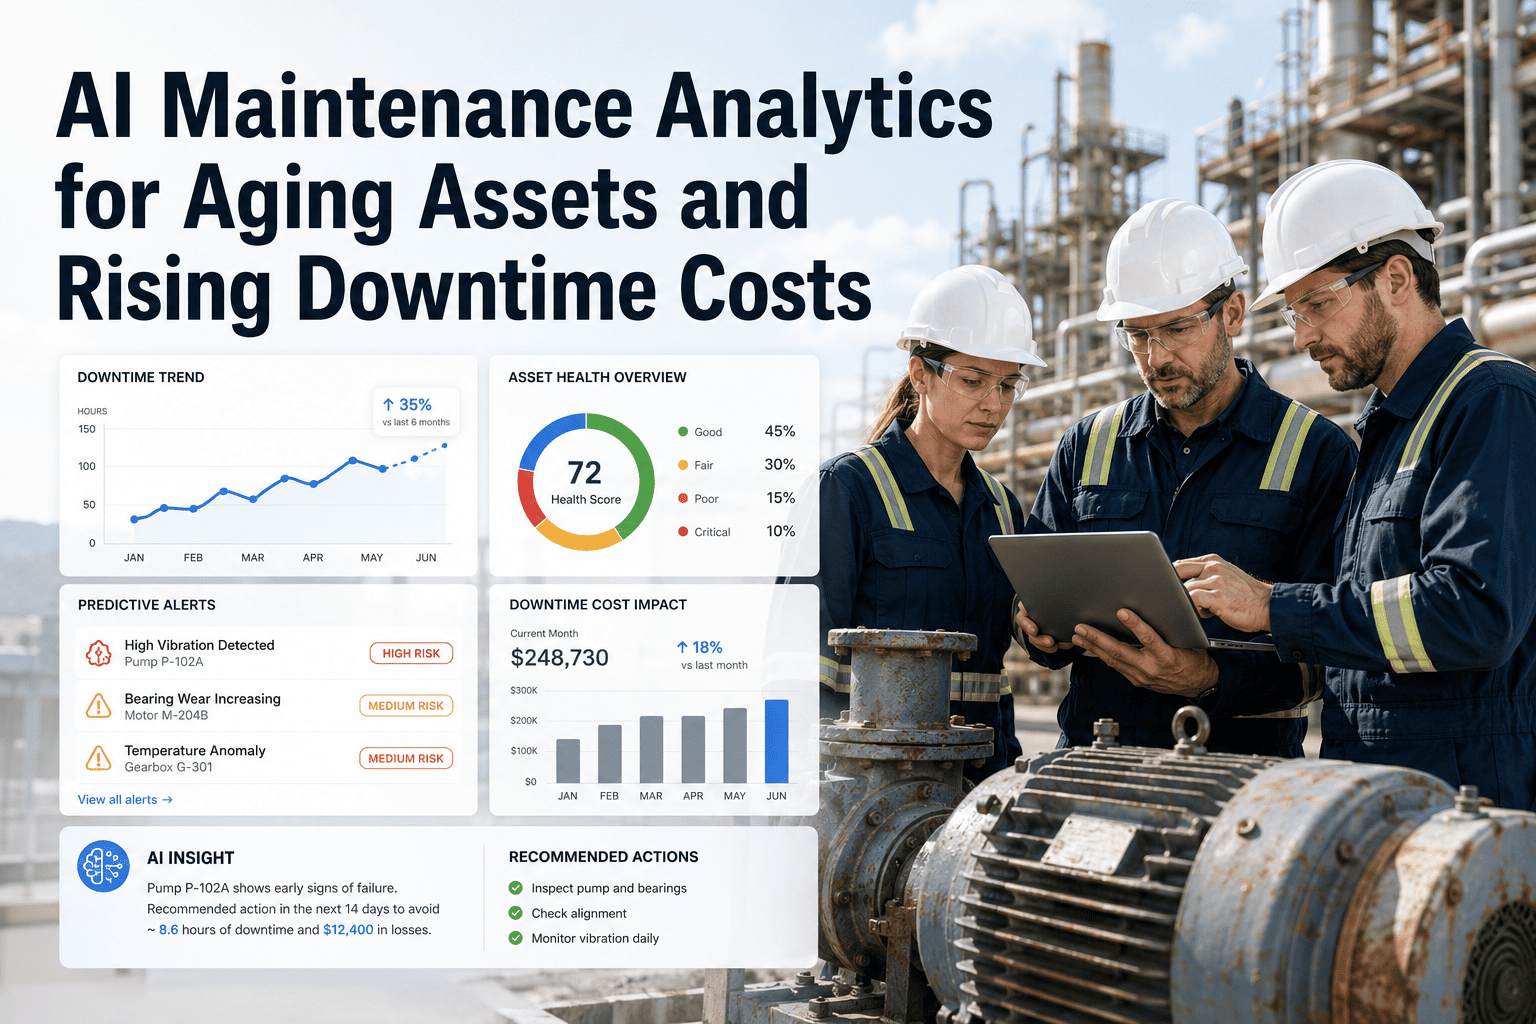
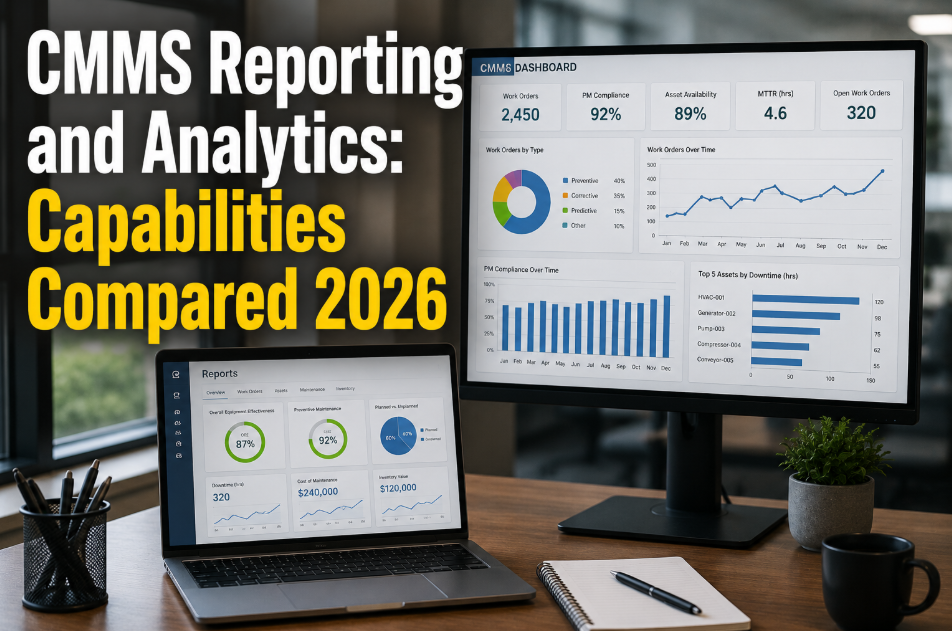
Most maintenance reports are ignored — not because executives don't care about reliability, but because the reports speak the wrong language. Work order counts, PM completion percentages, and backlog numbers mean nothing to a CFO weighing capital allocation decisions. OxMaint's analytics dashboard translates maintenance data into business metrics that executives understand and act on. Book a 30-minute demo to see what an executive-ready maintenance report looks like in practice.
Maintenance Reporting · Analytics · Executive Communication
How to Build Maintenance Reports Executives Actually Read
The maintenance team that speaks in OEE, cost-per-unit, and risk exposure gets capital. The team that reports PM completion percentages gets ignored. Here's how to close the gap — and which metrics to lead with.
$260K
Average annual downtime cost per unplanned failure in manufacturing
8 sec
Time an executive spends on a page before deciding to read or skip
3x
More likely to get budget approval with cost-framed maintenance data
Maintenance Metrics vs Executive Metrics
The same data tells two completely different stories depending on how it's framed. Here's the translation every maintenance manager needs to know.
Maintenance Language
Executive Language
"PM compliance rate: 87%"
→
"13% of critical assets ran without scheduled maintenance last month — representing $X in uninsured failure risk"
"Backlog: 142 open work orders"
→
"Deferred maintenance backlog represents $X in potential emergency repair liability if unaddressed in 60 days"
"MTTR: 4.2 hours"
→
"Each breakdown costs an average of $X in production loss. Reducing MTTR by 1 hour saves $Y annually"
"Parts spend up 18% this quarter"
→
"3 assets account for 67% of parts spend — each is a repair-vs-replace decision that needs leadership attention"
The 6 Maintenance KPIs Executives Actually Care About
01
Downtime Cost per Month
Total production hours lost multiplied by revenue-per-hour. This is the number that directly connects maintenance to the P&L and makes every reliability conversation financial rather than technical.
Hours Lost × $/Hour Production Rate
02
Maintenance Cost as % of Asset Replacement Value
Industry benchmark: 2–5% for well-maintained facilities. Above 8% signals that an asset is in terminal decline and replacement analysis is overdue. This reframes spend as a percentage of capital, not an isolated expense.
Annual Maint. Cost ÷ Asset Replacement Value × 100
03
Planned vs Reactive Maintenance Ratio
World-class facilities run 80–90% planned maintenance. Each 10% shift from reactive to planned maintenance typically yields 20–25% reduction in maintenance cost. Executives understand that reactive is expensive — this ratio shows the opportunity.
Planned WO Hours ÷ Total WO Hours × 100
04
Overall Equipment Effectiveness (OEE)
Availability × Performance × Quality Rate. OEE is the most universally understood asset performance metric in manufacturing and operations leadership. Present it per critical asset to show where reliability investment is most needed.
Availability % × Performance % × Quality %
05
Backlog Trend (Risk Exposure)
A growing deferred maintenance backlog is a risk register item, not just a scheduling problem. Frame it as total estimated repair liability if the backlogged work fails — this converts backlog from an operational metric into a financial risk disclosure.
Open WOs × Avg. Emergency Repair Cost Premium
06
Safety Event Rate (per 1,000 Work Hours)
Near-misses, incidents, and safety-related work orders expressed as a rate give executives a compliance risk indicator. Linking this to maintenance activity shows the direct connection between PM execution and workplace safety outcomes.
Safety Events ÷ Total Work Hours × 1,000
A 1-Page Executive Report Structure That Works
Downtime Cost This Period
$[X]
vs $[Y] prior period
Planned Maintenance Rate
[X]%
Target: 80%+
Deferred Backlog Risk
$[X]
[X] open WOs
Safety Event Rate
[X]/1K hrs
Industry avg: 2.1
Top 3 Assets by Downtime Cost
1Asset A — $[X] downtime cost — Repair/Replace decision pending
2Asset B — $[X] downtime cost — PM schedule optimized
3Asset C — $[X] downtime cost — Root cause investigation open
Decisions Needed from Leadership
▶Asset A replacement: estimated $[X] vs $[Y] in continued repair cost
▶Backlog reduction requires [X] contractor days — approval needed
▶PM software upgrade budget: $[X] — estimated $[Y] annual savings
Expert Review
PJ
Patricia Johanssen
VP Operations, Industrial Manufacturing (Retired) · Board Advisor · CMRP
In 25 years of reviewing maintenance reports as an executive, I can count on one hand the number that were actually useful for decision-making. The rest were operational scorecards that told me what happened but never why it mattered to the business or what decision I needed to make. The best maintenance leaders I worked with understood that every metric needs a dollar sign or a risk rating before it reaches the boardroom. If your maintenance report doesn't contain at least one line that says "this requires a decision," it's informational content — not an executive document.
Generate Executive-Ready Reports in One Click
OxMaint's analytics module converts your work order data into executive dashboards — downtime cost, backlog risk, OEE trends, and safety rates — automatically, with no manual assembly.
Frequently Asked Questions
How often should maintenance teams present reports to executives?
Monthly reporting is the standard cadence for most facilities — frequent enough to show trends and act on emerging risks, but not so frequent that it becomes noise. However, a monthly report is most effective when accompanied by a real-time dashboard that operations leadership can check independently. The monthly report should highlight decisions needed from leadership, changes from the prior period, and forward-looking risk items. Routine operational metrics — daily PM completion, technician utilization — belong in operational dashboards, not executive summaries.
OxMaint supports both reporting types natively.
What's the most effective way to use maintenance data to justify a budget increase?
The most effective budget justification connects deferred maintenance or underinvestment directly to a financial consequence. Start with your top 3 assets by corrective maintenance spend and show the cost trajectory over 12 months. Then calculate the premium your team pays for emergency repairs versus planned repairs — industry data shows emergency repair costs run 3–9x higher than planned maintenance cost for the same scope of work. Present the budget increase as an investment with a defined return: "X dollars in PM investment prevents Y dollars in unplanned repair cost." OxMaint's reports generate this analysis automatically from work order history.
Should maintenance reports include safety data, or is that a separate HR/EHS function?
Safety data absolutely belongs in maintenance reports — and in most regulated industries, it's a requirement. The connection between PM execution and safety incident rates is direct and well-documented: facilities with PM compliance above 90% consistently have significantly lower safety incident rates than facilities below 70%. Presenting this connection in your maintenance report reinforces that maintenance is not just an equipment function — it's a safety function with measurable outcomes. It also creates a compelling argument for maintenance investment at the board level, where safety performance is always a priority topic.
Book a demo to see how OxMaint tracks this data.
How do I get the financial data I need to calculate downtime cost per asset?
The simplest approach is to work with your finance team to establish a revenue-per-operating-hour figure for each production line or major asset group. This is typically available from production cost accounting. Once you have this rate, downtime cost = hours lost × revenue per hour. For non-production assets like utilities or HVAC, downtime cost is calculated differently — often as the emergency repair premium or the cost of the operational disruption caused. Many CMMS platforms, including OxMaint, can integrate with ERP financial data to calculate downtime cost automatically once the per-hour rates are configured.