Most maintenance budgets have a serious leak — and it is not in the parts room or the overtime line. It is buried inside work order data that nobody is reading analytically. Labor hours logged to the wrong asset. Parts consumed on repeat repairs that should have been root-caused six months ago. Vendor invoices approved without comparison to work order labor records. Emergency calls that cost $800 each and happen every three weeks on the same compressor. The data to find every one of these cost leaks already exists in your CMMS — the question is whether anyone is looking at it. If your maintenance spend keeps climbing without a clear explanation, start a free trial or book a demo to see how Oxmaint surfaces hidden costs from work order data.
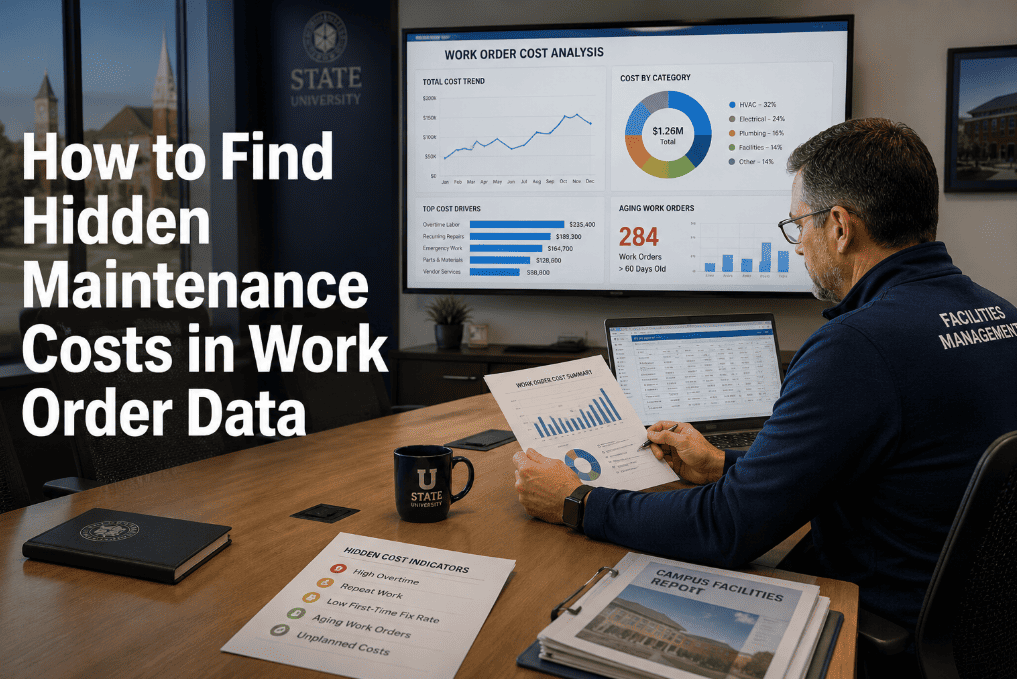
How to Find Hidden Maintenance Costs in Work Order Data
Labor hours, repeat repairs, parts usage, vendor spend, and overtime patterns in your work order data are pointing directly at your biggest cost leaks. Most teams never look. Here is how to read the data that reduces maintenance spend without cutting service quality.
Work Order Data Is Your Financial Audit Trail — Are You Reading It?
Every work order your team closes contains cost intelligence: how long the job actually took versus the estimate, which parts were consumed, whether this asset has failed the same way before, and whether a vendor was called instead of an in-house tech. Aggregated across hundreds or thousands of work orders, this data reveals exactly where your maintenance budget is disappearing. The teams that find and eliminate hidden costs do it with analytics — not intuition. Oxmaint's reporting layer surfaces every cost pattern in your work order history automatically. Start a free trial or book a demo to run your first cost analysis.
Where Hidden Maintenance Costs Actually Live in Work Order Data
Hidden maintenance costs do not appear as a single line item. They accumulate across six categories that look normal in isolation but reveal patterns of waste when analyzed together. Each category has a signature in your work order data that Oxmaint's analytics can surface in minutes.
Work orders closed with actual hours significantly above estimated hours are a cost leak signal. A 15-minute PM that consistently takes 45 minutes is either misestimated, improperly staffed, or symptomatic of a deeper asset problem. Teams that never compare estimated vs. actual labor hours across work order categories cannot see where time is disappearing.
Assets with three or more work orders for the same failure mode within 12 months are consuming budget that a single root-cause repair would have prevented. Repeat repair cost is the most consistently underreported maintenance expense because each work order looks routine — only the pattern reveals the waste. Industry data shows 38% of maintenance spend goes to repeat failures.
Parts pulled from inventory and used on work orders that are not recorded against the correct asset create two cost problems: inflated future parts orders to cover the untracked consumption, and no asset-level cost-of-ownership data to support replacement decisions. Studies show 18–25% of parts inventory movement goes unrecorded in facilities without enforced parts tracking on work orders.
Overtime work orders cost 1.5x regular labor rates. Emergency call-outs on nights and weekends often run 2x or more. When reactive failures generate a pattern of after-hours call-outs on the same assets, the overtime premium is a direct cost of deferred or missed preventive maintenance. This pattern is invisible unless work orders are analyzed by time-of-day and asset history together.
Vendor work orders closed without comparison to in-house labor rates, quoted scope, and actual hours billed create persistent cost overruns. Vendor invoices that exceed work order estimates by more than 15% without documented justification represent a controllable cost — but only if work order data and vendor billing are analyzed together. Many facilities approve vendor invoices without this comparison because the data sits in separate systems.
Production or operational downtime caused by equipment failures is a real cost — lost revenue, idle staff, rescheduled loads. When downtime events are not linked to the work order that caused them, the cost remains invisible to both maintenance and finance. Assets with high downtime-to-repair ratios are strong candidates for replacement — but replacement cannot be justified without the downtime cost data attached to the work order record.
The Five Work Order Reports That Uncover Hidden Costs
You do not need a data science team to find hidden maintenance costs. You need five reports run consistently against your work order data. Each report surfaces a specific category of waste. Together they give maintenance managers a complete picture of where budget is leaking and where to act first.
Filter all closed work orders for the same failure code on the same asset within a rolling 12-month window. Any asset with three or more matching failure codes is a repeat repair candidate. Sort by total cost of repeat events to prioritize root-cause investigation. The top 10 assets on this report typically account for 60–70% of repeat repair spend.
Compare estimated labor hours to actual hours logged across work order categories — PM, corrective, emergency, and vendor. Categories with consistent actual-over-estimate ratios above 120% indicate either systematic underestimation, scope creep, or asset conditions that make standard tasks more complex. This report is the fastest path to recovering 15–20% of labor budget.
Sum all labor, parts, vendor, and downtime costs attached to each asset over its service life. Compare against original asset value and current replacement cost. Assets where cumulative maintenance cost exceeds 60–70% of replacement cost are financial candidates for capital replacement — a data-driven CapEx argument that CFOs can approve without guesswork.
Calculate the ratio of emergency reactive work orders to planned PM work orders by department, asset class, and time period. An emergency-to-planned ratio above 30% signals a PM program that is not preventing failures fast enough. The cost implication: every percentage point improvement in this ratio reduces total labor cost by an estimated 1.2–1.8% through elimination of overtime premiums and emergency call-out rates.
Match every closed vendor work order against the vendor invoice for that job. Flag any invoice where billed hours exceed work order logged hours by more than 10%, or where billed parts differ from work order parts consumed. Run this monthly across all active vendors. Teams that run this report consistently identify 12–18% vendor overbilling that was previously approved without review.
List all parts consumed against each asset in the trailing 12 months, sorted by total parts cost. Assets consuming parts at a rate disproportionate to their criticality or age are either improperly maintained or candidates for replacement. This report also identifies the 20% of SKUs that account for 80% of parts spend — the starting point for parts procurement negotiation and min-max stocking optimization.
How Oxmaint Makes Hidden Costs Visible Automatically
Oxmaint's analytics and reporting layer is built on the principle that cost intelligence should not require a separate BI tool or manual spreadsheet exports. Every work order closed in Oxmaint contributes to real-time cost dashboards, repeat failure tracking, and asset total cost of ownership reporting — automatically. Maintenance managers ready to stop guessing about where budget is going can start a free trial or book a demo to see the reporting suite.
Oxmaint automatically flags when the same failure code appears on the same asset more than twice in 12 months — generating a repeat failure alert and prompting a root-cause work order. The cost of every repeat event is totaled and displayed alongside the asset record, making the financial case for investigation impossible to ignore.
Every Oxmaint work order captures estimated labor hours at creation and actual hours at closure. The analytics dashboard aggregates this variance by technician, asset class, work order type, and department — giving maintenance managers a weekly view of where labor is overrunning and where estimation accuracy needs improvement.
Oxmaint builds a running total cost of ownership for every asset in the registry — summing all work order labor, parts consumed, vendor invoices, and linked downtime events. When cumulative maintenance cost approaches replacement threshold, Oxmaint flags the asset for CapEx review and generates a cost-justified replacement recommendation.
The emergency-to-planned ratio dashboard in Oxmaint shows exactly which departments, asset classes, and time periods are generating the highest reactive maintenance burden — and what it is costing in overtime premiums and emergency rates. Managers can set ratio targets and track weekly progress toward a more planned maintenance posture.
Oxmaint's vendor work order records capture the scope, estimated hours, and parts list at work order creation. When vendor invoices arrive, the reconciliation report flags discrepancies between billed and estimated amounts — giving procurement teams the data to dispute overbilling before invoices are approved and paid.
Every part pulled from Oxmaint inventory is linked to a work order and an asset. Parts consumption reports show cost by asset, by category, and by time period — identifying the 20% of parts that drive 80% of spend, and the assets consuming parts at unsustainable rates that signal replacement over continued repair.
Reactive Cost Management vs. Work Order Analytics
What Each Hidden Cost Category Typically Costs — And What Finding It Saves
| Hidden Cost Category | Typical Annual Impact | Root Cause in Work Order Data | Oxmaint Report | Avg Savings When Found |
|---|---|---|---|---|
| Repeat Repair Spend | 38% of total maintenance budget | Same failure code, same asset, multiple WOs | Repeat WO Report | 20–35% reduction in repair spend |
| Labor Hour Overruns | 22% above estimated labor cost | Actual hours consistently exceed WO estimate | Est vs. Actual Report | 15–22% labor cost recovery |
| Untracked Parts Consumption | 18–25% of inventory disappears | Parts pulled with no WO or asset linkage | Parts Consumption Report | 10–18% inventory spend reduction |
| Emergency and Overtime | 4.8x cost vs. planned repairs | High reactive WO ratio, after-hours patterns | Emergency Ratio Dashboard | 25–40% overtime reduction |
| Vendor Overbilling | 12–18% above quoted scope | Invoice hours exceed WO labor records | Vendor Reconciliation Report | 12–18% vendor spend recovered |
| Unattributed Downtime Cost | $260K+/hr in manufacturing | No downtime event linked to causative WO | Asset TCO Report | Justifies replacement before next event |
What Maintenance Teams Recover When They Analyze Work Order Costs
Teams that systematically analyze work order cost data reduce total maintenance spend by 20–30% within the first year — primarily through repeat repair elimination and overtime reduction
Root-cause investigation on the top 10 repeat failure assets eliminates the majority of the 38% of budget currently consumed by recurring failures on the same equipment
Every dollar invested in structured work order analytics typically returns $3.50 in identified and eliminated waste within 12 months of consistent reporting
Most maintenance teams identify their top three cost leaks within the first month of structured analytics and implement corrective action producing measurable savings within 90 days
Frequently Asked Questions
What is the single fastest way to find hidden maintenance costs in work order data?+
How should maintenance managers present hidden cost findings to CFOs or executives?+
How does poor parts tracking inflate maintenance costs?+
At what maintenance cost-to-replacement ratio should an asset be replaced rather than repaired?+
Your Work Order Data Already Has the Answers. Start Reading It.
Hidden maintenance costs do not require new spending to find — they require the right analytics applied to the work order data your team is already generating. Oxmaint surfaces repeat failures, labor overruns, vendor overbilling, and asset cost-of-ownership automatically. Most teams identify their first major cost reduction opportunity within 30 days of going live.