Most maintenance teams track equipment failures the same way they tracked them in 1998 — a whiteboard, a spreadsheet, and a gut feeling about which assets are about to fail. That approach cost manufacturers an average of $532,000 per hour of unplanned downtime in 2024. MTBF, MTTR, and OEE are not acronyms for compliance documents. They are the three numbers that separate operations running at 87% efficiency from those stuck at 61%. When you know your Mean Time Between Failures, your Mean Time To Repair, and your Overall Equipment Effectiveness — and more importantly, when those numbers are tracked automatically and updated in real time — you stop reacting to failures and start preventing them. Want to see how modern CMMS tracks these KPIs automatically? start a free trial or book a demo to see live dashboards built around your equipment.
Maintenance KPIs · Analytics · 2026 Guide
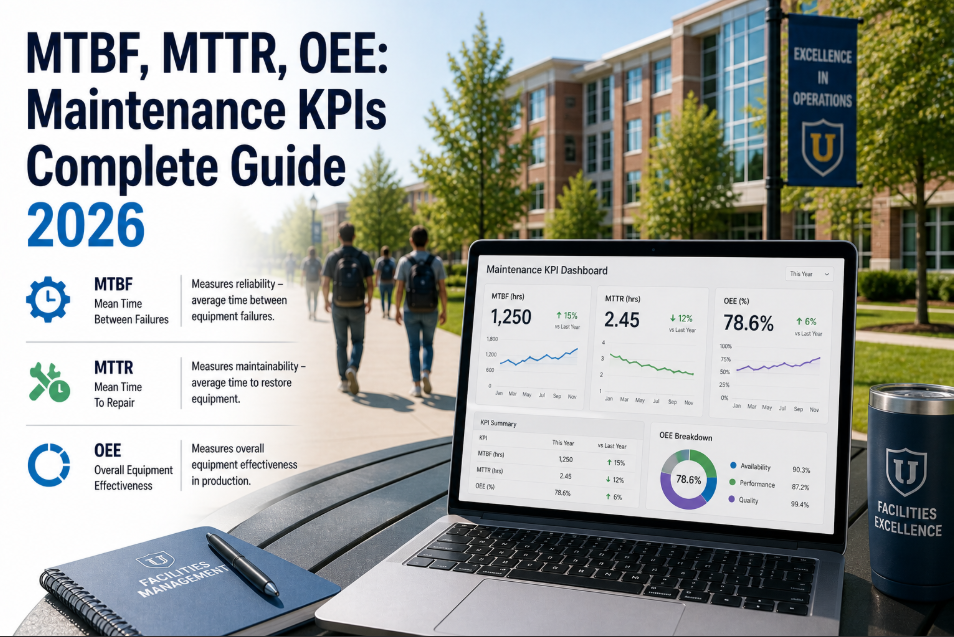
MTBF, MTTR, OEE: The Three Numbers Running Your Plant
Formulas, benchmarks, industry data, and how to track them automatically — not in spreadsheets
$532K
avg. cost per hour of unplanned downtime in manufacturing (2024)
65%
of plants still calculate MTBF manually in spreadsheets
4.8x
more expensive — emergency repair vs. planned maintenance
23%
OEE improvement reported by plants switching to automated KPI tracking
See MTBF, MTTR, and OEE tracked automatically across every asset in your plant — no spreadsheets, no manual calculations, no lag.
Ready to eliminate manual KPI tracking? Start a free trial and connect your asset data in under 24 hours, or book a demo to see live OEE dashboards.
What These Three KPIs Actually Measure
MTBF
Mean Time Between Failures
Formula: Total Operating Time / Number of Failures
MTBF tells you how long, on average, a piece of equipment runs before it breaks down. A pump with 1,200 operating hours and 4 failures has an MTBF of 300 hours. Higher MTBF = more reliable equipment. Declining MTBF = asset is degrading and failure is coming sooner.
Example: If your CNC machine runs 2,000 hours/year with 5 breakdowns, MTBF = 400 hours per failure.
MTTR
Mean Time To Repair
Formula: Total Repair Time / Number of Repairs
MTTR measures how long your team takes to restore equipment after a failure — from the moment it stops to the moment it is running again. This includes diagnosis, parts sourcing, repair, and testing. Lower MTTR = faster recovery. MTTR above 4 hours on critical assets is a red flag in most industries.
Example: 3 repairs taking 2h, 3h, and 4h = MTTR of 3 hours average.
OEE
Overall Equipment Effectiveness
Formula: Availability x Performance x Quality
OEE is the gold standard for measuring manufacturing productivity. It combines three factors: how often the equipment is available to run (Availability), how fast it runs compared to its ideal rate (Performance), and how much of its output meets quality standards (Quality). World-class OEE is 85%+. Most plants average 60-65%.
Example: 90% Availability x 95% Performance x 98% Quality = 83.8% OEE.
The MTBF Calculation — With Real Industry Examples
MTBF = Total Operating Time / Number of Failures
Food and Beverage
Packaging Line Conveyor
Operating hours: 6,240/year · Failures: 18
MTBF = 347 hours
Benchmark: 400+ hours (world class)
Automotive Manufacturing
Robotic Welding Cell
Operating hours: 4,160/year · Failures: 6
MTBF = 693 hours
Benchmark: 600+ hours (world class)
Pharmaceuticals
Tablet Press Machine
Operating hours: 3,000/year · Failures: 12
MTBF = 250 hours
Benchmark: 350+ hours (world class)
Cold Storage / Logistics
Refrigeration Compressor
Operating hours: 8,760/year · Failures: 4
MTBF = 2,190 hours
Benchmark: 2,000+ hours (world class)
Tracking MTBF manually means your numbers are always 2 weeks out of date. Oxmaint calculates MTBF automatically from every work order closed — updated in real time, per asset, per site. Start a free trial and see your MTBF dashboard live, or book a demo to walk through MTBF trending with your own asset data.
The MTTR Calculation — And Why Most Teams Get It Wrong
MTTR = Total Repair Time / Number of Repairs
What Counts in MTTR
Detection time — from failure to alert
Response time — technician travel to asset
Diagnosis time — identifying root cause
Parts sourcing time — finding and fetching parts
Active repair time — actual fix duration
Testing and restart — verifying the fix
Where MTTR Gets Inflated
No digital alert — failure found during shift walkthrough
Parts not in stock — technician waits 2+ days for delivery
No repair history — technician diagnoses from scratch
Wrong technician dispatched — trade mismatch
Paper-based work orders — approval delay before repair starts
No escalation path — supervisor unreachable during repair
MTTR Benchmarks by Industry
AutomotiveTarget: <2h
Food and BeverageTarget: <3h
PharmaceuticalsTarget: <4h
Discrete MfgTarget: <3.5h
Facility MgmtTarget: <6h
Cold ChainTarget: <2.5h
The MTTR Reduction Playbook
Pre-load repair SOPs on each asset — technician arrives knowing step 1
Maintain critical spares buffer on-site — zero wait for priority parts
Automatic technician dispatch by skill and proximity — right person first time
Mobile work orders with photo documentation — faster diagnosis on repeat failures
Push notifications to supervisors — no approval delays on critical repairs
Digital repair history per asset — 3 years of failure patterns in your pocket
OEE Broken Down — The Three Losses Destroying Your Output
Availability
Run Time / Planned Production Time
Covers downtime losses: breakdowns, changeovers, and unplanned stops
World class: 90%+
x
Performance
Actual Output / Theoretical Output
Covers speed losses: slow cycles, minor stops, and reduced speed runs
World class: 95%+
x
Quality
Good Parts / Total Parts Produced
Covers quality losses: defects, rework, and startup rejects
World class: 99%+
=
OEE Score
Single Efficiency Number
The one number your plant manager needs every morning
World class: 85%+
<40%
Critical
Significant losses across all three factors. Requires immediate structured improvement program. Common in legacy plants with reactive maintenance culture.
40-60%
Below Average
Typical of plants with mixed maintenance strategy. Reactive failures costing 20-30% of capacity. Strong ROI opportunity with preventive maintenance investment.
60-75%
Industry Average
Most manufacturing operations globally sit in this band. Moving from 65% to 75% OEE on a $20M revenue line adds ~$2M in output without capital investment.
75-85%
Good Performance
Consistent preventive maintenance, documented procedures, and real-time monitoring in place. Competitive advantage in cost-per-unit against regional peers.
85%+
World Class
Achieved by fewer than 15% of manufacturing facilities globally. Requires automated KPI tracking, predictive maintenance triggers, and zero-tolerance for reactive repairs.
90%+
Elite Operations
Reserved for TPM-mature operations with full IoT sensor coverage, CMMS-integrated production data, and dedicated continuous improvement teams.
Industry Pain Points: Why KPI Tracking Fails Without the Right System
Spreadsheet Lag Kills Decisions
65% of plants calculate MTBF manually. By the time a spreadsheet is updated, the asset has already failed twice more. Manual tracking means KPIs reflect last month, not this shift.
Siloed Data Across Sites
Multi-site operations with separate tracking systems cannot compare OEE across facilities. Portfolio managers fly blind on which plant is underperforming and why.
No Link Between PM and Reliability
Without automatic MTBF calculation, teams cannot see whether preventive maintenance is actually improving reliability. PM efforts go unvalidated and budgets get cut.
OEE Measured Weekly Instead of Live
A weekly OEE report tells you what happened, not what to do now. Plants with weekly reporting average 9 hours more unplanned downtime per week than those with live dashboards.
MTTR Inflated by Parts Delays
47% of extended repair time is attributable to parts unavailability — not technician capability. Without parts tracking integrated with work orders, MTTR improvement stalls at diagnosis.
Leadership Reporting Takes Days
VPs and directors need KPI summaries for board decks and investor reporting. Manually compiling MTBF, MTTR, and OEE data across departments consumes 8-12 hours of analyst time per report.
Reactive vs. Planned Maintenance — The Numbers That Matter
Reactive Maintenance
MTBF Trend
Declining — failures accelerate as assets degrade without intervention
MTTR Impact
High — no parts buffer, no documented SOPs, wrong technician dispatched
OEE Result
40-60% — availability losses dominate, performance suffers after each unplanned stop
Repair Cost
4.8x higher than planned maintenance — emergency premium on parts, labor, and vendor fees
KPI Visibility
None until failure — managers learn about problems from the shift supervisor, not the data
Budget Predictability
Zero — maintenance costs swing 40-80% between months depending on failure frequency
Planned Preventive Maintenance
MTBF Trend
Increasing — scheduled interventions catch degradation before it becomes failure
MTTR Impact
40% lower — parts staged, procedures documented, right technician pre-assigned
OEE Result
70-85% — availability stabilizes, performance improves as equipment runs in calibrated condition
Repair Cost
Baseline — predictable labor and parts costs with no emergency premiums
KPI Visibility
Real-time — MTBF, MTTR, OEE updated automatically after every work order close
Budget Predictability
High — rolling 12-month maintenance spend forecasts accurate to plus or minus 8%
How Oxmaint Tracks MTBF, MTTR, and OEE — Automatically
MTBF Dashboard
Live Reliability Trending Per Asset
Every work order closed in Oxmaint automatically updates MTBF for that asset. See 30, 90, and 365-day trending. Spot declining reliability before it becomes failure. Set MTBF floor alerts that notify maintenance managers when an asset drops below target.
MTTR Tracking
Repair Time Captured at Every Stage
Oxmaint timestamps work order creation, technician dispatch, work start, parts issued, and work order close. MTTR auto-calculates from real timestamps — not self-reported estimates. Identify exactly where repair time is being lost.
OEE Dashboards
Availability, Performance, Quality — Per Line
Connect production data via IoT integration or manual production logs. Oxmaint calculates OEE at the individual line level and rolls up to site and portfolio. Maintenance downtime automatically feeds Availability.
PM Scheduling
Trigger Maintenance Before MTBF Threshold
Set PM triggers based on runtime hours, production cycles, or calendar intervals. When an asset approaches its MTBF threshold, Oxmaint schedules the PM automatically — preventing the failure rather than responding to it.
Multi-Site Reporting
Portfolio KPIs for VPs and Directors
Compare MTBF, MTTR, and OEE across all facilities in a single dashboard. Identify the worst-performing assets across your portfolio. Generate investor-grade KPI reports in one click.
Mobile Execution
Technicians Log Everything From the Floor
Work orders on mobile. Parts lookup on mobile. Time tracking on mobile. When technicians capture data in real time — not at shift end from memory — MTBF and MTTR accuracy improves by 60%.
What Happens When You Automate KPI Tracking
23%
OEE improvement
average reported by facilities switching from manual to automated KPI tracking within 12 months
40%
MTTR reduction
achieved by facilities with staged parts, documented SOPs, and automatic technician dispatch via CMMS
31%
fewer unplanned failures
when PM scheduling is triggered from MTBF thresholds instead of fixed calendar intervals
12hrs
saved per report
analyst time eliminated per KPI reporting cycle when dashboards replace manual spreadsheet consolidation
MTBF vs MTTR — How They Work Together
MTBF and MTTR answer different questions — but the decision that drives maintenance strategy sits at their intersection. Understanding both together determines your asset availability and your true cost of downtime.
High MTBF + Low MTTR
Optimal
Equipment runs long between failures and recovers quickly when it does fail. Availability stays above 95%. This is the target state for every critical asset.
High MTBF + High MTTR
Manageable
Equipment is reliable but repairs take long when failures occur. Focus on reducing repair time: parts staging, SOPs, technician training.
Low MTBF + Low MTTR
Costly
Equipment fails often but recovers quickly. Labor costs are high even if downtime per incident is short. Address the root cause of frequent failures.
Low MTBF + High MTTR
Critical
Equipment fails frequently and takes long to repair. Availability collapses. OEE tanks. This triggers capital replacement conversations.
Asset Availability Formula (combines MTBF and MTTR)
Availability = MTBF / (MTBF + MTTR)
Example: MTBF 400h + MTTR 4h = 400 / 404 = 99% Availability
Your MTBF and MTTR data is already being generated by your maintenance team — it is just not being captured automatically. Start a free trial and let Oxmaint calculate both metrics from your next work order forward, or book a demo to see the KPI dashboard configured to your asset types.
Frequently Asked Questions
It depends on the asset type and industry. For packaging lines in food and beverage, world-class MTBF is 400+ hours. For automotive robotics, 600+ hours. For refrigeration compressors in cold chain, 2,000+ hours. The more important metric is your MTBF trend — if it is declining month over month, the asset is degrading regardless of absolute number. A CMMS tracks MTBF trending automatically so you catch the decline before it becomes failure.
MTTR measures repair duration — how long it takes to fix an asset after failure. MTBR (Mean Time Between Repairs) measures how long between repair events, including both planned and unplanned maintenance. MTBF specifically excludes planned maintenance downtime and counts only unplanned failures. For operational decisions, MTTR is more actionable — it shows you where repair time is being lost. For reliability decisions, MTBF is the indicator of asset health.
Most OEE improvement comes from eliminating the six big losses — not from capital investment. First, reduce changeover time (improving Performance) using SMED methodology for 30-50% reduction. Second, eliminate unplanned downtime (improving Availability) by shifting from reactive to preventive maintenance. Third, reduce startup quality rejects by standardizing setup procedures. Fourth, track minor stops — stops under 10 minutes often account for 15-25% of lost performance but go unrecorded in manual systems.
A modern CMMS like Oxmaint calculates all three automatically from work order data. MTBF updates every time a corrective work order closes. MTTR auto-calculates from work order open and close timestamps. OEE requires production data input — either via IoT sensor integration (automated) or shift log entry (semi-automated). The key is that technicians log work orders from mobile devices in real time, not batch-enter paperwork at shift end.
Oxmaint CMMS · KPI Automation
Stop Calculating KPIs in Spreadsheets. Track MTBF, MTTR, and OEE Automatically.
Oxmaint updates your reliability metrics in real time from every work order your team closes. Live MTBF trending per asset. MTTR calculated from actual timestamps. OEE rolled up from maintenance and production data — across every site in your portfolio. No manual calculation. No data lag. No guesswork on which assets need attention before they fail.