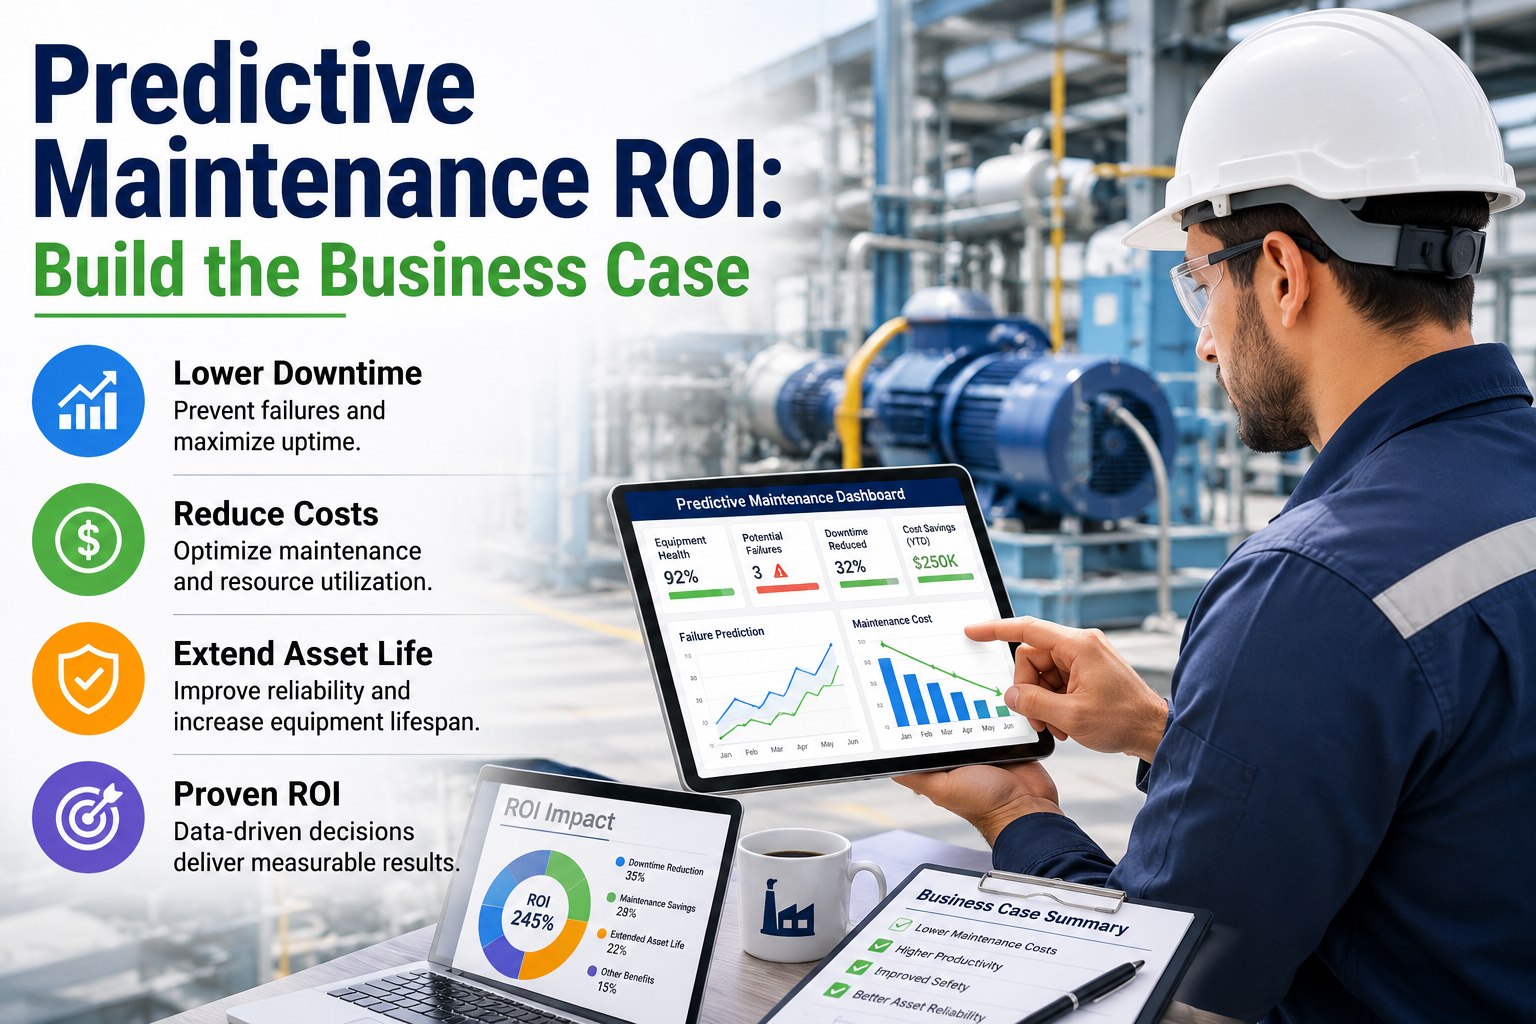
Predictive maintenance ROI in manufacturing consistently delivers 40–60% downtime reduction on properly monitored assets, yet many reliability leaders struggle to translate that potential into a defensible PdM business case that wins budget approval. The challenge isn't the technology — it's quantifying downtime avoided, labor saved, and asset life extended in a way that finance teams and plant managers can validate. A well-structured maintenance ROI calculation ties condition-monitoring data to hard dollar savings, spare-parts inventory reduction, and OEE gains, turning abstract reliability goals into boardroom-ready numbers. OxMaint's AI-powered CMMS gives you the asset criticality framework, cost-avoidance modeling, and predictive analytics foundation needed to document and sustain that ROI. Start Free Trial to see how quickly you can build your numbers.
PREDICTIVE MAINTENANCE ROI
Turn PdM Justification Into a Budget-Ready Business Case
Manufacturing plants that build defensible predictive maintenance business cases see 40–60% downtime reduction on monitored assets — but only when the numbers hold up to finance scrutiny. OxMaint gives you the data, formulas, and asset-selection framework to prove PdM ROI before you spend a dollar on sensors.
THE COST OF REACTIVE MAINTENANCE
Why Your Maintenance Status Quo Is Bleeding Margin
Most manufacturing plants still operate 50–70% reactively, and every unplanned outage costs 3–5× more than a scheduled intervention when you factor in overtime labor, expedited parts, scrap, and lost production. A single critical asset failure on a high-throughput line can erase $15K–$50K per hour in lost output — yet the same plant will hesitate to invest $8K–$12K in a CMMS-driven PdM program that could have prevented it. The real cost of inaction compounds: asset life shortens, energy efficiency degrades, safety incidents rise, and reliability engineers spend their days firefighting instead of optimizing. Building a predictive maintenance ROI model forces these hidden costs into the open and gives finance a line-item view of what reactive maintenance truly costs per quarter.
ROI FORMULA FRAMEWORK
How to Calculate Predictive Maintenance ROI — Step by Step
A defensible PdM business case rests on four quantifiable savings streams. Use these formulas to model your baseline and projected scenarios over a 12-month horizon.
Downtime Avoidance Savings
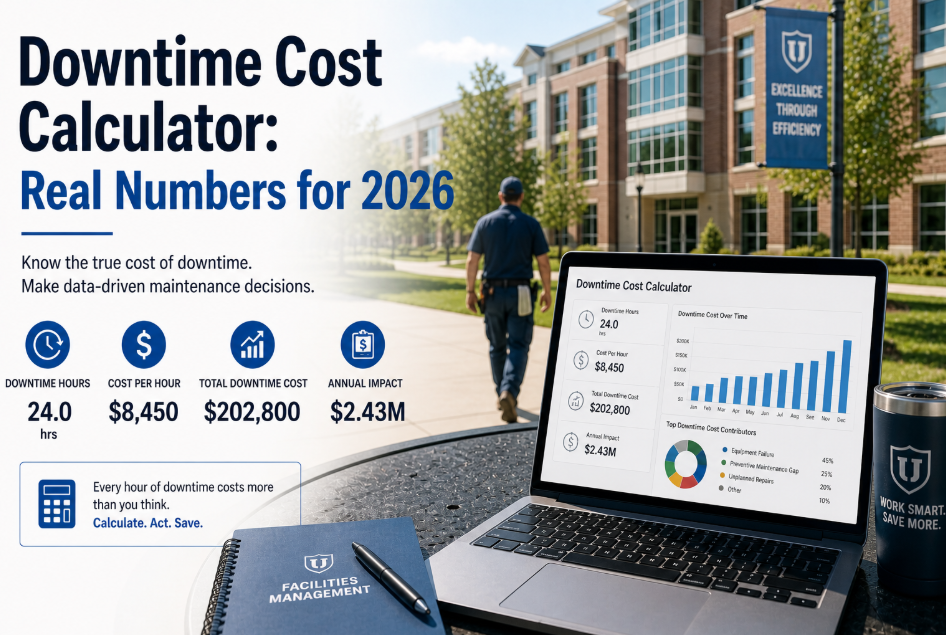
Example: A 180-asset plant averaging 420 unplanned hours/yr at $4,200/hr reduces to 168 hours with PdM → $1,058,400 saved annually.
Labor Efficiency Gains
Planned maintenance takes 50–70% less time than unplanned. Overtime calls drop 40–60% when failures are predicted days in advance.
Asset Life Extension Value
PdM extends bearing, gearbox, and motor life 20–40% by catching early-stage degradation before secondary damage occurs.
Spare Parts Inventory Reduction
Plants using PdM signals to time parts ordering cut spare-parts inventory 15–25% and reduce emergency expedite fees by 60%+.
SAVINGS BREAKDOWN
Where Predictive Maintenance Value Actually Comes From
Industry benchmarks from McKinsey, Deloitte, and the U.S. Department of Energy consistently rank PdM savings streams. Here's how a typical manufacturing plant's cost-benefit breakdown distributes across the four primary value categories.
Unplanned Downtime Reduction
The largest single contributor. Catching bearing vibration, thermal anomalies, or oil degradation 7–21 days before failure converts $50K outage events into $2K planned fixes.
Maintenance Labor Optimization
Fewer emergency call-outs, 50% shorter mean-time-to-repair on planned jobs, and technicians arriving with the right parts and instructions already queued in their mobile CMMS app.
Spare Parts & Inventory
Predictive triggers automate reorder points, cutting safety-stock carrying costs and eliminating rush freight charges that typically add 30–50% to part costs.
Asset Life & Energy Efficiency
Degraded assets draw 5–15% more energy and fail sooner. PdM keeps equipment within spec, deferring capital replacement and lowering utility bills.
PAYBACK TIMELINE
Predictive Maintenance Investment Payback Periods by Asset Class
Not every asset deserves PdM. The fastest ROI comes from high-criticality, high-failure-frequency assets where each outage carries outsized production loss. Use this payback table to prioritize which assets to instrument first in your OxMaint CMMS.
| Asset Class | Avg. Failure Cost/Event | PdM Sensor & Setup Cost | Annual Downtime Savings | Payback Period |
|---|---|---|---|---|
| Critical Production Motors (100hp+) | $18,000–$45,000 | $2,500–$5,000 | $42,000–$110,000 | 3–8 weeks |
| Centrifugal Pumps & Compressors | $12,000–$35,000 | $3,000–$6,500 | $28,000–$72,000 | 4–10 weeks |
| Gearboxes & Reduction Drives | $15,000–$55,000 | $2,000–$4,500 | $30,000–$85,000 | 4–9 weeks |
| HVAC & Chiller Systems | $6,000–$20,000 | $3,500–$7,000 | $12,000–$32,000 | 3–6 months |
| Conveyor & Material Handling | $8,000–$25,000 | $2,800–$5,500 | $18,000–$48,000 | 2–5 months |
| Auxiliary/Support Equipment | $3,000–$10,000 | $4,000–$8,000 | $6,000–$15,000 | 8–14 months |
Prioritize assets where failure cost exceeds $10K/event and failure frequency is ≥2×/year. OxMaint's asset criticality scoring automates this ranking so you deploy PdM sensors where payback is fastest.
WORKED EXAMPLE
A 180-Asset Plant: $42K PdM Investment → $1.2M Annual Savings
A mid-size food processing plant running 180 critical assets spent $42,000 annually on OxMaint CMMS, vibration sensors on 42 high-criticality machines, and reliability engineer time for PdM program management. Within the first 12 months, unplanned downtime dropped from 420 hours to 168 hours, saving $1,058,400 in recovered production. Labor overtime fell 52%, saving $86,000. Emergency parts expedite fees dropped 68%, saving $41,000. Bearing and seal replacements were planned 7–18 days in advance, extending asset life an average of 22% and deferring $95,000 in capital replacement. Total documented savings: $1,280,400 against a $42,000 investment — a 28.5× first-year ROI and a 3.5-week payback period.
HOW OXMAINT HELPS
How OxMaint Builds Your PdM Business Case — and Sustains the ROI
Building the business case is step one. Sustaining predictive maintenance ROI year over year requires a CMMS that connects condition data to work orders, tracks cost avoidance automatically, and gives reliability leaders audit-ready documentation. OxMaint was built for exactly this.
AI-Driven Failure Prediction
OxMaint ingests vibration, temperature, and oil-analysis data, then auto-generates work orders when anomaly thresholds breach — predicting failures 7–21 days out so you convert unplanned outages into planned fixes.
Outcome: 40–60% unplanned downtime reduction on monitored assets.
Automated Cost-Avoidance Tracking
Every PdM-triggered work order logs baseline downtime cost, actual repair cost, and hours saved versus reactive baseline — giving you a running ROI dashboard finance can audit anytime.
Outcome: Real-time ROI documentation, zero manual spreadsheet work.
Asset Criticality Scoring
OxMaint ranks every asset by production impact, failure frequency, and repair cost — so you deploy PdM sensors on the 15–25% of assets that drive 80% of downtime cost, maximizing payback velocity.
Outcome: Faster payback, lower upfront sensor investment.
Predictive Parts Reordering
When OxMaint detects a degrading asset, it checks spare-parts inventory and auto-generates purchase requisitions against lead times — so the right part arrives the day before the planned fix.
Outcome: 15–25% inventory reduction, 60% fewer expedite fees.
See OxMaint Predict Failures on Your Assets — Book a 30-Min Demo
Bring your top 5 critical-asset list. We'll show you exactly how OxMaint would have caught the last 3 failures — and calculate your plant's predictive maintenance ROI in real time.
FREQUENTLY ASKED QUESTIONS
Predictive Maintenance ROI — What Reliability Leaders Ask
What is the typical ROI of a predictive maintenance program?
Properly deployed PdM programs in manufacturing typically deliver 8× to 10× ROI in the first year, driven primarily by 40–60% downtime reduction on monitored assets. Plants spending $30K–$50K annually on PdM tooling and CMMS software commonly document $250K–$1.2M in avoided costs, with payback periods of 3–10 weeks on high-criticality assets. You can validate your own numbers by starting a free OxMaint trial and running the cost-avoidance dashboard against your baseline.
How do I build a predictive maintenance business case for budget approval?
Start by quantifying your current reactive maintenance costs: unplanned downtime hours × production loss rate, overtime labor, expedited parts, and asset replacement acceleration. Then model projected savings across four streams — downtime avoidance, labor efficiency, asset life extension, and inventory reduction — minus PdM program cost. Finance teams approve PdM investments when the payback period is under 12 months and the ROI formula is auditable, not anecdotal.
Which assets should I prioritize for predictive maintenance first?
Prioritize assets where a single failure event costs more than $10,000 in lost production, labor, or scrap, and where failure frequency is two or more times per year. In most plants, 15–25% of assets drive 75–80% of downtime cost — typically critical motors over 100hp, centrifugal pumps, compressors, and gearboxes on high-throughput lines. OxMaint's asset criticality scoring automates this ranking so you deploy sensors where payback is fastest.
How long does it take to see ROI from predictive maintenance?
Most manufacturing plants see documented ROI within 3–6 months of deploying PdM on high-criticality assets. The fastest payback comes from assets with failure costs above $15K/event, where a single prevented outage pays for the entire sensor and CMMS investment. Full program ROI across all monitored assets typically stabilizes at 8–12× annually by month 12, once baseline data is established and prediction models are tuned.
Does predictive maintenance replace preventive maintenance?
No — PdM complements PM, it doesn't replace it. Preventive maintenance handles time-based tasks like lubrication, filter changes, and inspections on fixed intervals, while predictive maintenance uses condition data to trigger interventions only when degradation is detected. The combination typically reduces unnecessary PM tasks by 20–40% while catching failure modes that fixed-interval PM misses, improving overall maintenance ROI. To see how both work together in practice, book a 30-minute OxMaint demo.
Stop Guessing. Start Predicting. Prove Your ROI.
Join manufacturing reliability leaders using OxMaint to cut unplanned downtime 40–60%, extend asset life, and document every dollar saved. Your PdM business case starts with one demo.
Free 14-day trial · No credit card