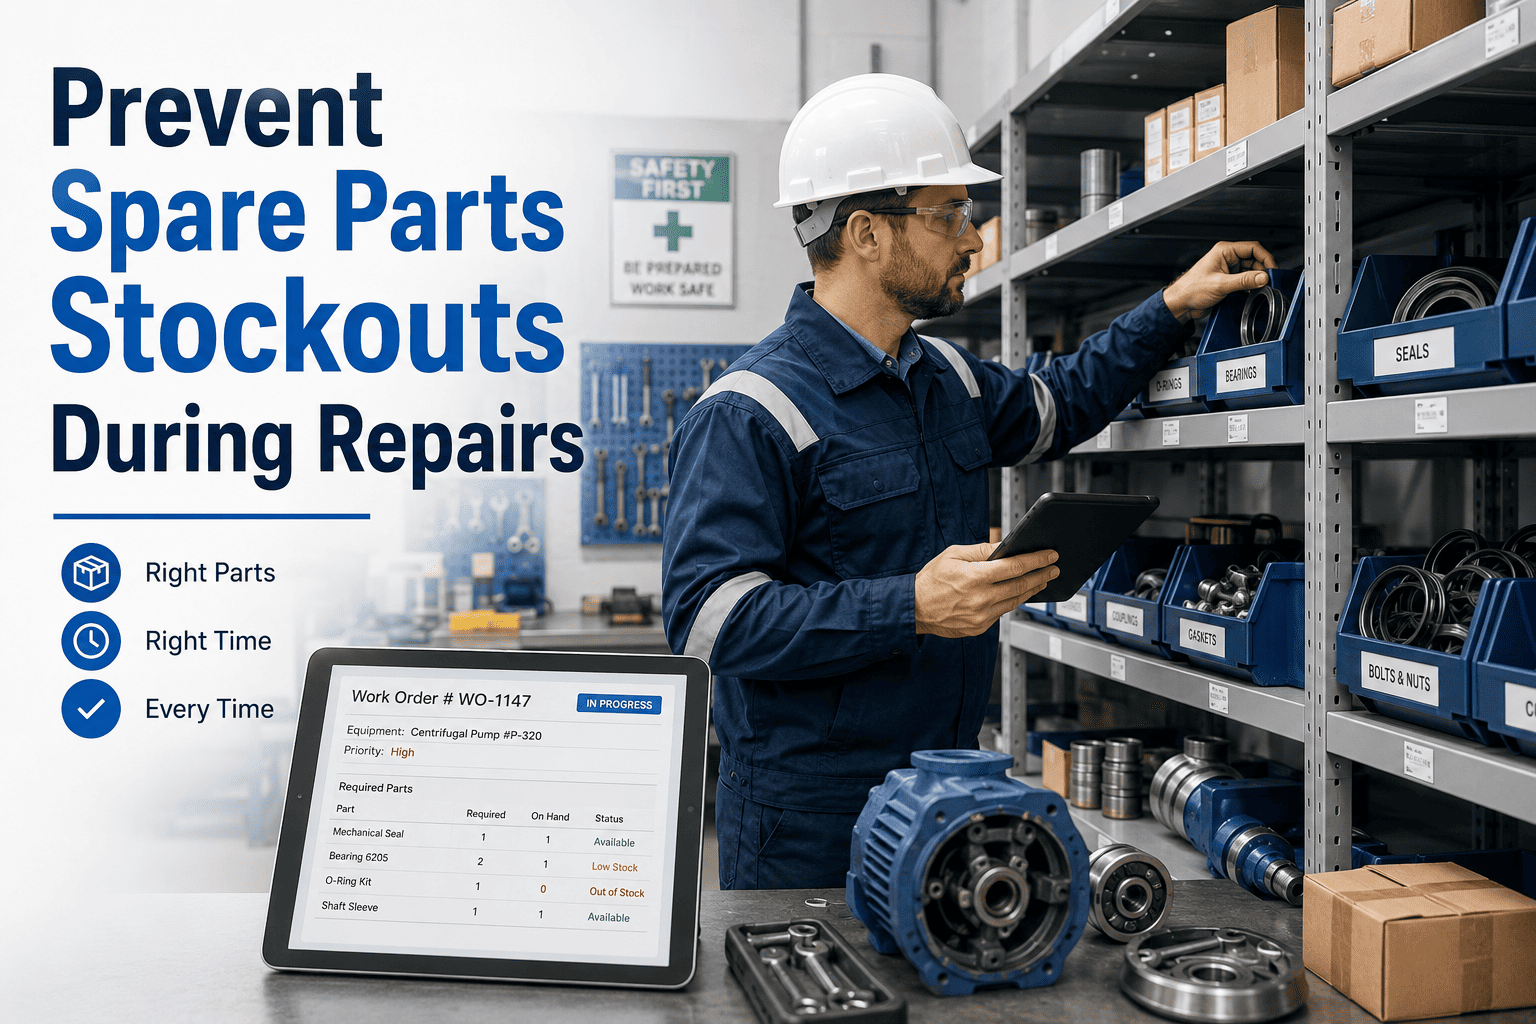
When a critical pump fails at 2 AM and the replacement seal is not in stock, the repair does not take 45 minutes — it takes 3 days. The seal costs $18. The downtime costs whatever your production line generates per hour, multiplied by 72 hours. MRO inventory accounts for 40–50% of total maintenance budgets, yet 15–25% of parts on the shelf are obsolete while the critical items run out precisely when they are needed most. The paradox has one root cause: parts are stocked by gut feel rather than by asset-linked consumption data, criticality scoring, and reorder logic that accounts for actual lead times. Book a demo to see how OxMaint's Parts & Inventory module eliminates stockouts with automated reorder alerts, asset-linked parts lists, and usage trend analysis — or start free today.
Problem-Solution · Parts & Inventory · CMMS
How to Prevent Spare Parts Stockouts During Emergency Repairs
Five proven methods — reorder alerts, parts usage history, asset-linked inventory, criticality classification, and CMMS demand forecasting — that stop the stockout-downtime cycle before the emergency happens.
The Real Cost of a Spare Parts Stockout
Emergency part premium (vs planned)
2–5× unit cost
Expedited freight surcharge
$500–$5,000+
Overtime technician labour
1.5–2× hourly rate
Production downtime per hour
$10K–$2.3M
Planned part on shelf would have cost
Unit price + 20–30% annual carry
Why Stockouts Keep Happening — The 3 Root Causes
01
No asset-to-parts linkage
Parts are stocked in a storeroom with no connection to which assets use them or how often. When a pump bearing fails, the technician discovers whether it is in stock by physically walking the storeroom. No predictive signal. No minimum stock rule. The stockout is the first notification that the stock ran out.
02
Reorder points set by intuition
Minimum stock levels are set by maintenance managers based on experience and never updated. Lead times are estimated, not tracked. A part with a 12-week supplier lead time gets managed identically to one that ships overnight. The reorder point that worked three years ago fails when supplier lead times extend or consumption rates change.
03
Criticality ignored in stock decisions
Parts are stocked by value, not by impact of unavailability. Low-cost consumables are overstocked while expensive critical spares are eliminated from the inventory because they were not used in the last two years — with no consideration that the asset they protect has not needed them because it was still running. Insurance spares exist to prevent the failure that has not happened yet.
5 Methods That Eliminate Spare Parts Stockouts
01
Automated Reorder Alerts — Set Once, Replenish Before Stockout
Set a minimum stock level per part based on average consumption rate and supplier lead time. OxMaint triggers a reorder alert automatically when stock falls below that level — before it reaches zero. The alert goes to the parts manager with quantity-to-order pre-calculated. Demand planning accuracy reduces stockouts by 10% when consumption data drives the reorder point rather than intuition.
Impact: 20–40% fewer emergency purchases when automated reorder replaces manual checking
02
Asset-Linked Parts Lists — Know What Each Machine Needs Before It Fails
Each asset in OxMaint carries a linked parts list — every component that has ever been used in a repair, every part the OEM recommends for PM, and any critical spare that should be on hand given the asset's criticality level. When a technician opens a work order on that asset, the parts list is pre-populated. When a PM is scheduled, the parts are confirmed in stock before the job is assigned. The stockout discovered on-site becomes the stockout prevented in the planning room.
Impact: Eliminates mid-repair parts runs — technicians arrive with confirmed parts, not assumptions
03
Parts Usage History — Let Consumption Data Set the Reorder Point
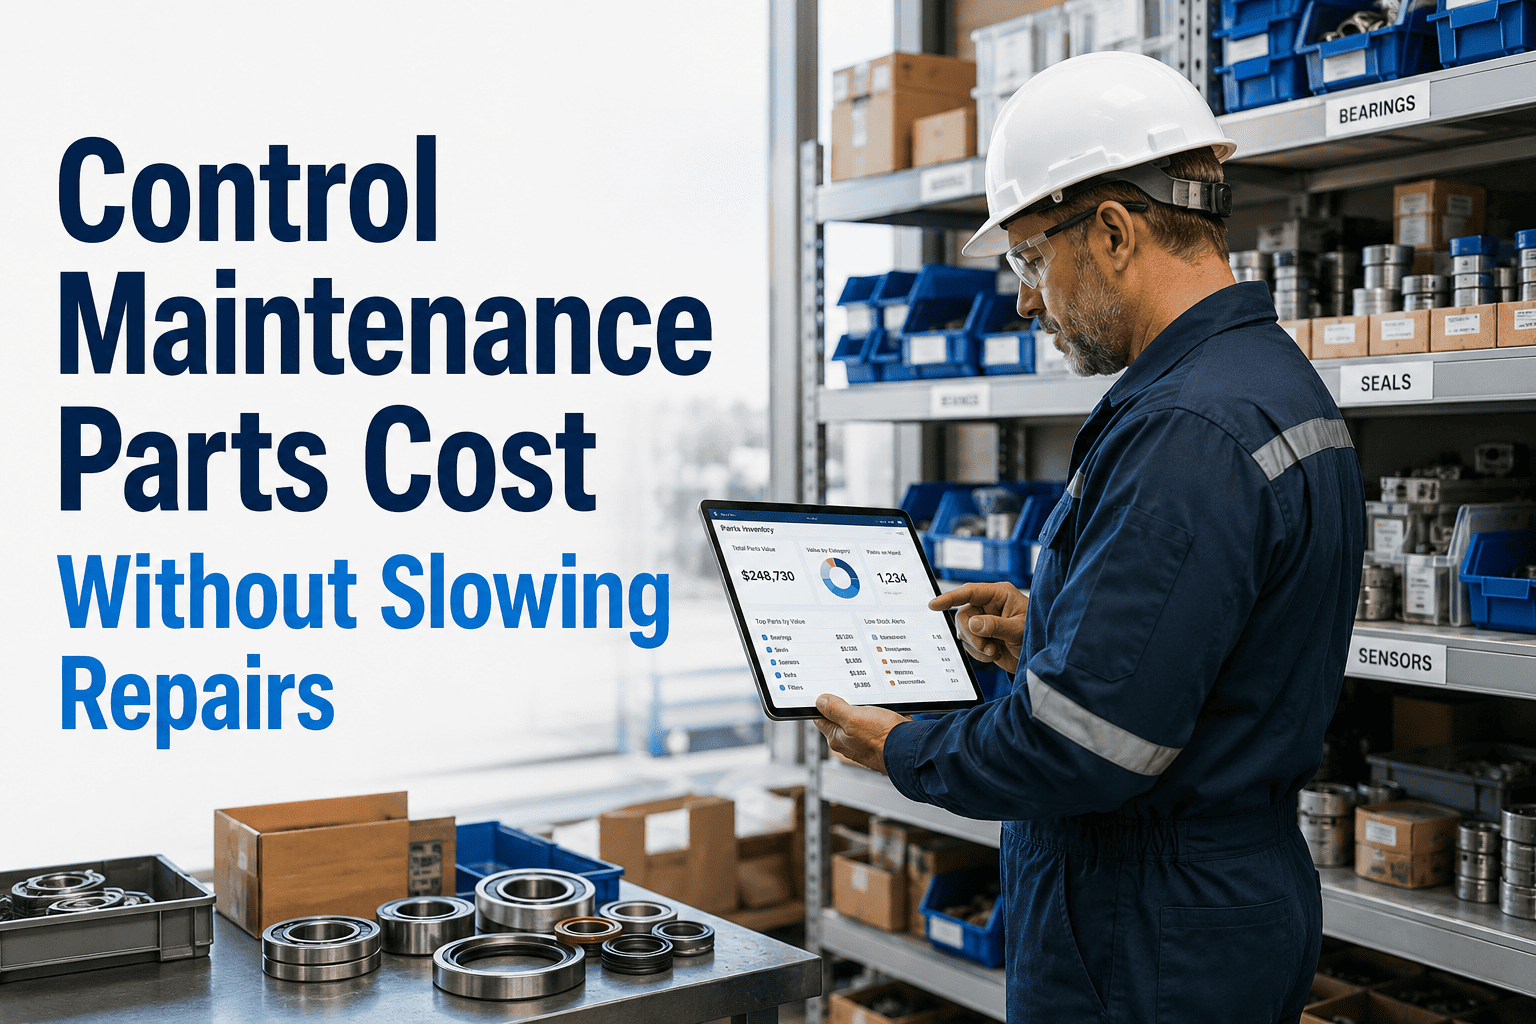
OxMaint tracks every part used in every work order, building a consumption history per part per asset. After 6–12 months of data, average monthly usage rates are calculable per part — and reorder points can be set mathematically rather than by estimation. A part consumed 3 times per month with a 6-week supplier lead time needs a minimum stock of 4–5 units, not the 1 unit that "felt about right" when the reorder was last reviewed.
Impact: BCG data: robust inventory management improves critical spare availability by 15%
04
ABC-VED Criticality Classification — Stock What Matters Most
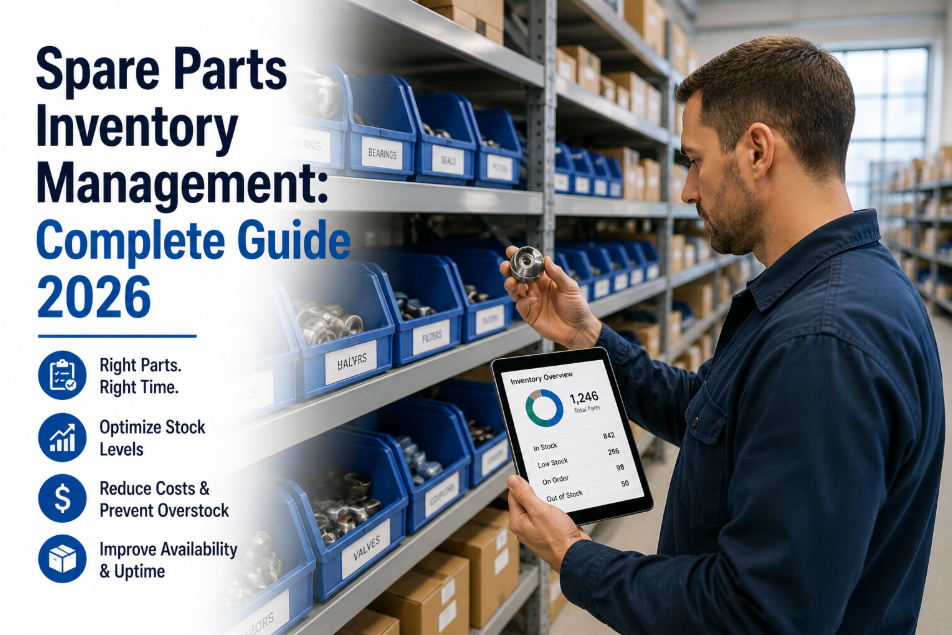
ABC analysis classifies parts by consumption value (A = high value, C = low value). VED analysis classifies by operational criticality (V = vital, E = essential, D = desirable). Critical-but-expensive spares (A-Vital) require guaranteed minimum stock regardless of cost because the downtime cost dwarfs the carrying cost. Low-cost consumables with reliable availability (C-Desirable) can run lean. Without criticality classification, inventory decisions are made on cost alone and the most dangerous stockouts — on vital assets — are the ones that happen most.
Impact: Storerooms stop overflowing with C-parts while V-class spares run out
05
PM-Linked Parts Staging — Reserve Stock Before the Job Starts
When a planned maintenance work order is created in OxMaint for an asset, the required parts are automatically reserved in inventory — reducing available stock for other work orders until this job is completed. The PM arrives with guaranteed parts. No one else draws the last bearing between when the job is scheduled and when it is executed. The kitting report generated for the storeroom tells the stores team exactly which parts to stage and when. Stockouts on planned work — the most preventable category — drop to near zero.
Impact: 86% fewer emergency air-freights when parts are staged rather than assumed available
PARTS & INVENTORY · OXMAINT
Stop Discovering Stockouts When the Machine Is Already Down.
OxMaint Parts & Inventory links every part to every asset, tracks consumption history, sets reorder alerts by criticality, and stages parts for planned work automatically — ending the emergency purchase cycle that costs 2–5× what planned stocking would have.
Parts Inventory KPIs — Are You Measuring What Matters?
| KPI |
How to Measure |
Target |
Warning Signal |
| Stockout frequency |
Work orders delayed due to parts unavailability / total WOs |
< 2% of work orders |
Above 5% = reorder points and criticality classification not working |
| Emergency purchase rate |
Emergency POs / total POs in period |
< 5% of purchases |
Above 15% = reactive inventory management; premium costs compounding |
| Inventory carrying cost |
Annual holding cost / total inventory value |
20–25% of inventory value |
Above 30% = excess stock tied up in low-velocity parts |
| Obsolete stock % |
Parts with zero movement in 24 months / total SKUs |
< 10% of SKUs |
Above 20% = capital tied up in parts that will never be used |
| Critical spare coverage |
Critical assets with all critical spares stocked / total critical assets |
100% coverage |
Below 80% = single point of failure risk across unprotected critical assets |
Expert Review
"The number that changes the conversation in every storeroom I have reviewed is the one that shows production hours lost waiting for parts. When you can show a plant manager that 240 production hours were lost last year waiting for parts that could have been on the shelf for a carrying cost of $35,000, the storeroom stops looking like a cost centre and starts looking like what it actually is: production insurance. The problem is that most plants are not tracking that number. They are tracking inventory value, turnover rate, and stockout frequency — all useful, but incomplete. Emergency purchase frequency and the premium paid above planned purchase cost is the metric that makes the financial case for proper inventory management. A plant losing $200,000 per year in emergency purchase premiums and expedited freight on parts that could have been stocked for $40,000 does not have an inventory problem. It has a measurement problem — and a CMMS that links every emergency purchase to the asset that needed it and the reorder point that should have triggered earlier is the tool that makes that measurement automatic."
Marcus Webb, CMRP, CRL
Certified Maintenance and Reliability Professional (SMRP) · Certified Reliability Leader · 19 years industrial maintenance operations and inventory management · SMRP Best Practices contributor
Frequently Asked Questions
How do you calculate the right reorder point for a spare part?
The correct reorder point formula is:
Reorder Point = (Average Daily Usage × Supplier Lead Time in Days) + Safety Stock. Safety stock covers demand variability and lead time variability — typically 1–2 weeks of average usage for reliable suppliers, higher for unreliable or long-lead parts. OxMaint calculates average daily usage automatically from work order consumption history per part, so reorder points can be set mathematically once 3–6 months of usage data have accumulated.
Book a demo to see automated reorder point calculation in OxMaint.
What is ABC-VED analysis and how does it prevent stockouts?
ABC analysis classifies parts by annual consumption value (A = top 70% of spend, B = next 20%, C = bottom 10%). VED analysis classifies by operational criticality (V = Vital — machine stops without it; E = Essential — serious degradation without it; D = Desirable — convenience, not necessity). Combining both creates a 3×3 matrix that guides stocking decisions: A-Vital parts require minimum guaranteed stock regardless of cost; C-Desirable parts can run lean. This prevents the most common failure mode — overstocking inexpensive C-parts while A-Vital critical spares run out.
Start free to set up ABC-VED classification in OxMaint.
What is the cost difference between a planned spare parts purchase and an emergency purchase?
Emergency spare parts purchases typically cost 2–5× the unit price of the same part bought through normal procurement, plus expedited freight charges of $500–$5,000+, plus the overtime labour premium for technicians working unscheduled shifts. When production downtime is factored in — ranging from $10,000/hour for light manufacturing to $2.3M/hour in automotive — a $50 part stockout routinely generates total incident costs exceeding $100,000. The carrying cost of having the part on the shelf (approximately 20–30% of unit value annually) is orders of magnitude smaller than the cost of not having it.
How does OxMaint prevent stockouts on planned maintenance work?
OxMaint links each asset's PM work order template to a parts list of everything required for that PM. When a PM work order is created and scheduled, the required parts are automatically reserved in inventory — reducing the available quantity visible to other work orders until the PM is completed. This ensures no one draws the last critical component between scheduling and execution. A parts staging report is generated for the storeroom team showing which parts to pick and when. For any part below minimum stock when the PM is scheduled, an automatic reorder is triggered before the job date.
PARTS & INVENTORY · OXMAINT
The $18 Seal That Cost $200,000 Only Happens Once with OxMaint.
OxMaint Parts & Inventory eliminates stockouts with asset-linked parts lists, automated reorder alerts, ABC-VED criticality classification, PM parts staging, and usage trend analysis — so every emergency repair starts with the part already on the shelf.


.png)

.png)
