A state university system managing 14 campuses and over 800 buildings spent $127 million annually on energy—making it their second-largest operating expense after personnel. Energy consumption varied wildly between similar buildings with no clear explanation, and sustainability reports required weeks of manual data compilation that was outdated before completion. After implementing Oxmaint's AI-powered energy monitoring, they reduced campus-wide energy costs by 23% ($29 million annually), identified over 340 equipment anomalies causing waste, and now generate real-time sustainability dashboards that satisfy board reporting requirements and student environmental advocacy groups.
Universities face unique energy management challenges—diverse building portfolios from historic structures to modern research facilities, variable occupancy patterns that shift dramatically between semesters and breaks, ambitious sustainability commitments often made without clear implementation plans, and stakeholder expectations ranging from cost-conscious administrators to climate-focused students. Effective energy management requires visibility that most campuses lack—understanding not just total consumption but which buildings, systems, and behaviors drive that consumption. Schedule a consultation to discuss energy monitoring capabilities for your campus.
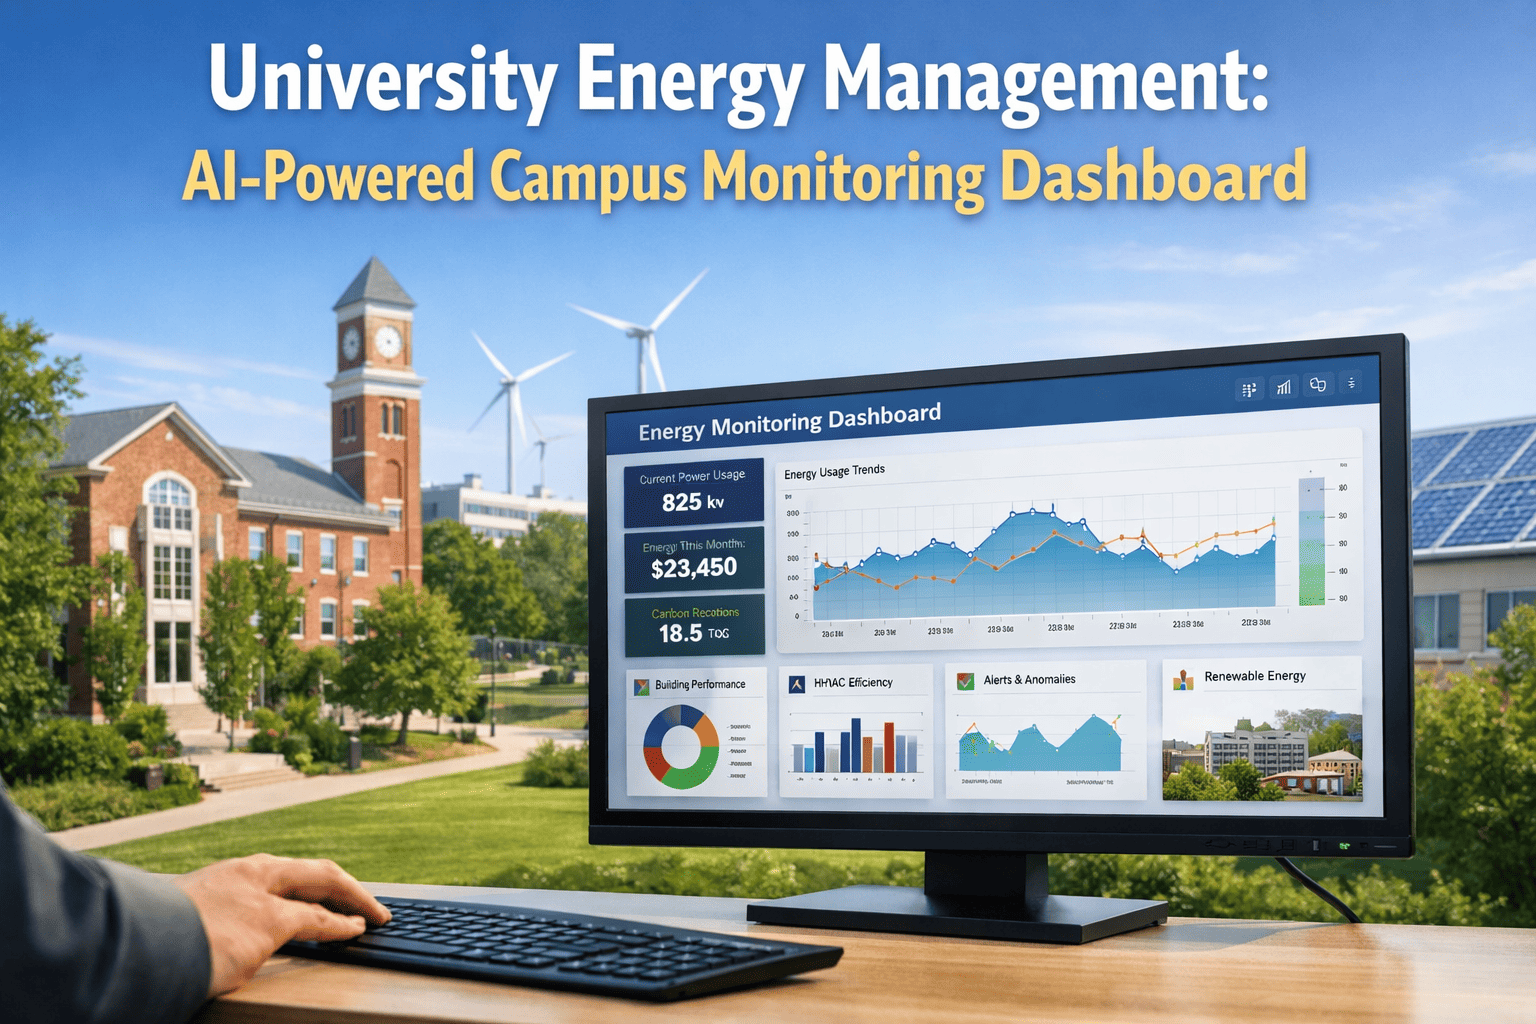
University Energy Management: AI-Powered Campus Monitoring Dashboard
Transform campus energy data into actionable insights through AI-powered monitoring, real-time dashboards, and automated sustainability reporting.
Campus Energy Challenges
Universities face distinct energy management complexities that require specialized solutions.
Building Diversity
Campus portfolios include century-old historic buildings, 1970s brutalist structures, modern LEED-certified facilities, and specialized research labs—each with different systems, efficiency characteristics, and improvement potential.
Variable Occupancy
Consumption patterns shift dramatically—full occupancy during semesters, minimal during breaks, peak loads during registration and finals. Buildings must condition for thousands or for dozens depending on the calendar.
Sustainability Commitments
Institutions pledge carbon neutrality targets, renewable energy percentages, and emissions reductions—but lack the data infrastructure to measure progress, identify improvement opportunities, or report results credibly.
Budget Pressure
Tuition sensitivity and state funding constraints demand cost control, yet deferred maintenance and aging infrastructure drive consumption higher. Energy savings must fund improvements in a self-reinforcing cycle.
AI-Powered Monitoring
Oxmaint's AI analytics transform raw consumption data into actionable energy intelligence.
Anomaly Detection
Machine learning establishes baseline consumption patterns for each building based on weather, occupancy, and time of year. When consumption deviates from expected levels, the system flags anomalies for investigation—catching equipment malfunctions, scheduling errors, and operational issues automatically.
Predictive Modeling
AI forecasts future consumption based on weather predictions, academic calendar, and historical patterns. Facilities teams anticipate demand peaks, optimize utility purchasing strategies, and plan maintenance during optimal consumption windows.
Efficiency Benchmarking
Compare energy intensity across similar buildings—why does Residence Hall A consume 34% more per square foot than similar Hall B? AI identifies factors driving differences and prioritizes improvement opportunities with highest savings potential.
Maintenance Correlation
Link consumption changes to maintenance events. Did the chiller service improve efficiency as expected? When consumption spikes, AI examines recent maintenance history to suggest probable causes—connecting energy waste to fixable equipment problems.
See Your Campus Energy Clearly
Oxmaint's AI-powered dashboards reveal where energy goes across your entire campus—every building, every major system, every hour of the day. Stop guessing which buildings waste energy and start making data-driven decisions that reduce costs while advancing sustainability goals. Most universities identify significant savings opportunities within the first 30 days of monitoring.
Building-Level Analytics
Granular visibility enables targeted intervention where impact is greatest.
Academic Buildings
Track classroom and lecture hall consumption against scheduled occupancy. Identify buildings conditioning empty spaces, running systems after hours unnecessarily, or consuming more than comparable facilities.
Research Facilities
Labs consume 4-8x more energy per square foot than classrooms. Monitor fume hood operation, equipment schedules, and specialized HVAC loads. Identify opportunities to reduce consumption without impacting research.
Residence Halls
Track consumption through academic year versus breaks. Monitor laundry, kitchen, and common area loads. Identify halls with behavioral consumption differences that peer programs or technology could address.
Athletic Facilities
Pools, ice rinks, and fitness centers have high base loads. Track consumption against event schedules and practice hours. Identify efficiency opportunities in natatorium dehumidification, ice plant operations, and field lighting.
Data Centers
Campus computing infrastructure consumes significant power. Monitor PUE (Power Usage Effectiveness), track cooling efficiency, and identify opportunities for load optimization or cooling improvements.
Historic Buildings
Century-old structures present unique challenges—inefficient envelopes, outdated HVAC, preservation constraints. Track performance, identify feasible improvements, and benchmark against similar historic facilities elsewhere.
Sustainability Reporting
Automated reporting satisfies stakeholder requirements without manual data compilation.
Emissions Tracking
Calculate Scope 1, 2, and relevant Scope 3 emissions from monitored energy consumption. Convert electricity, natural gas, and fuel oil consumption to CO2 equivalents using appropriate emissions factors. Track progress against institutional carbon neutrality commitments.
STARS Reporting
Generate data supporting AASHE STARS sustainability ratings. Building energy performance, greenhouse gas emissions, and efficiency investments documented automatically for rating submissions.
Executive Dashboards
Board-ready reports showing energy cost trends, sustainability progress, and efficiency investments. Visualizations communicate complex data clearly to non-technical audiences including trustees and legislators.
Transparency Displays
Real-time building energy displays for lobbies show students and visitors consumption data, reinforcing sustainability commitment and encouraging conservation behavior. Gamification features compare buildings.
Maintenance Integration
Energy data connects to maintenance workflows in Oxmaint for comprehensive facility management.
Automated Alerts
When AI detects consumption anomalies, Oxmaint automatically generates investigation work orders routed to appropriate technicians. Energy waste triggers maintenance response without manual monitoring.
Efficiency Verification
After maintenance, energy data verifies that repairs achieved expected efficiency improvements. Chiller service should reduce consumption—if it doesn't, investigation continues. Maintenance ROI becomes measurable.
PM Scheduling
Energy-intensive equipment receives appropriate preventive maintenance attention. HVAC systems, chillers, and boilers with PM schedules maintain efficiency. Deferred maintenance appears in consumption data.
Capital Planning
Energy data supports equipment replacement decisions. When aging systems consume significantly more than modern alternatives, data justifies capital investment with calculated payback periods.
Connect Energy to Maintenance
Oxmaint uniquely combines energy monitoring with CMMS functionality—energy anomalies automatically trigger maintenance investigation, repair completion verifies efficiency restoration, and long-term trends inform capital planning. Stop treating energy and maintenance as separate domains when they're fundamentally connected.
Implementation Approach
Campus energy monitoring deployment follows a phased approach.
Meter Assessment
Inventory existing meters, identify buildings with sub-metering, and determine data collection capabilities. Many campuses have more metering infrastructure than they realize—the data simply isn't being collected or analyzed systematically.
Data Integration
Connect utility data feeds, building automation systems, and smart meters to Oxmaint. Establish automated data collection that updates dashboards continuously without manual intervention.
Baseline Development
AI learns consumption patterns across your campus—establishing baselines that account for weather, occupancy, and building characteristics. Initial anomaly detection begins identifying obvious waste immediately.
Full Deployment
Dashboards, reports, and maintenance integration fully operational. Staff trained on interpretation and response. Sustainability reporting automated. Continuous improvement processes established.
Frequently Asked Questions
Lead Campus Sustainability
Universities shaping the next generation of leaders should model sustainability in their own operations. Oxmaint's AI-powered energy monitoring provides the visibility, analytics, and reporting that transforms good intentions into measurable progress. Join campuses across North America already achieving significant energy savings while advancing carbon neutrality goals and demonstrating environmental responsibility to students, faculty, and communities.