Onshore turbines logged a 97.4% availability rate in 2023 — about two points higher than the offshore fleet — because the maintenance strategy behind each is fundamentally different. Offshore access depends on crew-transfer vessels, jack-up lifts, and weather windows that can stretch a 4-hour onshore job into a 14-day campaign. OxMaint brings both worlds into one CMMS: turbine-specific PM libraries, gearbox condition-monitoring feeds, marine logistics coordination, and campaign planning that keeps blades turning regardless of where they sit. Operators running 50+ assets typically cut unplanned downtime by 18–25% in the first year. Start Free Trial to model your fleet's maintenance economics today.
Wind O&M Strategy
Same rotor. Two completely different maintenance models.
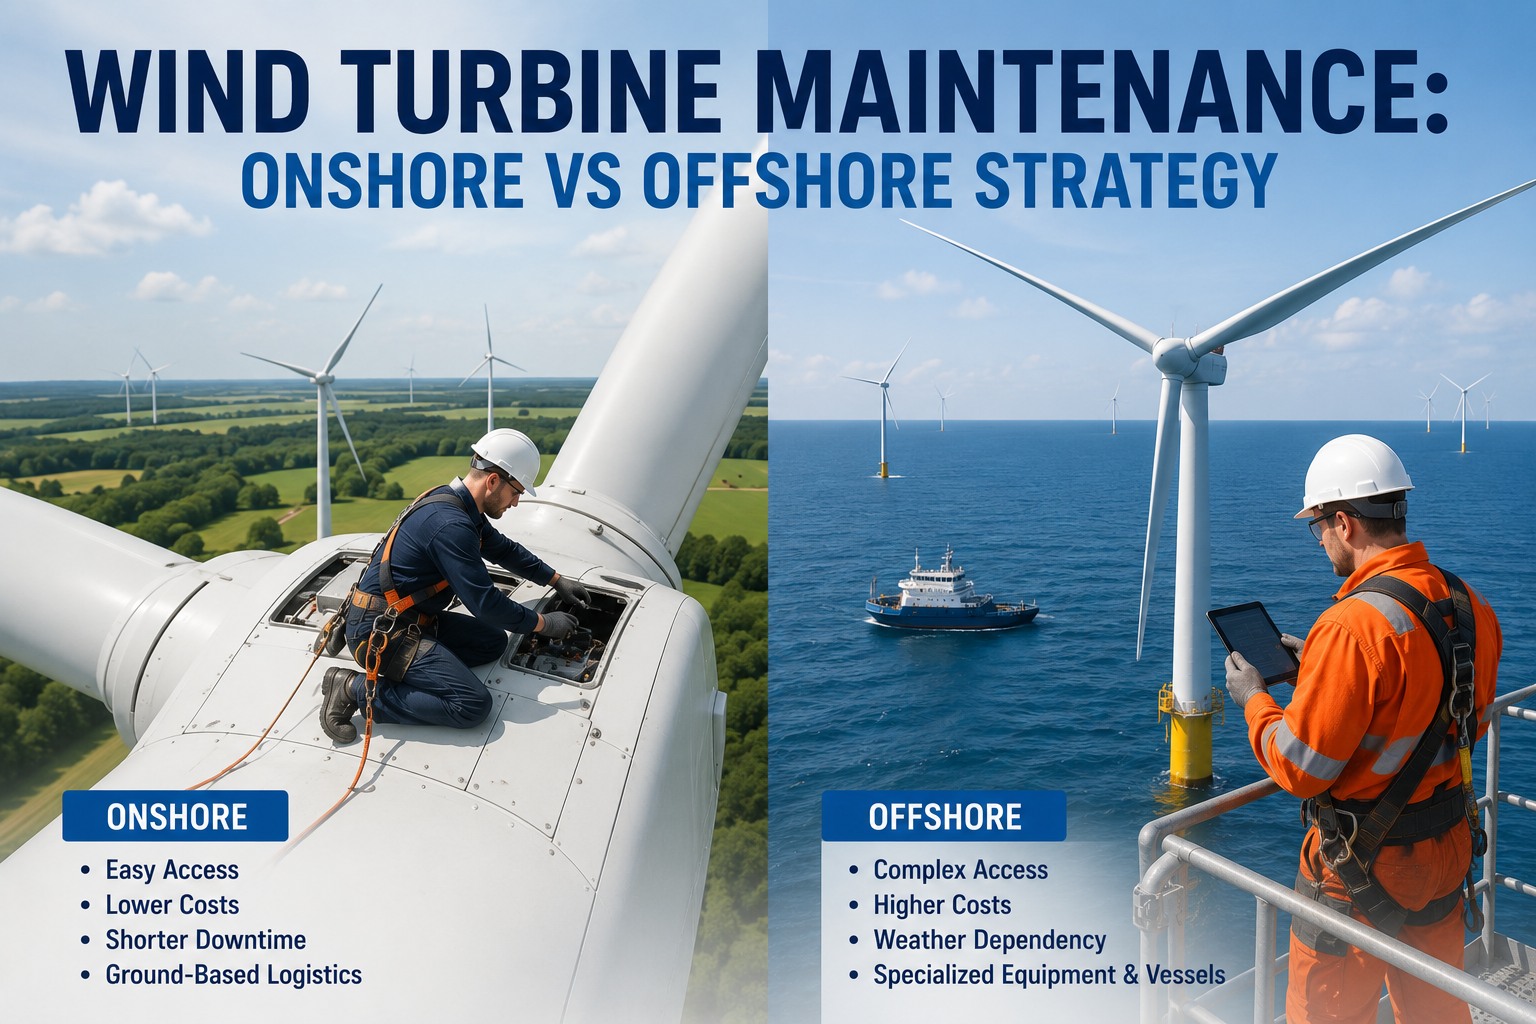
A 4-hour gearbox inspection onshore can become a 3-day offshore campaign once you factor in vessel mobilisation, transfer windows, and HSE permits. The strategy that protects your capacity factor must reflect that gap — and so must the software running it.
- 2–4 hour site access by road
- $1.2K–$3.5K per minor intervention
- Weather downtime ~8% of scheduled hours
- Crane mobilisation: 1–3 days lead
- 6–14 hour access via CTV / SOV / jack-up
- $15K–$80K per intervention day at sea
- Weather downtime 25–40% of campaign
- Jack-up vessel lead time: 4–12 weeks
Reliability Hotspots
Where wind-turbine downtime actually begins
Three subsystems account for roughly 70% of unplanned capacity loss across modern fleets. Each one fails differently onshore versus offshore — and each one rewards a different monitoring cadence.
~17% of total fleet downtime despite representing under 10% of failure events. Bearing race spalling and gear pitting develop over 6–18 months; vibration and oil-particle trends catch 80% of catastrophic failures when sampled monthly.
Lightning strikes, leading-edge erosion, and pitch-bearing wear drive 12–15% of downtime. Drone-based thermography now detects delamination at $400 per blade versus $4,200 for rope-access inspection.
Dfig and PMSG winding faults plus IGBT degradation account for 9–11% of lost MWh. Thermal trending at 10-minute SCADA resolution flags stator overheating 4–6 weeks before trip.
Side-by-Side
Onshore vs offshore: the operational gap
The table below maps eight maintenance dimensions across a representative 4 MW class turbine. Numbers reflect 2023–2024 fleet benchmarks from operators in the North Sea, US Great Plains, and German Bight.
| Maintenance Dimension | Onshore (4 MW class) | Offshore (4 MW class) | OxMaint Lift |
|---|---|---|---|
| Access method | Service truck, internal climb | CTV / SOV / jack-up vessel | Marine coordination module |
| Annual O&M cost / MW | $28K – $42K | $95K – $140K | 18–25% reduction in Year 1 |
| Planned : unplanned ratio | 78 : 22 | 68 : 32 | Shift to 85 : 15 |
| Mean time to mobilise | 4 – 8 hours | 36 – 96 hours | Campaign pre-staging alerts |
| Weather downtime | ~8% of scheduled hours | 25 – 40% of campaign | Weather-window forecasting |
| Inspection tooling | Rope access, ground optics | Drone, ROV, sensorised blade | Drone-report ingestion API |
| CMS data frequency | 10-min SCADA + monthly oil | 1-min vibration + weekly oil | Edge-stream condition rules |
| Spare-parts strategy | Regional warehouse, 24-hr | Vessel-staged, 5–21 day | Criticality-based kitting |
Condition Monitoring
The gearbox formula that justifies remote everything
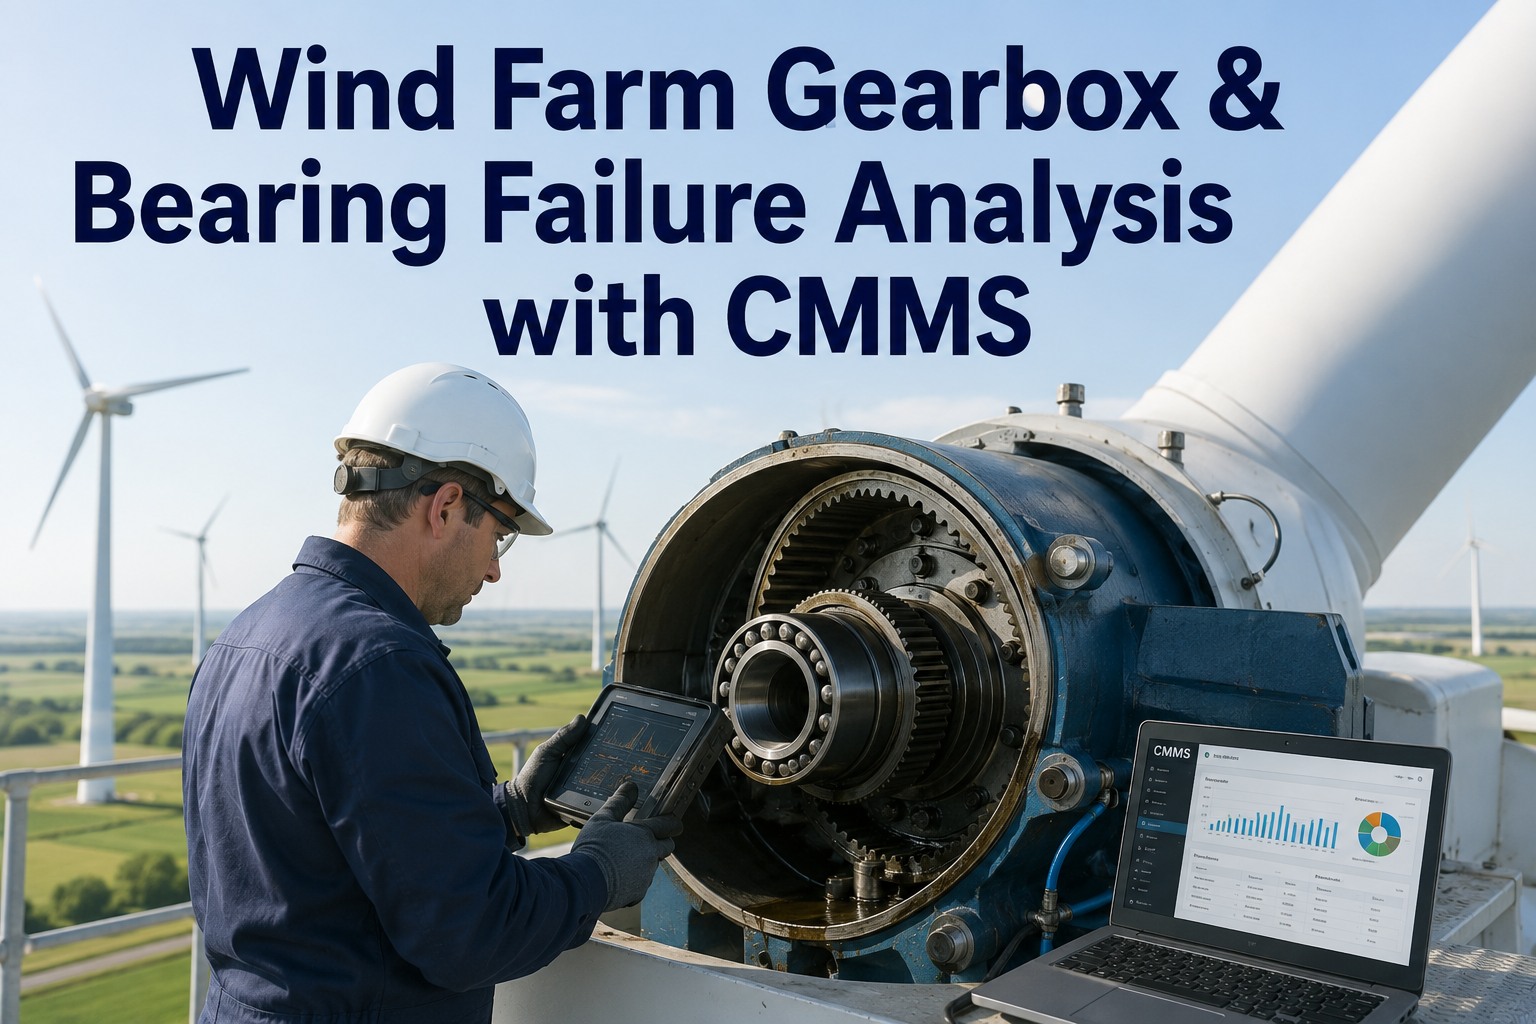
Gearbox replacement is the single most expensive wind-turbine event — $300K–$600K onshore, $1.2M–$2.4M offshore once the jack-up is included. Catching bearing degradation 90 days early typically converts a replacement into a repair. The math below shows why CMS investment pays back inside one avoided event.
A 320 MW offshore operator using OxMaint campaign planning consolidated 11 separate vessel mobilisations into 4 multi-turbine campaigns in 2024 — saving an estimated $3.8M in jack-up charter and recovering 142 hours of capacity-factor window.
Campaign Planning
The 12-month offshore campaign calendar
Offshore maintenance is run as campaigns, not work orders. The timeline below shows how a mature operator sequences inspections, vessel bookings, and CMS-driven interventions across a representative 200 MW site.
Vibration and oil trends flagged 14 turbines with deviation; 6 escalated to Q2 campaign. Spare gears and bearings pre-ordered against 12-week supplier lead times.
OxMaint pulls 30-day metocean forecasts and matches Hs < 1.5 m windows against work-list criticality. Jack-up vessel locked for 9-day slot in June.
Drone thermography across all 50 turbines in 6 days; 23 findings ingested via API, 4 critical added to June jack-up scope.
Jack-up completes 6 gearbox repairs, 4 blade-leading-edge patches, 2 pitch-bearing swaps in 9 days — 22% under budgeted vessel hours.
Onshore fleet runs 14 independent interventions on a rolling truck schedule; offshore shifts to remote CMS-only monitoring through storm season.
The Real Cost
What 1% of capacity factor is actually worth
A 200 MW offshore farm at $90/MWh PPA loses roughly $1.58M per year for every 1% of capacity factor lost to unplanned downtime. Onshore, the same 1% costs ~$490K. These numbers are why condition-monitoring and campaign-planning software is no longer optional.
A 360 MW operator spending $11.4M/yr on O&M deployed OxMaint in April 2023. Twelve months later: unplanned downtime fell from 2.8% to 1.9% of available hours, gearbox-related events dropped 31%, and crane mobilisations were cut from 22 to 9 by stacking work. Net savings: $2.1M — a 4.1-month payback on the software and process change combined.
See your fleet's maintenance economics in one dashboard
Import turbine PM libraries, CMS feeds, and vessel schedules — then model onshore and offshore campaigns side by side.
FAQ
Wind-turbine maintenance, answered
Three drivers stack: vessel charter ($25K–$120K/day for a jack-up), weather downtime eating 25–40% of campaign hours, and longer mobilisation lead times that force you to stage parts and crew far earlier. OxMaint's campaign module helps compress that cost by batching work across turbines and locking in weather windows before chartering.
Yes — if it was built for it. OxMaint uses a shared asset hierarchy and PM library so a 2 MW onshore unit and a 14 MW offshore unit share the same failure-code taxonomy, parts master, and reporting layer. The difference is in the access-planning layer, which only activates for offshore assets. Start Free Trial to see the dual-mode setup in under 30 minutes.
We support SCADA polling at 10-minute resolution, vibration-CMS edge streams at 1-minute, and oil-lab results via CSV/API. Threshold rules fire work orders automatically when deviation exceeds your configured baseline — for example, a +8°C stator-temperature delta triggers a generator inspection ticket with the last 30 days of trend attached.
Across 40+ wind deployments the median payback is 4.2 months. The fastest paybacks come from offshore operators that consolidate vessel mobilisations; the slowest come from small onshore fleets (<20 turbines) where the savings base is thinner. A worked example is included above.
Yes. The reporting layer ships with IEC 61400-26-1 availability and production-loss templates, plus ISO 55000 asset-management register exports. Custom KPIs (energy-based availability, sector-based lost-production analysis) can be configured without code. Book a Demo to walk through the reporting pack with our team.
Get Started
Run both fleets on one platform built for wind
Turbine PM libraries, gearbox CMS rules, marine coordination, and campaign planning — all in OxMaint.
Free 14-day trial · No credit card