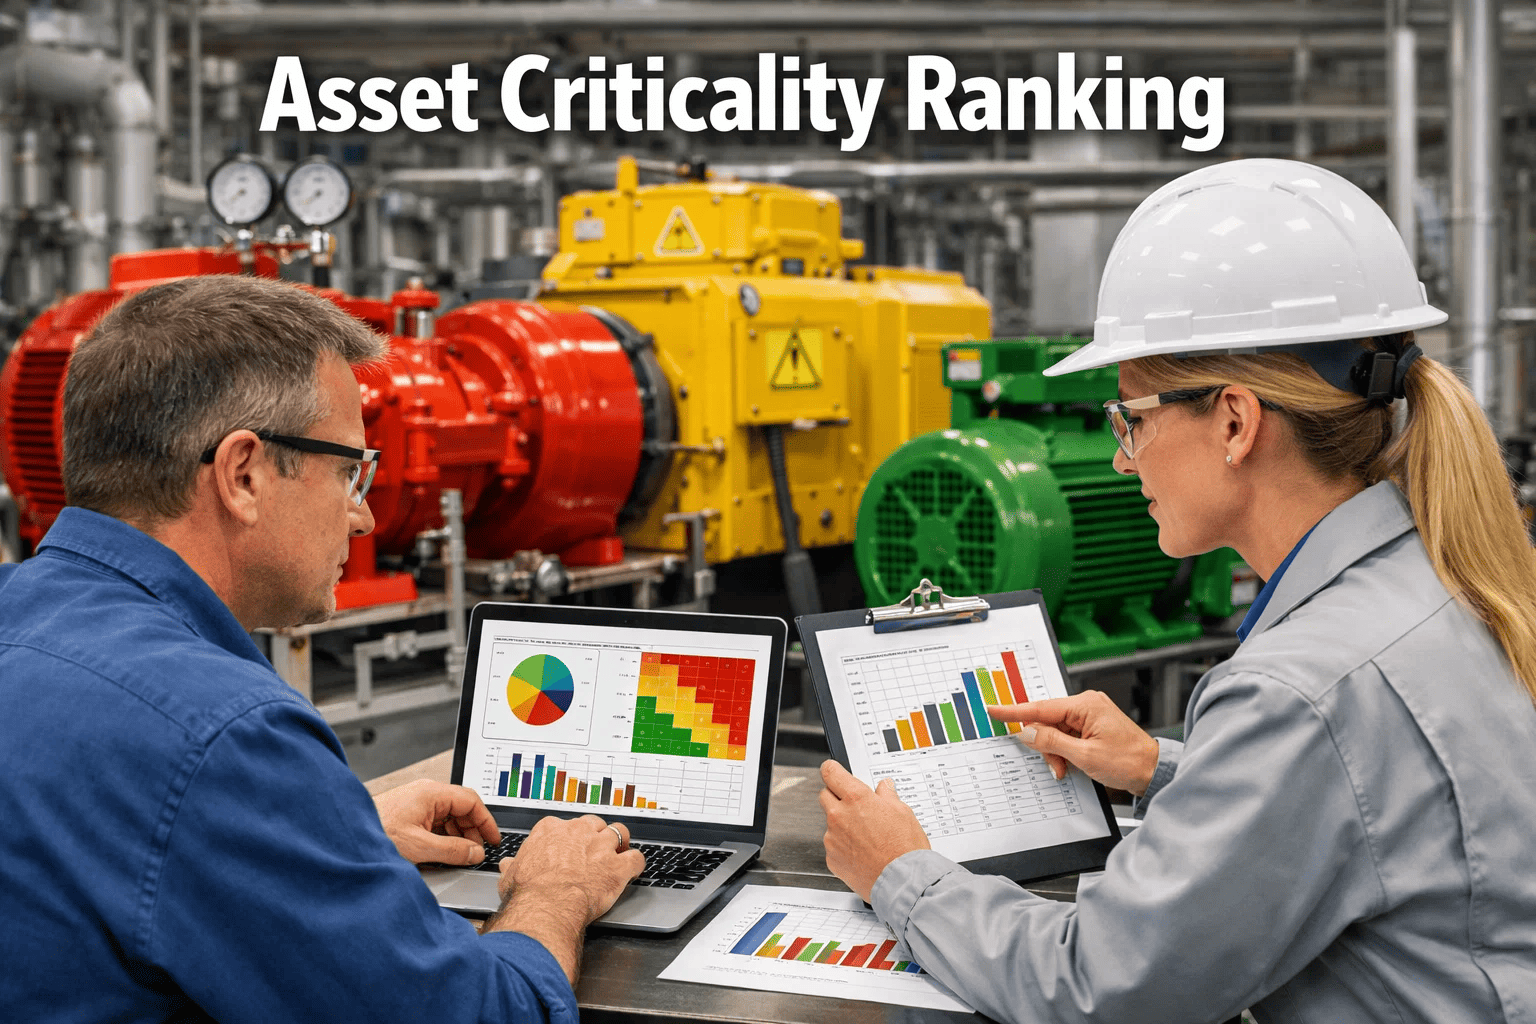
Criticality analysis for conveyor systems ranks each asset by the consequence of its failure — production loss, safety risk, environmental impact, and repair cost — so reliability teams can direct limited maintenance hours where they matter most. A structured conveyor systems risk assessment moves you from reactive firefighting to a defensible RCM strategy: the top 20% of assets typically drive 80% of unplanned downtime, and criticality ranking is how you find them. This guide walks through a proven scoring model, a risk matrix you can copy, and the maintenance-strategy selection logic that ties it all together. Build it once in OxMaint and every work order, PM trigger, and spare-parts reservation inherits the right priority — or Start Free Trial to see it live on your asset hierarchy today.
Which conveyor failure shuts down your plant next week?
Conveyor systems criticality ranking quantifies the consequence of failure for every belt, roller, and gearbox — so you engineer out the risks that matter instead of servicing assets that don't. Score once, defend always, and cut unplanned downtime by up to 40%.
How to build a conveyor systems consequence analysis that holds up in any audit
Criticality is not a gut feeling — it is a weighted score across four consequence dimensions. Assign each conveyor asset a 1–5 rating in every category, multiply by the weight, and sum. The resulting score feeds directly into your conveyor systems priority scoring and determines which maintenance strategy each asset deserves.
Does a failure endanger operators near nip points, transfer towers, or loading zones? A guard bypass or belt snap at a high-tonnage conveyor can cause LTI or fatality — score 5 automatically.
Tons per hour lost while the conveyor is down. A main haul belt feeding a ship loader may cost $18K–$90K per hour; a redundant return roll costs nearly zero. Use actual bottleneck throughput.
Parts, labour, crane time, and specialty contractor hours. A 1,200 mm belt splice on a mile-long overland conveyor can run $25K plus 48 hours of downtime — a worn idler is $40 and 20 minutes.
Spillage, dust emission exceedances, MSHA / OSHA citations, or EPA reportable events. Conveyors carrying hazardous or regulated material carry inherently higher consequence scores.
Conveyor systems risk matrix: mapping consequence against failure probability
Scoring consequence is only half the picture. Your conveyor systems risk assessment must cross-reference consequence with the probability of failure — based on asset age, operating hours, failure history, and condition-monitoring data. The resulting 5×5 matrix assigns every asset to a tier that drives your maintenance-strategy selection.
| Consequence → | 1 — Negligible | 2 — Minor | 3 — Moderate | 4 — Major | 5 — Severe |
|---|---|---|---|---|---|
| 5 — Almost Certain | Tier 3 | Tier 2 | Tier 1 | Tier 1 | Tier 1 |
| 4 — Likely | Tier 3 | Tier 2 | Tier 2 | Tier 1 | Tier 1 |
| 3 — Possible | Tier 4 | Tier 3 | Tier 2 | Tier 2 | Tier 1 |
| 2 — Unlikely | Tier 4 | Tier 4 | Tier 3 | Tier 2 | Tier 2 |
| 1 — Rare | Tier 4 | Tier 4 | Tier 4 | Tier 3 | Tier 2 |
Conveyor systems tier ranking to maintenance strategy selection
Once every conveyor asset lands in a tier, the maintenance strategy is largely determined. This is where conveyor systems maintenance priority becomes actionable — each tier maps to a specific mix of monitoring, PMs, and spare-parts strategy that balances reliability against maintenance cost.
Vibration sensors on gearbox bearings, belt-speed and temperature telemetry, oil analysis quarterly, and a documented bypass or redundant conveyor path. Target MTBF > 8,000 hours. Example: a 72-inch main haul belt feeding a process plant with no alternate route — Tier 1 by definition.
Lubrication routes every 30 days, belt-tension checks weekly, roller and idler inspections bi-weekly, thermography on drive motors quarterly. Trigger condition-based work orders when sensor thresholds breach. Spare critical belts and bearings in storeroom.
Monthly visual inspections, quarterly bearing lubrication, annual alignment check. Standard parts kept in inventory but no condition monitoring investment. Acceptable risk: a failure causes a brief, recoverable slowdown — not a plant stoppage.
Reclaim, feed, and transfer conveyors on redundant circuits where a backup path exists. Fix on failure, keep a replacement belt or motor on the shelf, and spend zero PM labour. The math: if annual PM cost exceeds the cost of one downtime event, run it to failure.
A 180-conveyor plant ranks its assets and reallocates 3,200 PM hours
A bulk-materials handler operating 180 conveyor segments across three sites was spending $42K annually on uniform preventive maintenance for every belt — critical or not. After running a conveyor systems criticality ranking exercise, the reliability team redistributed maintenance hours based on tier and captured the savings in the first quarter.
"We stopped greasing 60 low-criticality conveyors on a fixed schedule and redirected that labour to vibration analysis on our 12 Tier 1 belts. Unplanned downtime dropped 37% in two months — the criticality ranking paid for itself before the first quarter closed."
— Reliability Lead, bulk-handling operation (180 conveyor segments)
How OxMaint turns criticality ranking into an automated maintenance strategy
Criticality analysis in a spreadsheet is a snapshot — it decays the day you finish it. OxMaint makes conveyor systems asset priority a living property of every work order, PM trigger, and spare-parts reservation so your RCM program scales without administrative drag.
Model every belt, drive, gearbox, and idler in a parent-child hierarchy. The criticality score lives on the asset record and flows to every child component — so a Tier 1 belt's rollers inherit priority automatically.
Generate preventive and predictive work orders based on runtime hours, calendar intervals, or sensor thresholds — automatically routed by tier. Tier 1 gets condition-based triggers; Tier 4 gets nothing until it fails.
Tier 1 belts, bearings, and gearboxes get automatic min-max stocking rules and reservation locks. When a critical asset's work order opens, OxMaint checks inventory and flags shortages before the technician arrives — not after.
Dashboard tiles track MTBF, MTTR, unplanned downtime, and PM compliance — filterable by criticality tier. Show your plant manager exactly how Tier 1 PdM investment is cutting downtime and how Tier 4 run-to-failure is saving labour.
See your conveyor criticality scores mapped to maintenance strategy in 30 minutes
Book a live demo and we'll load a sample conveyor hierarchy, apply the weighted scoring model, and show you how PM triggers and spare-parts rules change by tier — on your assets, not a sandbox.
Conveyor systems criticality ranking — your questions answered
What is criticality analysis for conveyor systems?
Criticality analysis for conveyor systems is a structured method of ranking each conveyor asset by the consequence of its failure — weighted across safety, production impact, repair cost, and environmental risk. The output is a numeric score (typically 1.0–5.0) that places every belt, drive, and component into a priority tier. That tier then determines whether the asset receives predictive maintenance, scheduled PMs, or run-to-failure treatment. You can build and automate this scoring model inside OxMaint so it stays current as assets are added or modified.
How often should conveyor criticality rankings be reviewed?
Review conveyor systems criticality rankings at least once per year, and immediately after any significant change — a new conveyor installation, a process redesign, a change in material throughput, or a major failure event. Quarterly reviews are recommended for Tier 1 assets in high-throughput operations. OxMaint lets you set review reminders on the asset record so no ranking goes stale.
What is the difference between criticality and failure mode analysis (FMEA)?
Criticality analysis ranks assets by the overall consequence of failure — it tells you which conveyors matter most. FMEA goes deeper, identifying specific failure modes (belt splice failure, bearing seizure, gearbox oil leakage) and scoring each by severity, occurrence, and detectability. Criticality ranking comes first and determines which assets warrant the time investment of a full FMEA. OxMaint links failure-mode libraries to asset records so both analyses feed the same work-order strategy.
How many consequence categories should I use in a conveyor risk assessment?
Four categories cover most operations: safety, production impact, repair cost, and environmental/compliance. Some facilities add a fifth — regulatory or contractual penalty — if they operate under enforceable delivery commitments. Keep it to four or five; more than that dilutes the scoring and makes the matrix hard to defend in an audit. Weight safety and production highest (typically 30% each) because those drive the largest financial and human consequences.
Can I run criticality-based maintenance without dedicated CMMS software?
You can build the initial scoring model in a spreadsheet, but maintaining it manually is unsustainable — asset hierarchies change, failure data accumulates, and PM triggers need to adjust automatically. A CMMS like OxMaint embeds the criticality score on the asset record, auto-generates tier-based PMs, reserves spare parts by priority, and produces reports that prove the program is reducing downtime. To see how it works on a real conveyor hierarchy, Book a Demo with our team.
Stop servicing every conveyor equally — rank by consequence and cut downtime 30–50%
OxMaint turns your criticality ranking into automated PM triggers, spare-parts rules, and compliance-ready reports. Start a free trial or book a 30-minute demo and we'll map it to your conveyor assets live.
Free 14-day trial · No credit card