Smart meters maintenance teams rely on are no longer just utility billing tools — they are real-time windows into machine health, energy waste, and equipment degradation that most facilities are leaving completely dark. When integrated with a CMMS, smart meter data turns abstract kilowatt readings into actionable maintenance triggers that cut both utility costs and unplanned failures.
See how Oxmaint connects smart meter data to predictive maintenance work orders — in 30 minutes.
✓ Real-time machine energy consumption monitoring
✓ AI-triggered work orders on energy anomalies
✓ Equipment efficiency scoring across all assets
Trusted by 1,000+ maintenance teams across 9 industries · Live in days, not months
20–30%
Energy wasted in facilities with poorly maintained equipment
U.S. Department of Energy
62%
Reduction in unplanned downtime with AI-driven maintenance
Oxmaint client outcomes
10–25%
Maintenance cost reduction from predictive programs
McKinsey & Company
80%
Less inspection time with AI-driven equipment monitoring
Oxmaint AI Vision
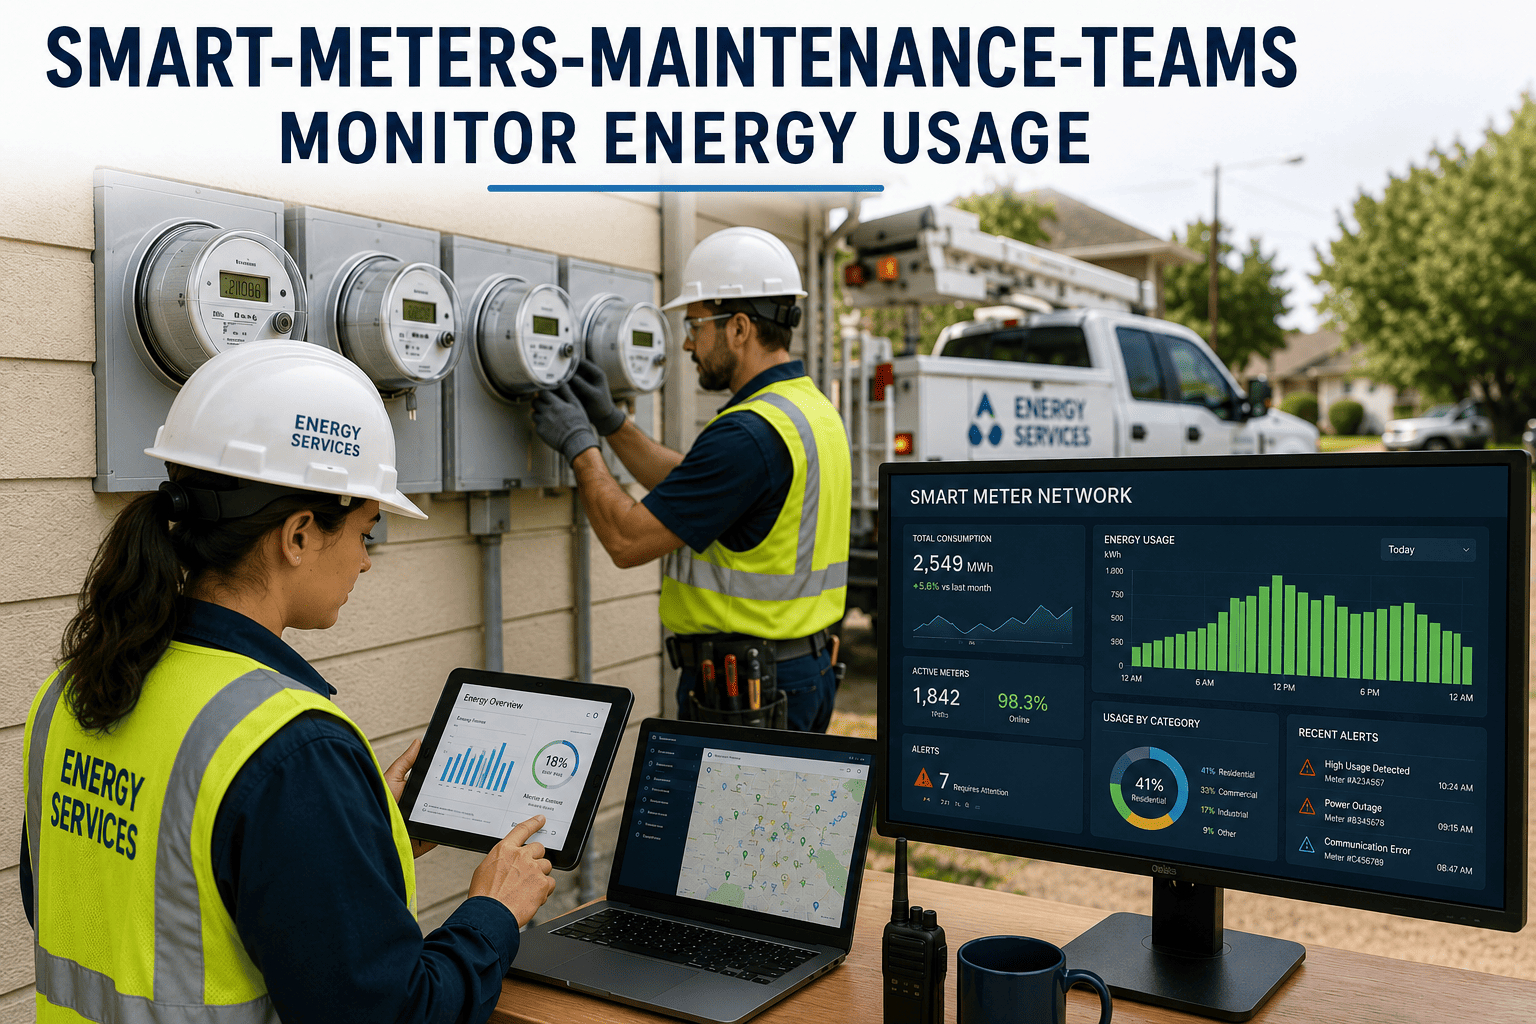
What Is Smart Meter Monitoring for Maintenance
Smart meters in maintenance: what they actually tell you
Smart meters for maintenance teams are IoT-connected energy measurement devices installed at individual machines, panels, or circuits that stream real-time power consumption data into a central platform. Unlike facility-level utility meters, machine-level smart meters show exactly which asset is drawing how much power, when, and under what load conditions — making energy anomalies immediately visible as potential mechanical faults.
A motor drawing 15% more current than its baseline is not an energy problem. It is an early warning sign of bearing wear, misalignment, or a blocked filter. Smart meter data gives maintenance teams a non-invasive, continuous condition signal without adding sensors to every moving part. When that signal feeds into a predictive maintenance workflow, the kilowatt spike becomes a work order before the failure happens.
The shift from facility-level energy management to machine-level energy monitoring is what separates teams that use smart meters for billing from teams that use them to drive maintenance decisions. The former saves on utility invoices. The latter prevents the $50,000 emergency repair that the invoice never warned you was coming — start a free trial to see how Oxmaint maps energy signals to your asset register, or book a demo and we'll walk through your facility's highest-consumption assets first.
Key Concepts in Energy Monitoring
Eight things every maintenance team needs to understand about machine energy data
01
Baseline energy profiling
Every machine has a normal power draw under normal load. Establishing that baseline is the first step — without it, any deviation is meaningless noise rather than a signal.
02
Load vs. no-load current draw
Healthy motors draw predictably different current under load versus idle. Abnormal idle draw often indicates motor insulation degradation or drive issues before any mechanical symptom appears.
03
Power factor monitoring
Poor power factor increases reactive energy costs and stresses electrical components. Tracking power factor per machine pinpoints candidates for capacitor banks and identifies failing motor windings early.
04
Harmonic distortion detection
Variable frequency drives, aging motors, and failing capacitors all introduce harmonics into the power supply. Smart meters with harmonic analysis flag electrical faults weeks before a blown fuse or tripped breaker.
05
Runtime vs. energy intensity
An asset running the same hours but consuming more energy is doing more mechanical work per cycle, which means wear is accelerating. Energy intensity is a hidden leading indicator of remaining useful life.
06
Thermal and electrical correlation
Combining smart meter current data with infrared temperature readings creates a powerful dual signal. Current spikes paired with heat buildup confirm a failing component more reliably than either reading alone.
07
Peak demand management
Maintenance decisions directly affect utility demand charges. Scheduling high-draw equipment maintenance during off-peak windows reduces demand peaks, which can account for 30–50% of a facility's energy bill.
08
Energy-based PM triggers
Calendar-based PM schedules miss the actual machine condition. Energy thresholds — set as percentage deviations from baseline — trigger maintenance based on what the asset is actually telling you, not when it last appeared on a calendar.
Most facilities waste 20–30% of energy budget maintaining equipment that is already degrading invisibly — and never connect the utility bill to the maintenance backlog.
Industry Pain Points
Four energy monitoring problems maintenance teams report most often
No machine-level energy visibility
Facility-level utility meters show total consumption but hide which specific machines are drawing abnormally. Teams cannot link a utility spike to a mechanical cause until after a failure has already occurred and the damage is done.
Energy data siloed from maintenance records
Energy dashboards live in the building management system. Maintenance records live in the CMMS. Neither system talks to the other, so a motor that has been drawing high current for 30 days still gets a routine PM rather than a corrective inspection.
Reactive repairs disguised as energy costs
A compressor failure that costs $80,000 in parts and labor almost always announced itself as a gradual energy increase over 6–8 weeks. Without machine-level monitoring, that pre-failure window closes every single time, and the utility bill absorbs the signal that maintenance never saw.
Compliance audits lack energy audit trails
ISO 50001 and OSHA requirements increasingly ask for documented evidence of energy monitoring and corrective action. Teams that cannot produce machine-level energy records alongside maintenance logs face audit findings that calendar-based PM records alone cannot resolve.
If any of these feel familiar, the fix starts with connecting energy data to your asset register — explore Oxmaint asset management to see how that connection works in practice.
How Oxmaint Solves It
How Oxmaint connects smart meter data to maintenance action
1
IoT energy meter integration at the asset level
Oxmaint connects directly to IoT smart meters and PLC feeds, tagging energy readings to individual assets in the asset register. Every machine gets its own energy profile, visible alongside its maintenance history and open work orders in a single screen. Explore
predictive maintenance capabilities.
2
AI-triggered work orders on energy threshold breaches
Set percentage-deviation thresholds from baseline. When a motor crosses that line, Oxmaint's AI automatically generates a
work order, assigns it to the nearest certified technician, and logs the energy reading as the trigger evidence — no manual monitoring required.
3
Energy efficiency scoring across the asset portfolio
Oxmaint ranks assets by energy efficiency relative to their class and operating age. High-cost, low-efficiency machines surface automatically in the dashboard, giving operations leaders the data to justify capital replacement decisions before a catastrophic failure forces the issue.
4
Energy data in compliance and audit reporting
Every energy anomaly, the work order it triggered, and the technician response is stored as a timestamped, tamper-evident record.
Analytics and reporting exports ISO 50001 and OSHA-ready documentation in minutes, not days of manual preparation.
5
Peak demand scheduling integration
Oxmaint's PM scheduler reads energy load data to automatically suggest off-peak maintenance windows for high-draw equipment. Facilities running this feature report measurable reductions in utility demand charges without any manual scheduling intervention.
6
Mobile energy alerts for field technicians
When an energy anomaly triggers a work order, the assigned technician receives the alert on their mobile device with the asset's full energy history, recent maintenance log, and recommended inspection steps — context that cuts diagnostic time significantly on the first visit.
A motor drawing 15% above its energy baseline for three weeks is not an energy bill problem. It is a $40,000 repair announcement that most CMMS platforms never translate into a work order.
Before vs. After: Energy Monitoring Integration
What changes when energy data connects to maintenance
| Area |
Without Smart Meter Integration |
With Oxmaint Energy Monitoring |
| Energy visibility |
Facility-level meter only; no machine-level data |
Per-asset real-time consumption with baseline deviation alerts |
| Fault detection |
Discovered at failure or scheduled PM date |
Detected weeks early via energy anomaly threshold breach |
| Work order generation |
Manual creation after a complaint or visual inspection |
AI auto-generates WO on energy trigger, assigns to nearest tech |
| PM scheduling basis |
Calendar intervals from OEM manual, applied universally |
Condition-based triggers using actual energy consumption data |
| Compliance documentation |
Manual compilation, takes days per audit cycle |
Automated export with energy readings, WO links, timestamps |
| Energy cost visibility |
Monthly utility bill; no asset-level attribution |
Cost-per-machine breakdown, efficiency ranking, trend reports |
| Capital replacement decisions |
Based on age or after catastrophic failure |
Data-driven scoring: energy cost vs. replacement cost per asset |
| Technician dispatch |
Scheduled round or reactive emergency call |
AI-routed to nearest certified tech with full energy context |
ROI and Results
What Oxmaint clients report after connecting energy to maintenance
62%
Less unplanned downtime
Across manufacturing and facility clients using Oxmaint predictive monitoring
94%
AI prediction accuracy
For equipment failures flagged by IoT sensor and energy data analysis
25%
Typical energy cost reduction
In facilities that shift from reactive to condition-based maintenance scheduling
80%
Fewer manual inspection hours
When AI vision and energy monitoring replace scheduled walkaround inspections
Calculate what these numbers mean for your specific facility at the Oxmaint ROI calculator, or book a demo and we'll run the numbers live for your asset count and energy profile.
Frequently Asked Questions
Smart meters for maintenance teams: common questions answered
How do smart meters help reduce equipment maintenance costs?
Smart meters reduce equipment maintenance costs by exposing the energy signature of mechanical degradation before it becomes a failure. A motor bearing wearing out draws progressively more current weeks before it seizes. By catching that energy deviation early, maintenance teams replace a $200 bearing on a planned schedule instead of a $15,000 motor on an emergency call. Facilities that connect energy data to condition-based PM triggers typically see 10–25% maintenance cost reductions within the first year.
Can smart meters integrate with a CMMS to automatically create work orders?
Yes. Oxmaint connects IoT smart meters and PLC sensor feeds directly to the asset register. When a machine's energy reading crosses a configurable threshold above its established baseline, the platform automatically generates a work order, classifies its priority, and routes it to the appropriate technician. No manual monitoring or alert review is required — the connection between the energy signal and the maintenance response is fully automated.
What is the difference between smart meters for energy management and smart meters for maintenance?
Energy management smart meters are typically installed at the facility or circuit level and focus on billing, demand management, and sustainability reporting. Maintenance smart meters are installed at individual machine level and focus on detecting equipment health changes through energy consumption patterns. The key difference is granularity and purpose: one tells you your total bill, the other tells you which motor is about to fail. Oxmaint uses machine-level metering specifically to drive maintenance decisions, not just energy cost tracking.
What types of equipment benefit most from smart meter energy monitoring?
Rotating equipment shows the clearest energy-fault correlation — motors, compressors, pumps, fans, and conveyors all exhibit measurable current increases as bearings wear, alignments shift, or filters block. HVAC systems, refrigeration units, and hydraulic systems are also strong candidates. Generally, any equipment with a stable operating load profile and a significant repair cost justifies machine-level energy monitoring. Oxmaint clients typically start with their top 20% highest-criticality assets and expand from there.
Stop Paying for Failures That Energy Data Would Have Prevented
Smart meter maintenance monitoring: connect energy to action today
Every day your smart meter data stays siloed from your maintenance records is another day a degrading motor announces its failure on a utility invoice instead of a work order. Oxmaint connects machine-level energy readings to predictive maintenance workflows so your team responds to signals, not breakdowns.
✓ Machine-level energy monitoring integrated with your asset register
✓ AI auto-generates work orders on energy anomaly detection
✓ Compliance-ready audit trails with energy readings and WO evidence
Trusted by 1,000+ teams managing critical assets · Live in days, not months