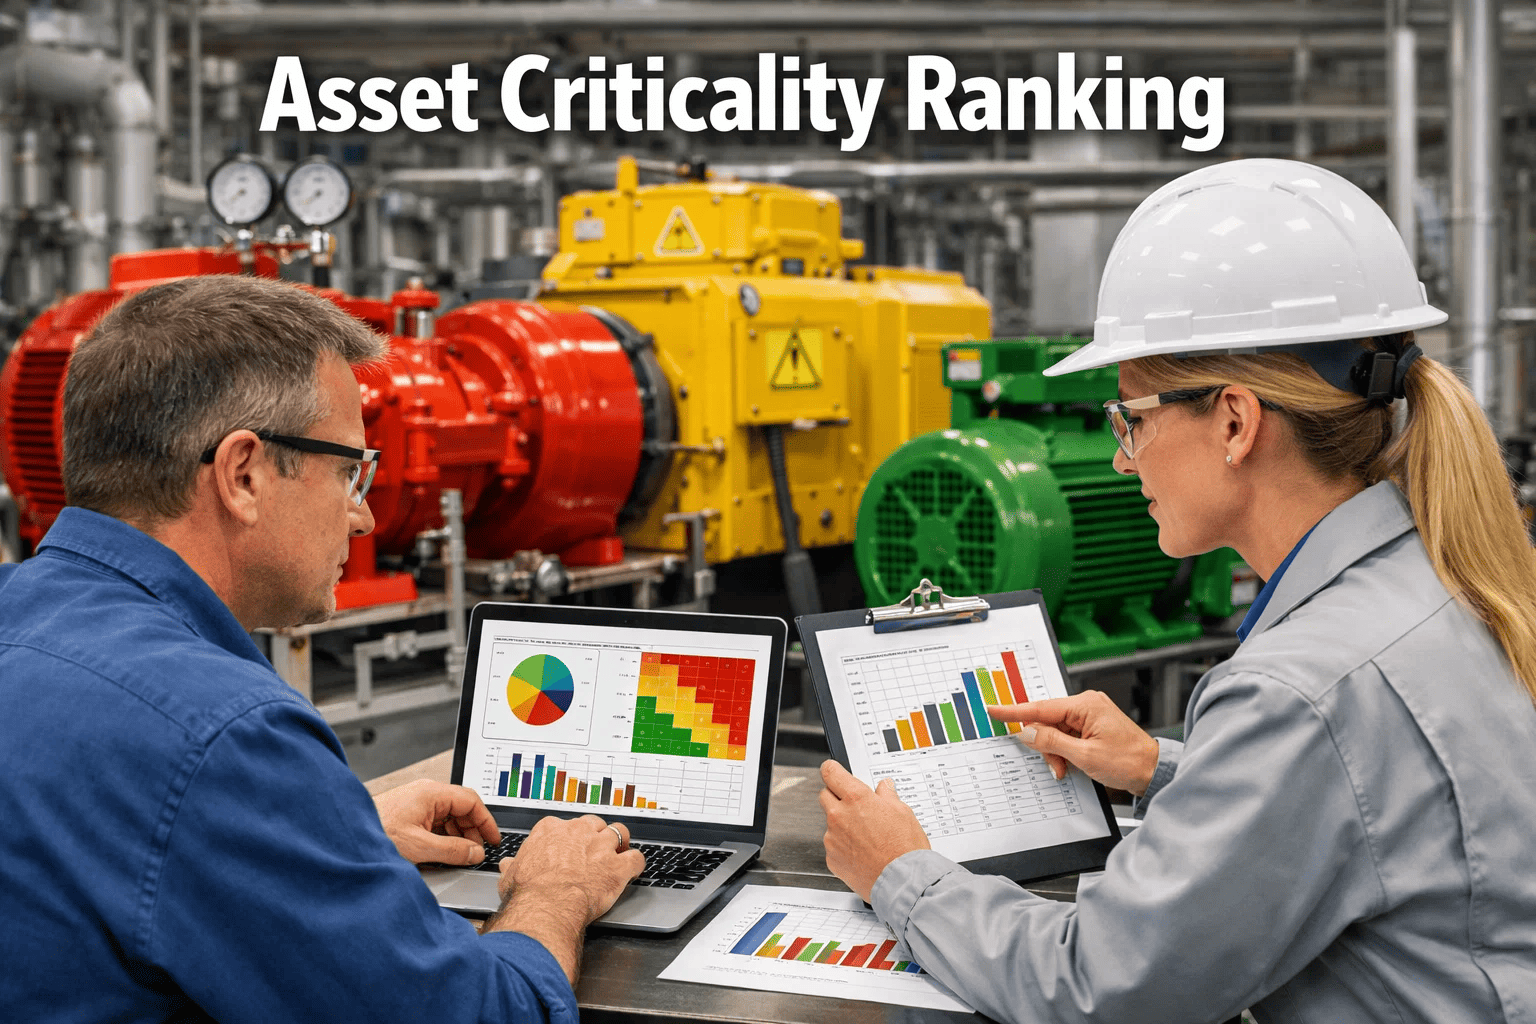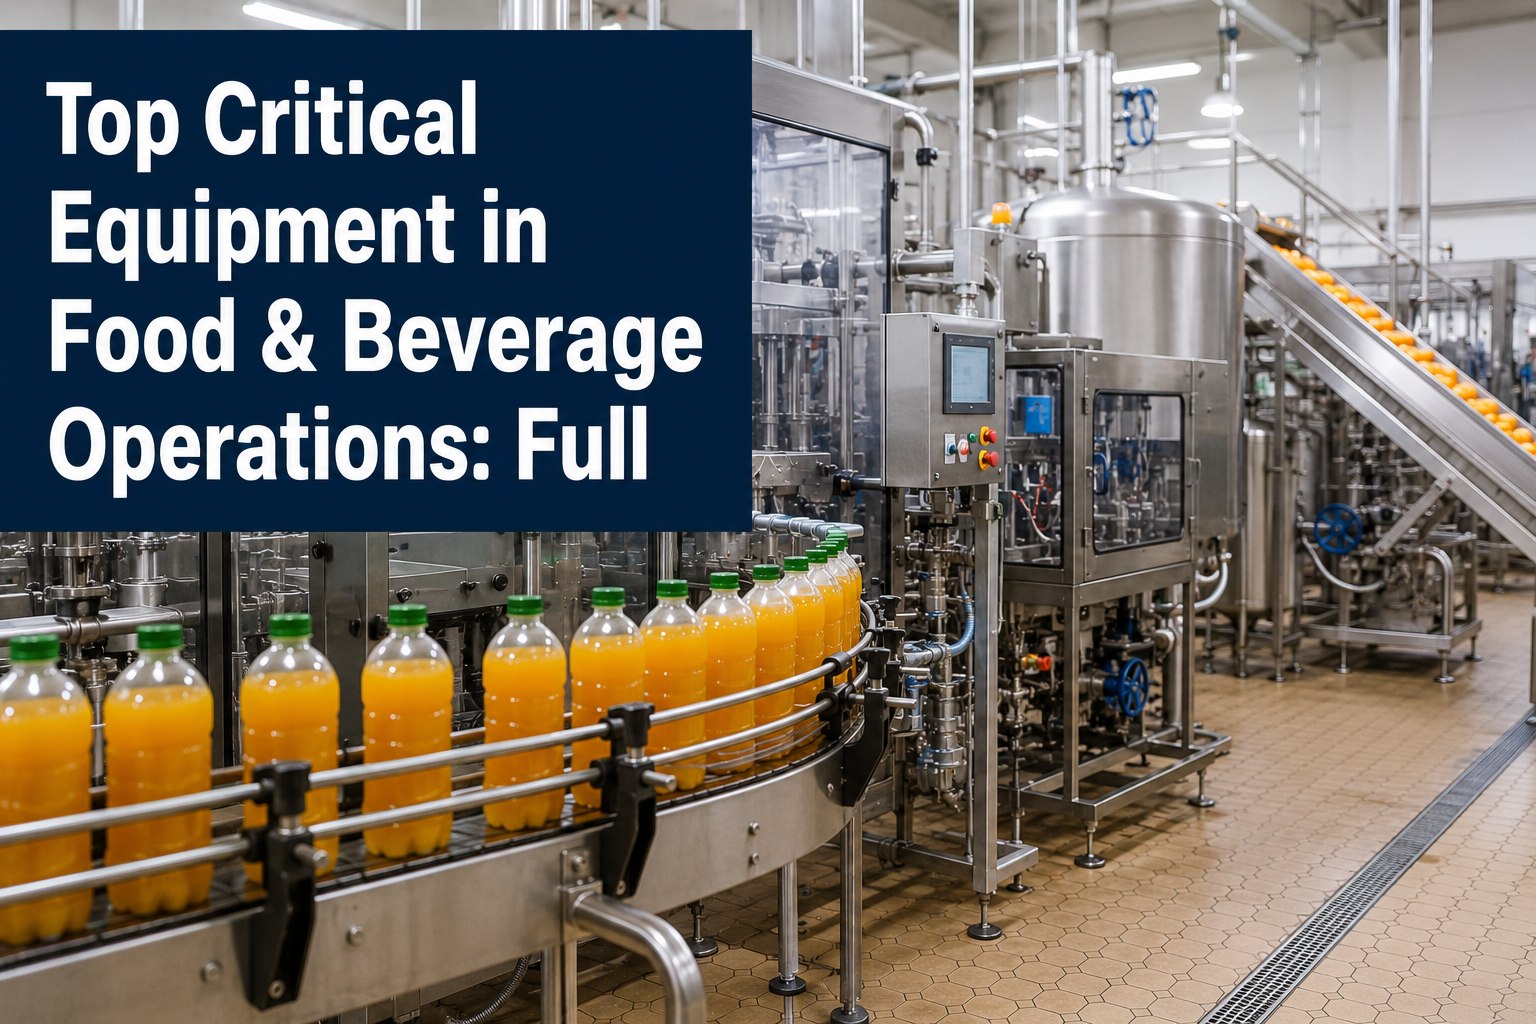
Not every asset in a Food & Beverage plant deserves the same maintenance attention — and treating them all equally is exactly why maintenance budgets overrun while critical equipment still fails. This guide ranks the most critical equipment in Food & Beverage operations using consequence-of-failure scoring across safety, production loss, environmental impact, repair cost, and regulatory risk, so your team knows exactly where to focus the next maintenance dollar. Whether you manage a single site or a multi-plant network, this criticality matrix template — paired with OxMaint's asset hierarchy — gives you a defensible, data-driven answer to the question every plant manager eventually asks. Ready to operationalize your asset ranking? Start Free Trial and tag every asset by tier today.
FOOD & BEVERAGE ASSET CRITICALITY
If your Tier 1 filler goes down tomorrow, how many hours of production — and dollars — do you lose before it's running again?
A single unplanned failure on a high-pressure CIP system, HTST pasteurizer, or packaging line can halt production for 4–18 hours, trigger product holds, and jeopardize audit compliance. Consequence-of-failure scoring tells you which assets carry that risk — before the failure happens.
WHY CRITICALITY RANKING MATTERS
The cost of treating every asset equally in Food & Beverage maintenance
In a typical 400-asset Food & Beverage plant, maintenance teams spend roughly 60% of their PM hours on assets that contribute less than 10% of overall downtime risk. Meanwhile, the 15–20 truly critical assets — the ones whose failure stops production, triggers a recall, or violates HACCP, SQF, or FDA 21 CFR Part 117 requirements — receive the same generic monthly inspection as a utility fan in the boiler room.
The result is predictable: maintenance budgets inflate by 15–25% annually, overtime spikes on emergency call-outs, and the assets that actually matter — HTST pasteurizers, CIP systems, fillers, sealers, refrigeration compressors — still fail because they're buried in a flat, undifferentiated preventive maintenance schedule. A defensible food and beverage equipment risk ranking fixes this by scoring every asset on five dimensions of consequence, then routing maintenance dollars, technician time, and spare-parts inventory to the assets where failure hurts most.
CONSEQUENCE-OF-FAILURE SCORING MODEL
How to score Food & Beverage equipment risk ranking across 5 dimensions
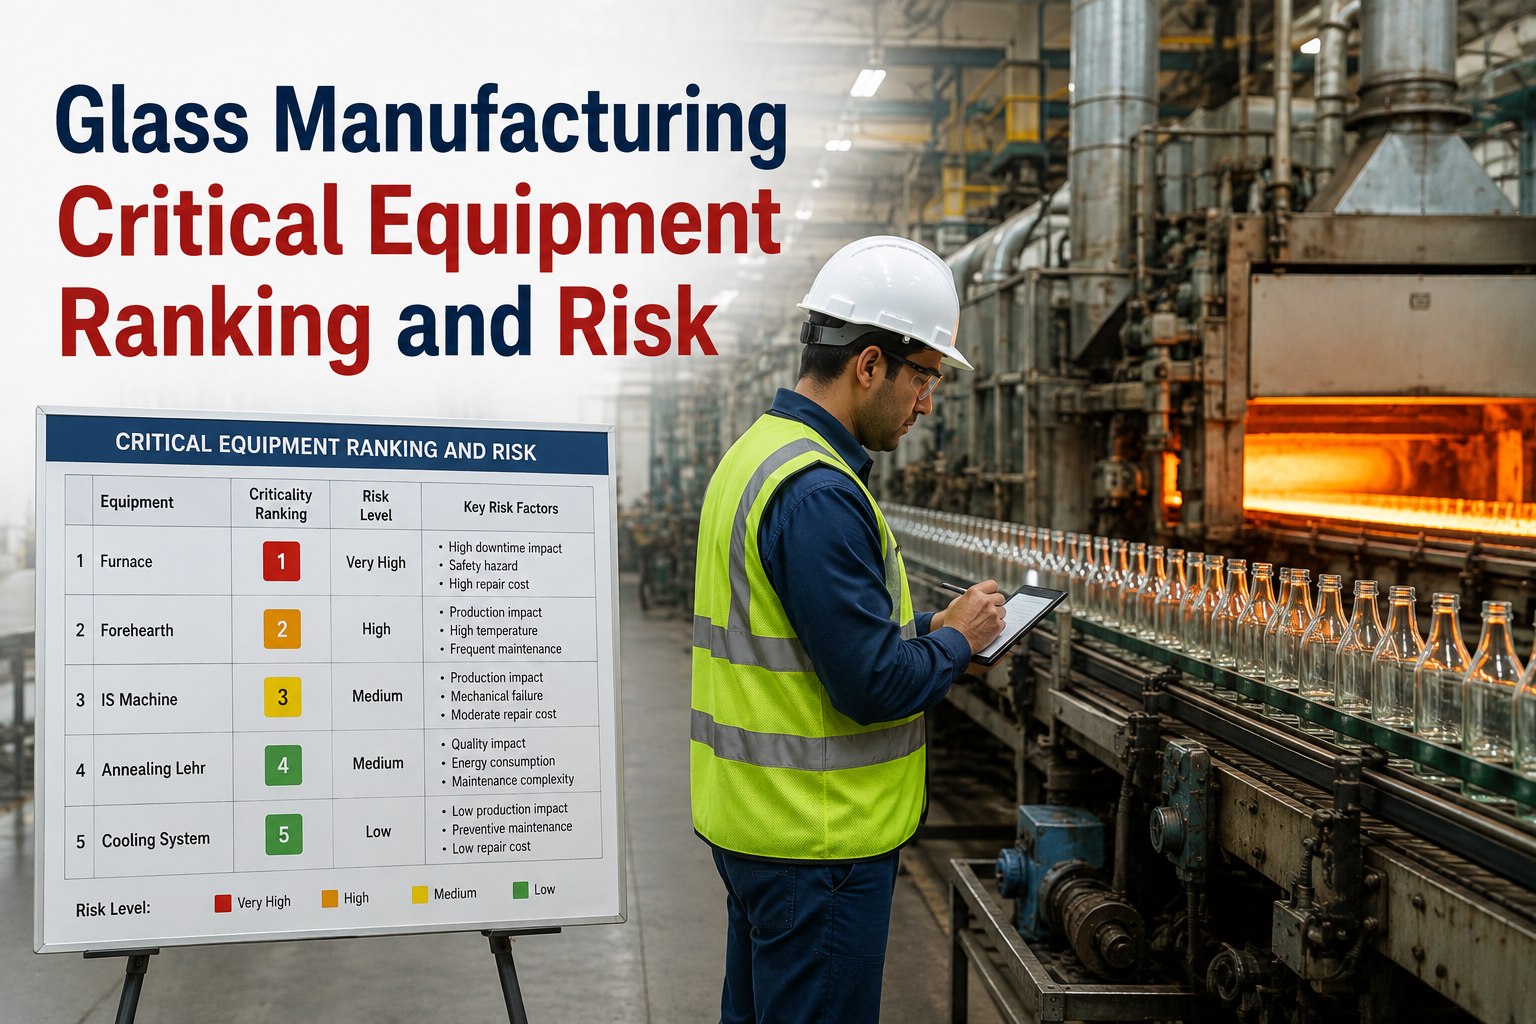
A robust criticality model scores each asset from 1 (negligible) to 5 (catastrophic) on five consequence dimensions. The composite score — typically 5 to 25 — determines the asset's tier and drives PM frequency, spare-parts stocking, and work-order priority. This is the backbone of RCM for Food & Beverage operations and aligns with ISO 55000 asset management principles.
| Dimension | Score 1 — Negligible | Score 3 — Moderate | Score 5 — Catastrophic |
|---|---|---|---|
| Safety & Personnel Risk | No injury risk; minor first aid | Lost-time injury possible; OSHA recordable | Critical injury or fatality risk; ammonia/refrigerant release |
| Production Loss | No production impact; redundancy exists | 1–4 hours of line downtime; partial shift loss | Full plant shutdown 8+ hours; total batch loss |
| Environmental Impact | No spill or discharge risk | Containable spill; internal reporting only | Regulatory discharge; EPA / wastewater violation |
| Repair Cost & Lead Time | Under $2K; parts in stock; same-day fix | $5K–$20K; 1–2 week lead time on critical part | $50K+; 4–8 week lead time; custom fabrication required |
| Regulatory & Compliance | No audit impact; non-critical system | Minor documentation gap; corrective action needed | HACCP / SQF / FDA critical control point failure; product hold or recall |
A worked example: a 500-gallon HTST pasteurizer in a dairy plant scores 5 (safety — pressurized, hot), 5 (production — single line, no bypass), 3 (environmental — cleaning chemicals), 4 (repair — $35K plate heat exchanger, 3-week lead), and 5 (regulatory — critical control point under Pasteurized Milk Ordinance). Composite: 22. That places it squarely in Tier 1 and demands weekly PM, condition monitoring on seal pressure, and a guaranteed critical spare.
FOOD & BEVERAGE CRITICAL EQUIPMENT LIST
Top 10 high-risk assets in Food & Beverage operations — ranked by criticality
Based on consequence-of-failure scoring across hundreds of F&B plants, these ten asset categories consistently rank as Tier 1 or Tier 2. Your specific food and beverage critical equipment list will vary by product type and plant layout, but this ranking reflects the most common high-risk assets across dairy, beverage, bakery, prepared foods, and meat/poultry operations.
Critical control point for food safety. Failure means product diversion, full batch loss, and regulatory non-compliance. Typical composite score: 21–24. Requires daily PM checks, seal integrity monitoring, and chart recorder calibration.
When CIP goes down, every upstream and downstream asset is blocked from cleaning. A single failed CIP pump can idle an entire production line for 6–12 hours. Composite score: 19–22. Monitor conductivity probes, pump seals, and valve actuation.
Cold-chain failure spoils inventory worth $100K–$2M in hours and poses catastrophic safety risk from ammonia release. Composite score: 20–25. Vibration analysis, oil analysis, and leak detection are non-negotiable for Tier 1 PM.
Bottleneck asset — no redundancy, no bypass. A filler stoppage stops the entire packaging line and risks product waste at the filler bowl. Composite score: 18–22. Enforce stricter PM on fill valves, seal rings, and capping torque heads.
High frequency, moderate consequence. Individual conveyor segments may have bypasses, but main-line conveyors halt production. Composite score: 14–18. Focus on motor bearings, belt tracking, and drive chain tension.
Steam loss halts cooking, sterilization, and CIP cycles across the plant. Composite score: 19–23. Daily water treatment checks, weekly burner inspection, and annual tube inspection are baseline PM for Tier 1 status.
Seal integrity failures cause customer complaints and potential recall exposure. Composite score: 13–17. PM on heated jaw temperature calibration, belt wear, and film feed sensors prevents most failures.
Process-critical but often with batch redundancy. Composite score: 12–16. Focus on gearbox oil analysis, bearing temperature monitoring, and seal replacement schedules to prevent metal-on-metal contamination.
Instrument air powers valves, actuators, and pneumatics across the plant. Composite score: 13–16. Weekly condensate drain checks, monthly filter replacement, and quarterly dewpoint monitoring keep this utility reliable.
Environmental compliance is the primary risk — discharge violations carry fines and permit revocation. Composite score: 12–16. Monitor pH probe calibration, pump duty cycles, and DAF (dissolved air flotation) performance.
TIERED MAINTENANCE STRATEGY
What each tier means for your PM schedule, spares, and work-order routing
Once every asset has a composite score and tier assignment, the maintenance strategy changes dramatically. Instead of a flat PM calendar, you get a tiered approach that concentrates resources where risk is highest — the core principle behind RCM for Food & Beverage.
Critical — Production-Stopping & Safety-Critical
- PM frequency: weekly to daily, with condition-based monitoring (vibration, thermography, oil analysis)
- Guaranteed critical spares in stock — no reliance on supplier lead times
- Work orders auto-routed to senior technicians with documented procedures
- Redundancy and bypass plans documented and tested quarterly
- FMEA reviewed annually; RCA mandatory on every failure
Essential — Process-Critical with Some Redundancy
- PM frequency: bi-weekly to monthly, with quarterly inspections
- Key spares stocked; non-critical parts on supplier call-off
- Work orders routed to qualified technicians; cross-training documented
- Condition monitoring on high-wear components (bearings, seals, belts)
- FMEA reviewed bi-annually; RCA on repeated failures
Standard — Run-to-Failure or Basic PM
- PM frequency: quarterly to annual; basic lubrication and inspection
- Spare parts on demand; no dedicated inventory holding
- Work orders routed to any qualified technician
- Run-to-failure acceptable when downtime impact is minimal
- Annual review to confirm tier classification still applies
HOW OXMAINT HELPS
How OxMaint operationalizes your Food & Beverage asset priority
A criticality matrix in a spreadsheet is a good start — but it doesn't route work orders, enforce PM schedules, or alert you when a Tier 1 asset drifts out of spec. OxMaint's AI-powered CMMS turns your food and beverage critical equipment list into a live, automated maintenance system.
Asset Hierarchy with Tier Tagging
Build a full asset register — plant, line, system, component — and tag every asset with its criticality tier. OxMaint auto-routes Tier 1 work orders to your most experienced technicians and enforces stricter PM cadences on high-risk equipment.
Predictive Maintenance on Tier 1 Assets
Connect vibration, temperature, and pressure sensors to OxMaint's AI engine. The system detects anomaly patterns 2–6 weeks before failure and auto-generates work orders — so you fix Tier 1 equipment during planned downtime, not at 2 AM on a production run.
Critical Spares Inventory Control
Link spare parts directly to Tier 1 assets in the hierarchy. OxMaint enforces minimum stock levels on critical spares, auto-generates purchase orders when inventory drops, and shows you exactly which asset each part belongs to — no more guessing during a breakdown.
Real-Time Downtime Risk Dashboard
See where downtime risk is concentrated across your plant — or your entire network — on a single dashboard. OxMaint overlays open work orders, overdue PMs, sensor alerts, and asset criticality so reliability leaders know exactly where to deploy the next maintenance dollar.
A 180-asset dairy plant spending $42K/year on reactive maintenance deployed OxMaint's criticality ranking and tiered PM strategy. Within 6 months, they reduced unplanned downtime by 37% on their HTST and CIP systems, cut emergency call-out overtime by $11K, and passed their SQF audit with zero maintenance-related non-conformances. Total annualized savings: $68K — a 4.2x return on their OxMaint subscription.
See your Tier 1 assets — and their risk — on a live OxMaint dashboard
Book a 30-minute demo and we'll map your top 10 critical assets into OxMaint's hierarchy, show you the tiered PM automation, and give you a downtime-risk dashboard prototype built from your plant's data.
FREQUENTLY ASKED QUESTIONS
Food & Beverage critical equipment ranking — your questions answered
What is the most critical equipment in a Food & Beverage plant?
The most critical equipment in a Food & Beverage plant is any asset whose failure stops production, compromises food safety, or triggers regulatory non-compliance. Typically, this includes HTST/UHT pasteurizers, CIP systems, refrigeration compressors, and fillers — all of which score 18–25 on a five-dimension consequence-of-failure model covering safety, production loss, environmental impact, repair cost, and regulatory risk. You can build your own critical asset register in OxMaint — Start Free Trial and tag every asset by tier today.
How do you rank Food & Beverage equipment by criticality?
Rank equipment by scoring each asset from 1 to 5 on five consequence dimensions: safety risk, production loss, environmental impact, repair cost and lead time, and regulatory compliance impact. The composite score (5–25) determines the tier — Tier 1 (18–25) for critical production-stopping assets, Tier 2 (12–17) for essential process equipment, and Tier 3 (5–11) for standard assets where run-to-failure is acceptable. This approach aligns with ISO 55000 and RCM methodology for Food & Beverage.
How often should Tier 1 Food & Beverage equipment be inspected?
Tier 1 Food & Beverage equipment should be inspected weekly to daily, depending on the asset type and failure mode. Critical control points like HTST pasteurizers and CIP systems require daily checks on seal integrity, temperature calibration, and chart recorders. Condition-based monitoring — vibration analysis, thermography, oil analysis — should run continuously on Tier 1 rotating equipment like refrigeration compressors and filler motors. OxMaint enforces these PM frequencies automatically and escalates missed or overdue inspections.
What is a consequence-of-failure analysis for Food & Beverage assets?
A consequence-of-failure analysis evaluates what happens when an asset fails — not how likely it is to fail. For Food & Beverage assets, it quantifies the impact across safety (injury risk), production (hours and dollars lost), environment (spills, discharge), repair cost (parts, labor, lead time), and regulatory compliance (HACCP, SQF, FDA violations, product hold, recall). The analysis produces a composite score that drives maintenance prioritization, spare-parts stocking, and work-order routing decisions. See it in action — Book a Demo and we'll run it on your top assets.
How does a CMMS support Food & Beverage reliability and compliance?
A CMMS like OxMaint supports Food & Beverage reliability by centralizing the asset register, automating tiered PM schedules, tracking work-order history for audit trails, and providing real-time dashboards on downtime risk. It ensures HACCP and SQF documentation is always current, eliminates paper-based maintenance records, and gives plant managers a defensible, data-driven view of where maintenance dollars deliver the most risk reduction. The result is fewer unplanned failures, faster audit preparation, and measurable improvement in OEE.
STOP GUESSING — START RANKING
Build your defensible Food & Beverage criticality matrix in OxMaint — this week
Upload your asset list, score every asset on five consequence dimensions, auto-route Tier 1 work orders, and see your downtime-risk dashboard on day one. Your maintenance budget — and your audit score — will thank you.
Free 14-day trial · No credit card