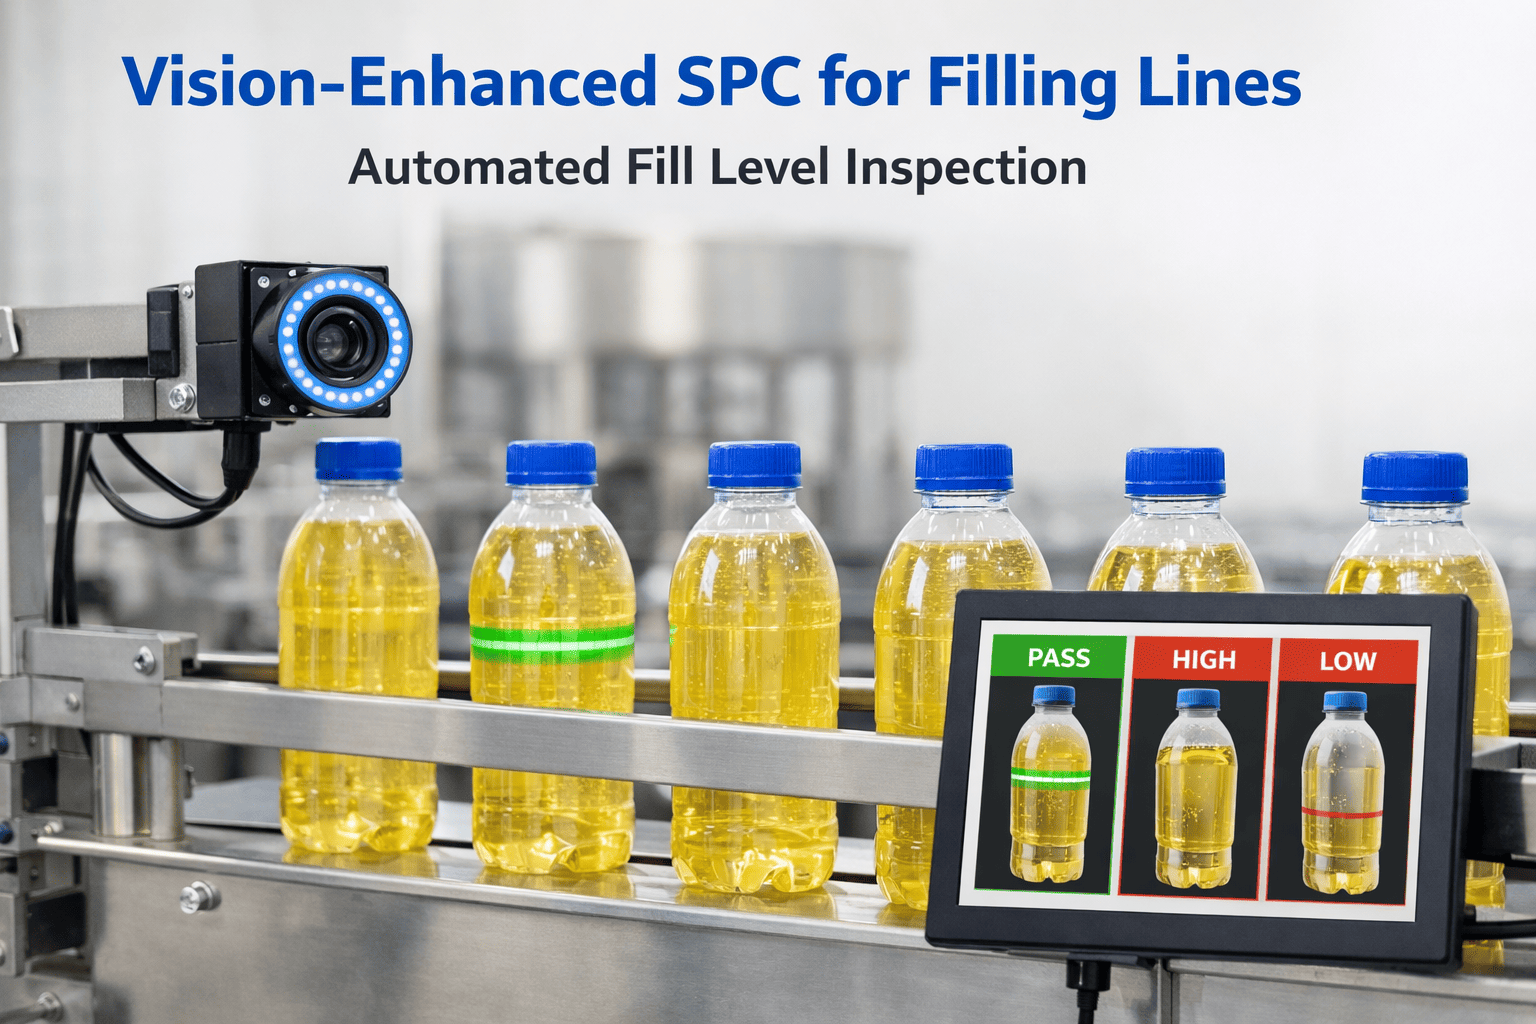
Fill level inconsistency is one of the most expensive hidden problems in food and beverage manufacturing. A single filling line running just 2% over target gives away thousands of dollars in product every month, while underfills trigger consumer complaints, regulatory penalties, and costly recalls. Vision-enhanced Statistical Process Control (SPC) solves this by combining high-speed camera systems with real-time statistical analysis — inspecting every single container at full line speed and detecting process drift before it produces a single out-of-spec unit. Book a free demo to see how vision SPC can eliminate fill-level waste on your production lines.
Why Vision-Enhanced SPC for Filling Lines
Food and beverage plants operate filling lines at hundreds of containers per minute. Manual spot-check sampling — pulling one container every 15 or 30 minutes — leaves massive blind spots where fill drift goes undetected. Traditional checkweighers catch gross errors but miss the subtle trending that causes systematic overfill giveaway. Vision-enhanced SPC closes these gaps by delivering 100% inspection with statistical intelligence, and when connected to a CMMS platform like Oxmaint, equipment issues causing fill problems automatically generate maintenance work orders. Sign up free to connect your filling lines.
2-5%
Product giveaway reduction through precision fill targeting and real-time overfill correction
<200ms
Per-container inspection speed — 100% inline verification at full production line rates
99.7%
Fill accuracy within spec limits when vision SPC replaces manual spot-check sampling
75%
Of food plants still use paper-based quality systems — vision SPC delivers a decisive edge
Stop losing product to overfill giveaway. Oxmaint centralizes vision SPC data and automates corrective maintenance workflows across all your filling lines.
Vision SPC merges two quality disciplines into a single closed-loop system. Machine vision cameras capture precise fill-level measurements for every container, while SPC algorithms continuously analyze the data stream for trends, shifts, and out-of-control conditions — catching process drift before it produces defective product.
Vision SPC System Architecture
From camera capture to automated corrective action
01
High-Speed Image Capture
Industrial cameras at the filling station photograph every container at line speed. LED backlighting and strobed illumination freeze motion for accurate meniscus detection — even with transparent, foamy, or carbonated liquids at 600+ containers per minute.
02
AI Fill Level Measurement
Computer vision algorithms process each image in under 200ms, measuring fill height against calibrated references. AI models handle bubbles, foam, reflections, and varying container transparency that confuse traditional sensor-based inspection.
03
Real-Time SPC Analysis
Every measurement feeds directly into live control charts — X-bar, R-charts, and CUSUM charts update continuously. Process capability indices (Cp, Cpk) are calculated in real time, with Western Electric and Nelson rules applied to detect trends and shifts automatically.
04
Automated Corrective Action
When SPC flags an out-of-control condition, the system rejects non-conforming containers, alerts operators, adjusts filler valve timing, and generates maintenance work orders for equipment issues like worn nozzles or failing actuators. Sign up free on Oxmaint to automate this workflow.
Vision SPC Inspection Capabilities
Vision-enhanced SPC goes far beyond pass/fail sorting. The combination of per-container imaging and statistical analysis unlocks capabilities neither technology delivers alone — from predicting filler head failures to calculating the optimal fill target for maximum profitability with zero compliance risk.
Inspection and Analytics Features
Meniscus-Level Detection
AI models detect true liquid surface through foam, bubbles, and carbonation with ±0.5mm accuracy even on high-speed lines running 600+ containers per minute.
Fill Drift Trending
SPC control charts track gradual fill-level shifts from temperature changes, viscosity variation, or component wear — detecting drift 10-15 minutes before fills breach spec limits.
Filler Head Comparison
Compare fill performance across individual heads on rotary fillers. Instantly identify which head underperforms and whether the root cause is mechanical, pneumatic, or valve-related.
Process Capability (Cpk)
Continuous Cpk monitoring ensures your filling process maintains capability. Alerts trigger when indices approach minimum thresholds, enabling proactive intervention before quality degrades.
Container Defect Screening
Simultaneously detects damaged containers, foreign objects, and seal integrity issues during fill inspection — one camera system handles multiple quality checks in a single pass.
Giveaway Optimization
Statistical analysis calculates the optimal fill target that minimizes overfill giveaway while maintaining full regulatory compliance. Tighter control limits mean targeting closer to nominal without risk.
See vision SPC running on a live filling line. Book a 30-minute demo to see real-time fill monitoring, SPC charting, and automated work order generation — or sign up free to start exploring Oxmaint today.
The gap between conventional fill quality control and vision SPC is not incremental — it is transformational. Understanding this difference explains why leading food and beverage manufacturers are making the switch, and why payback is typically measured in weeks.
Fill Quality Control Comparison
Manual / Checkweigher Only
VS
Vision-Enhanced SPC
Periodic spot-check sampling every 15-30 min
Inspection Coverage
100% container inspection at full line speed
Reactive — catches defects after they occur
Detection Mode
Predictive — detects drift before out-of-spec
No visibility into individual filler head performance
Equipment Insight
Individual head-by-head performance analytics
Operator-dependent adjustments increase variation
Correction Method
Automated corrections reduce human variability
Paper records difficult to audit
Documentation
Digital SPC records with full audit trail
3-8%typical overfill giveaway
<1%overfill with optimized targeting
Upgrade Your Filling Line Quality Control with Oxmaint. Centralize vision SPC data, automate maintenance work orders when equipment drift is detected, and maintain a complete digital audit trail for regulatory compliance.
Different containers and product types demand different vision SPC setups. The inspection approach must account for transparency, fill behavior, and the unique challenges each packaging format presents at high speeds.
Vision SPC Setup by Application
Container Type
Vision Method
SPC Metrics
Key Challenge
Clear Glass Bottles
Backlit silhouette imaging
Fill height, headspace volume, Cpk
Meniscus refraction, bubble interference
PET Bottles
Transmitted or reflected light
Fill height, sidewall distortion, X-bar R
Wall thickness variation, light scatter
Cans / Opaque
X-ray or gamma-ray imaging
Fill volume, headspace, CUSUM charts
No optical visibility — radiation methods required
Cartons / Pouches
Ultrasonic + vision hybrid
Weight correlation, volume estimate, Ppk
Flexible packaging deformation
Jars (Sauces)
Top-down or angled camera
Surface coverage, fill depth, run charts
Viscous products, air pockets, uneven surface
Oxmaint supports asset-specific SPC configurations — sign up free to tailor monitoring parameters to each filling line and container type in your facility.
Measured Results from Food and Beverage Plants
The financial impact of vision SPC extends well beyond reduced giveaway. When fill accuracy improves, benefits compound across material costs, regulatory compliance, customer satisfaction, and maintenance efficiency.
Documented Deployment Outcomes
Based on food and beverage industry implementations
60%
Reduction in overfill giveaway
90%
Fewer underfill customer complaints
70%
Less time spent on manual quality checks
50%
Faster root cause identification for fill issues
Calculate your potential giveaway savings. Sign up free to explore Oxmaint's vision SPC dashboards and ROI modeling tools — or book a demo and our team will build a custom savings projection for your filling operation.
Deploying vision SPC on your filling lines follows a phased approach that delivers measurable wins within weeks. Book a demo with our team for a timeline customized to your specific lines and products.
Typical Deployment Timeline
Week 1-2
Line Assessment
Filling line audit and baseline dataContainer and product characterizationCamera placement and lighting design
Week 3-4
Hardware Install
Camera and lighting installationEdge processor and network setupCalibration with reference containers
Week 5-6
SPC Configuration
Control chart setup and limit calculationAI model training on your productsOxmaint CMMS integration
In filling operations, you are either giving away product or risking non-compliance — there is no middle ground with manual methods. Vision SPC finally gives us the precision to target exactly where we need to be, with the statistical confidence that every container leaving our line meets specification.
— Quality Director, Beverage Manufacturing Plant
Bring Vision-Enhanced SPC to Your Filling Lines. Oxmaint connects your vision inspection systems to a centralized maintenance and quality platform — generating work orders when equipment drift is detected, tracking fill performance across every line, and providing audit-ready documentation for FDA, NIST HB133, and FPLPA compliance.
Can vision SPC handle carbonated and foamy beverages?
Yes. Modern AI vision systems are trained specifically to detect the true liquid surface beneath foam and carbonation bubbles. Advanced lighting techniques such as strobed LED backlighting and infrared imaging cut through foam to measure actual fill height with ±0.5mm accuracy even at high line speeds. Book a demo to see how the system handles your specific product.
How does this integrate with our existing filling equipment?
Vision SPC systems are non-contact and install alongside your existing line without modifications to the filler itself. Cameras mount above or beside the conveyor and communicate with your filler PLC via standard industrial protocols. When integrated with Oxmaint CMMS, equipment-related fill issues automatically generate maintenance work orders for your team. Sign up free to get started.
What SPC charts and metrics are available?
The system provides X-bar and R charts, X-bar and S charts, individual and moving range charts, CUSUM charts, and EWMA charts. Process capability metrics including Cp, Cpk, Pp, and Ppk are calculated in real time. Western Electric rules and Nelson rules are applied automatically to detect trends, shifts, runs, and cyclical patterns in your fill data.
How quickly will we see ROI from reduced giveaway?
Most food and beverage plants see measurable giveaway reduction within the first 30 days of deployment. Initial savings come from identifying and correcting the largest sources of overfill — often individual filler heads consistently dispensing above target. Full optimization typically delivers payback within 3-6 months depending on production volume and product value.
Does this help with regulatory compliance documentation?
Absolutely. Vision SPC provides a complete digital record of every fill measurement, every SPC chart update, and every corrective action taken. This audit trail satisfies FDA, NIST Handbook 133, and Fair Packaging and Labeling Act requirements with timestamped, tamper-proof documentation. Sign up for Oxmaint to centralize all compliance documentation in one platform.