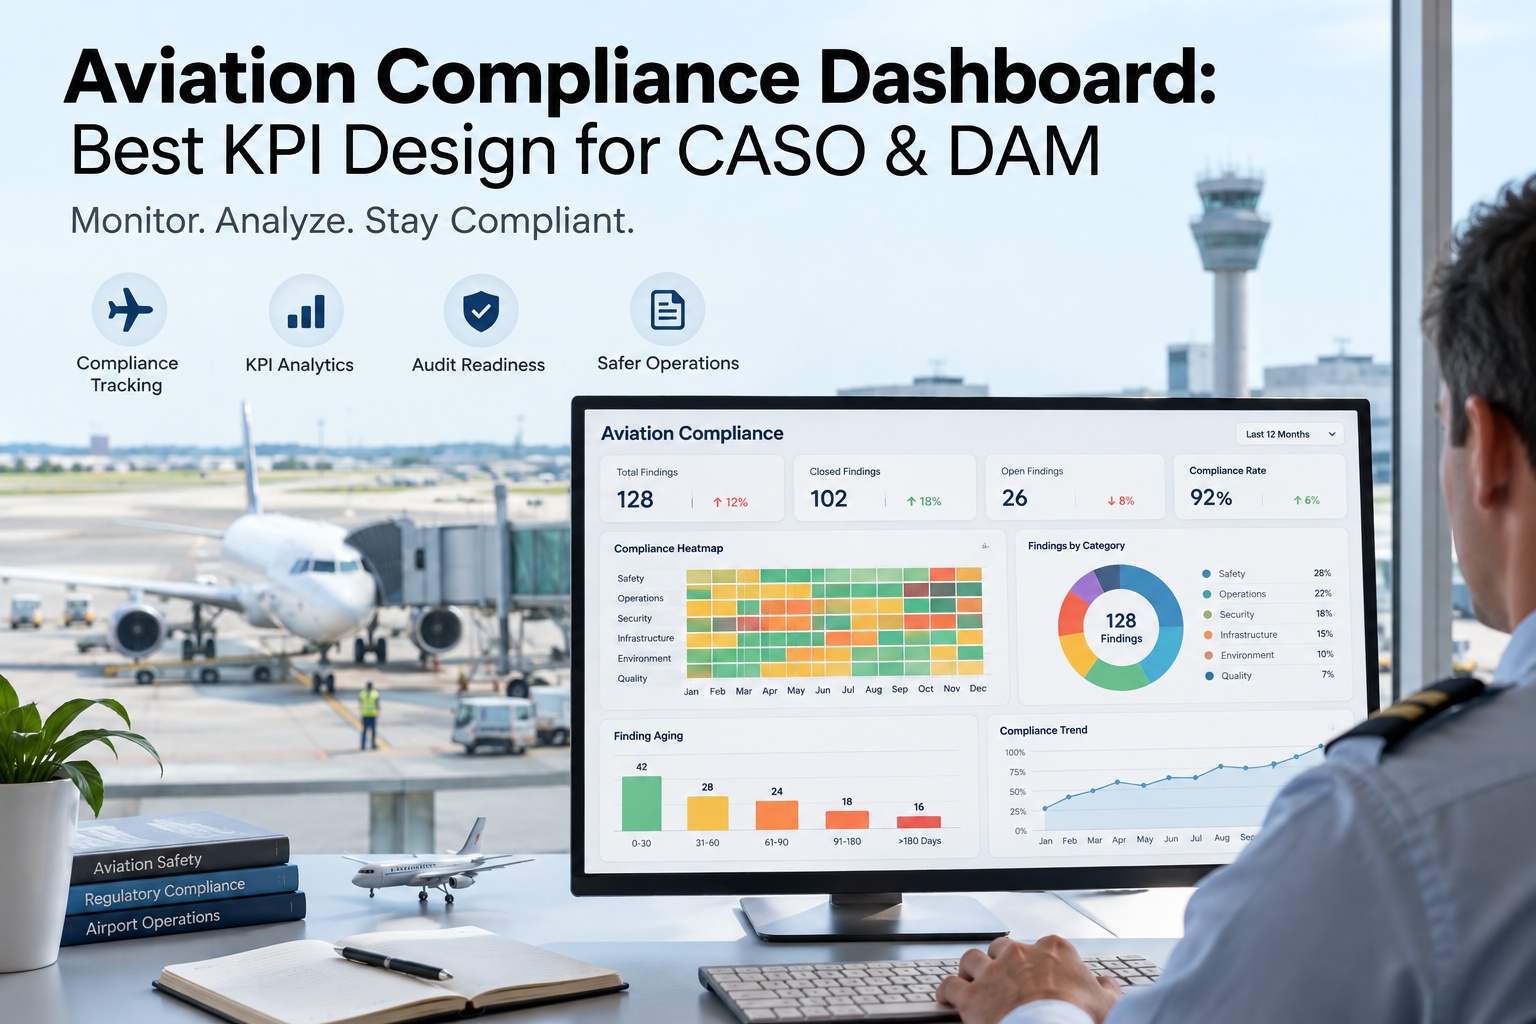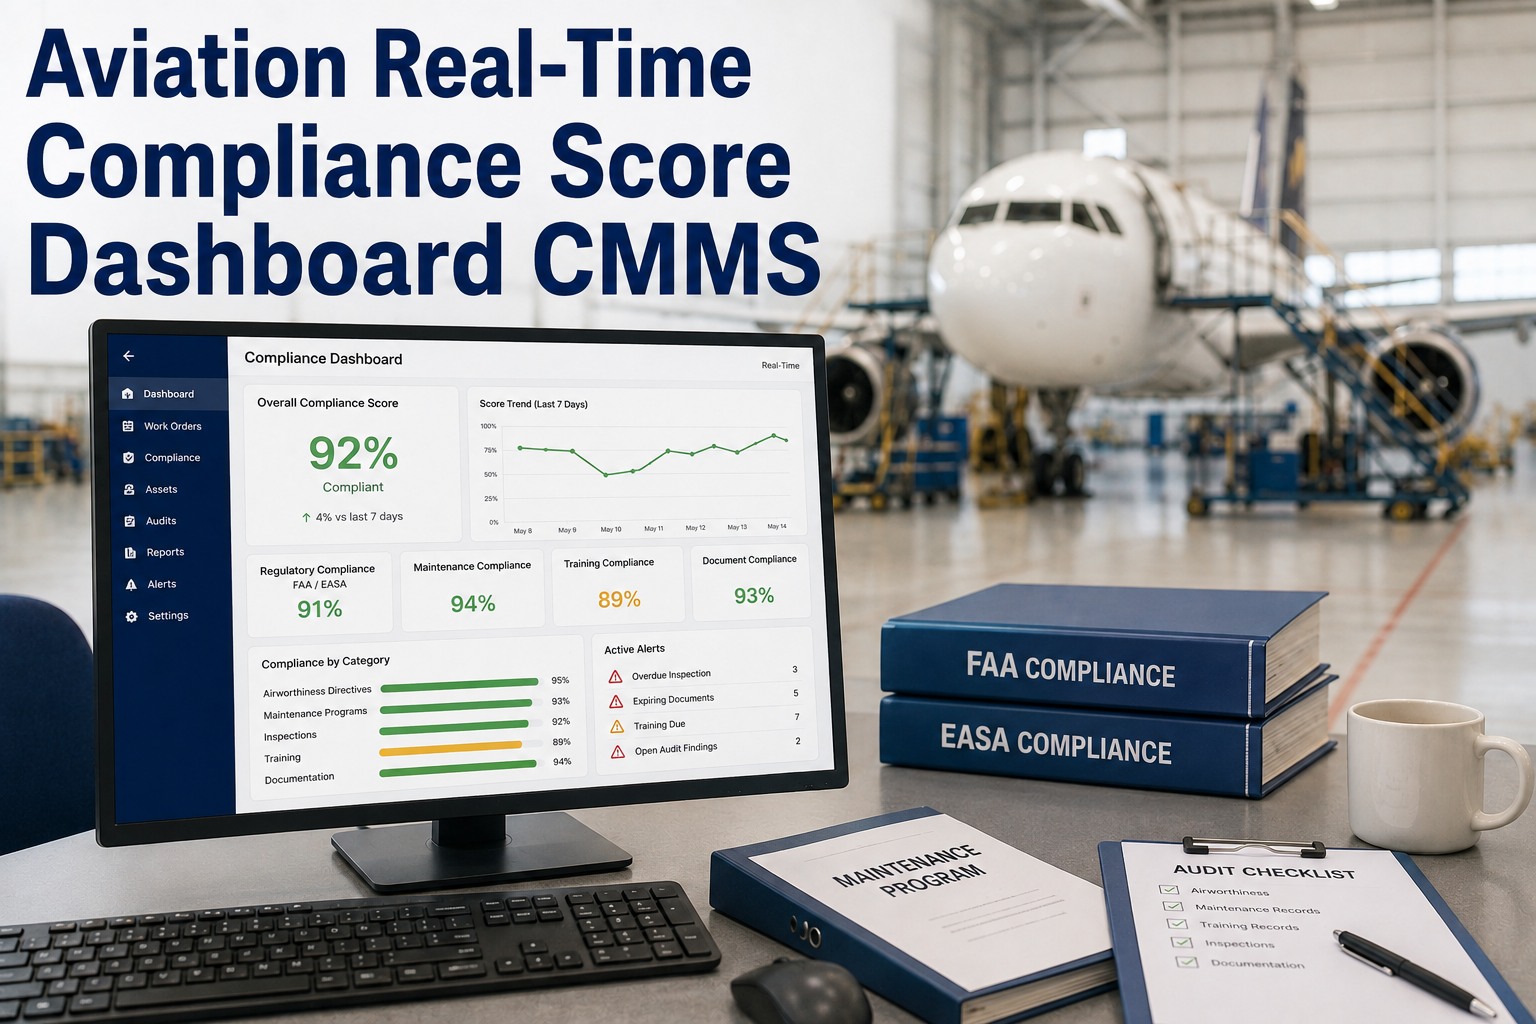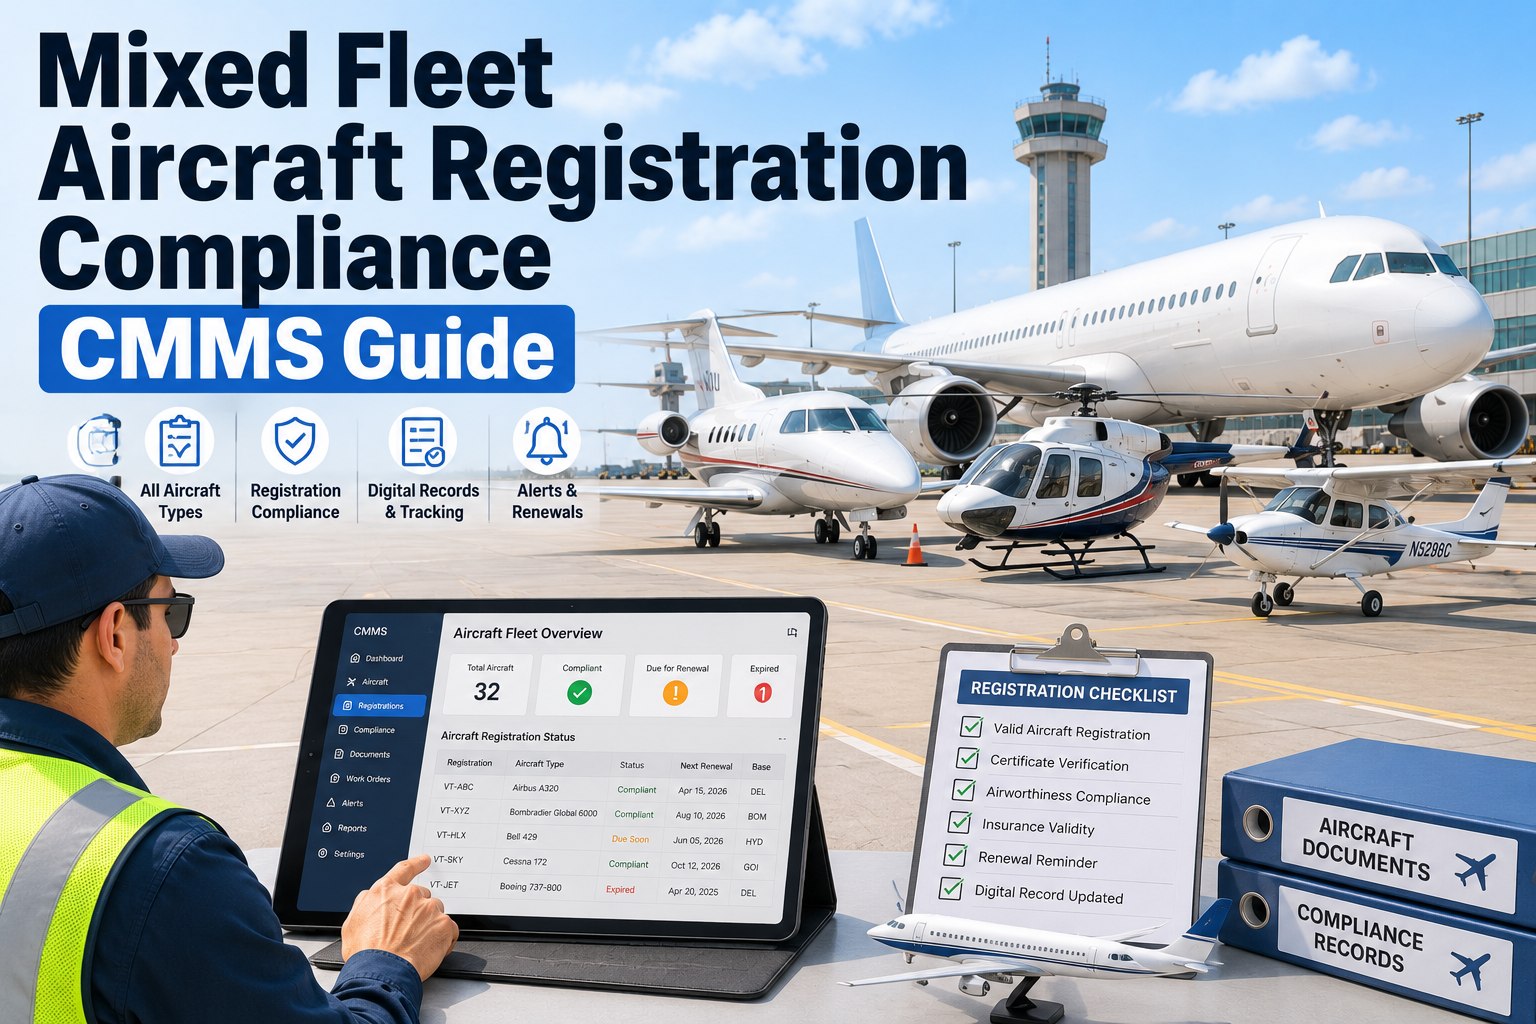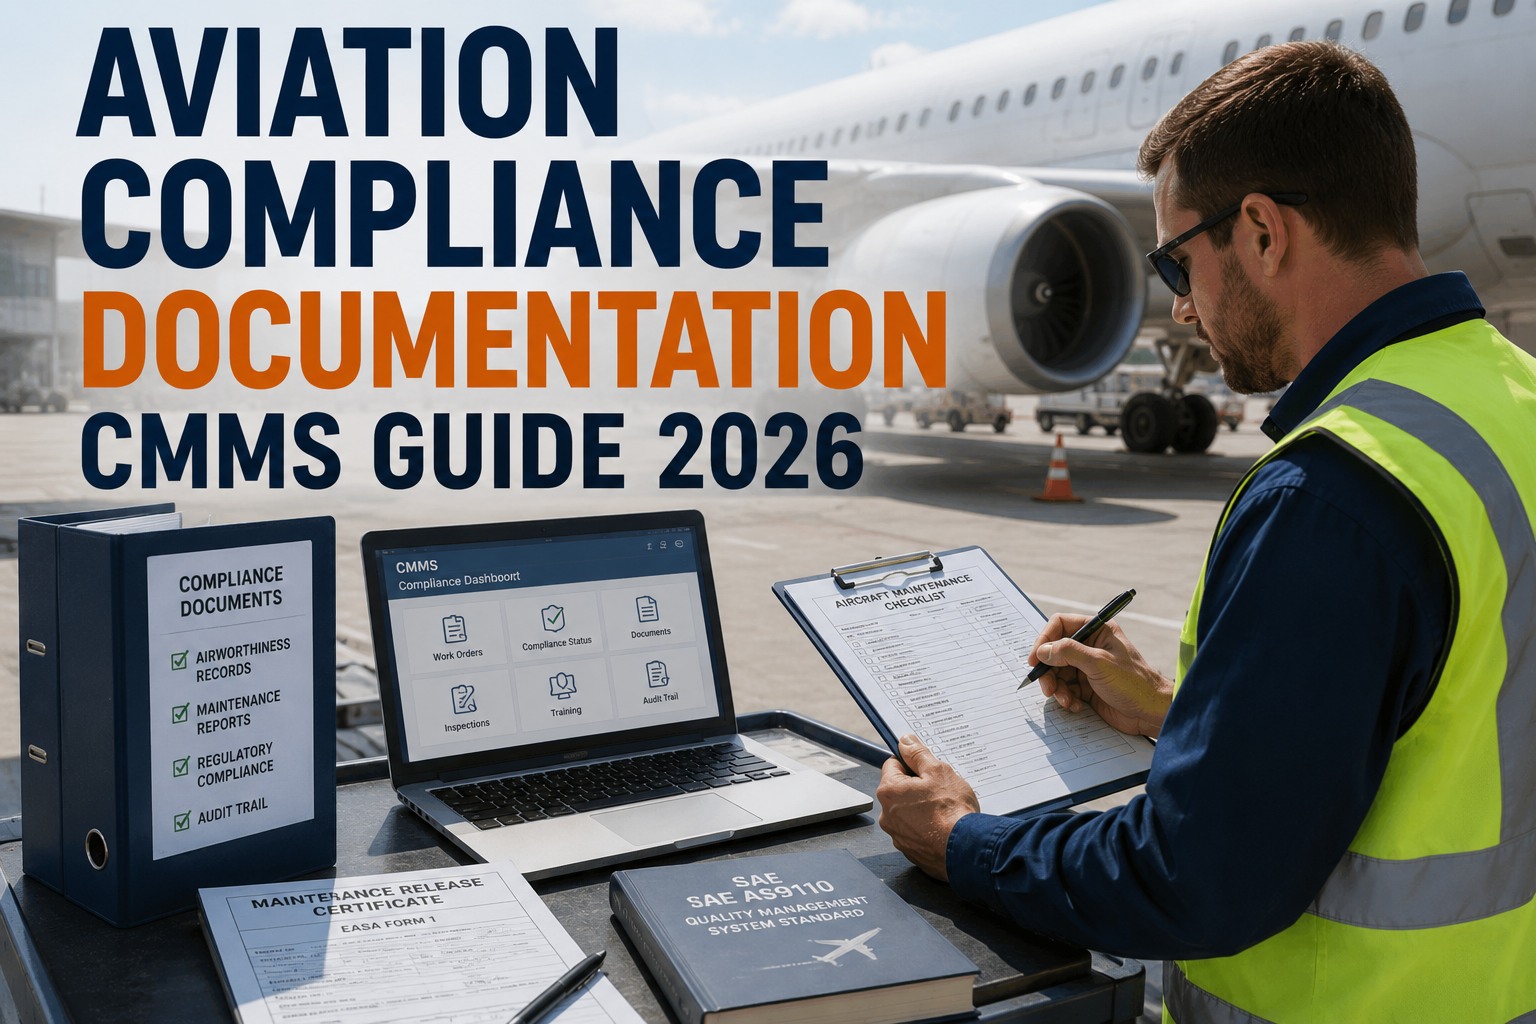
Fleet airworthiness isn't a status report you read at the end of the shift — it's a live signal that decides whether tail N748AX launches on the 06:00 departure or rolls into the hangar as an AOG. For continuing airworthiness managers and CAMO teams, the gap between "we think it's compliant" and "we can prove it's compliant" is measured in groundings, rerouted passengers, and six-figure overnight parts expedites. A real-time fleet airworthiness dashboard built on a modern CMMS collapses that gap into a single pane: tail-by-tail availability, AD/SB compliance, deferred defects, next-due maintenance, and technician capacity, all refreshed as work happens. If you're tired of discovering problems at 2 a.m. when dispatch calls, Start Free Trial and see your fleet's true status in minutes.
Do you know — right now — which tail in your fleet is one deferred defect away from an AOG?
For most CAMO teams, the honest answer is "not until someone calls." A real-time airworthiness dashboard changes that: every tail, every AD/SB, every due task and every technician hour — refreshed as work happens, not when the morning briefing is printed.
What "airworthy right now" actually means
Airworthiness is not a quarterly audit outcome — it is a per-tail, per-minute state composed of five concurrent conditions. If any one of them breaks, the aircraft is technically grounded, whether the dispatch desk knows it or not.
"A 22-aircraft regional operator we worked with discovered three tails flying with overdue repetitive SB inspections buried in a shared spreadsheet. The dashboards that were supposed to flag them had been pointing at stale exports for six weeks."
— Composite scenario from CAMO implementation reviews, 2024–2025
What a fleet airworthiness dashboard must surface — per tail, in real time
Each condition below is a live data stream. A real CMMS-backed dashboard pulls them from source records — work cards, logbook entries, parts transactions — not from a manually refreshed export.
Airworthiness Directive & Service Bulletin status, per tail
Every applicable AD and SB mapped to the specific tail, with compliance evidence (work card reference, sign-off, date) attached. Overdue items surface in gold; items inside a 30-day window surface as approaching. No more "we thought the vendor handled that."
Open MEL items with category and expiration clock
Each deferred defect shown with its MEL category (A, B, C, D), the repair-by date, and a countdown. Category C items expiring within 72 hours escalate automatically to the continuing airworthiness manager — before they become a line-station crisis.
Forecasted maintenance within 7 / 14 / 30 days
Block checks, borescope inspections, LLP replacements, corrosion tasks — each shown with hours, cycles, and calendar days remaining, plus the forecasted gate date. A dual-threshold trigger (e.g. 100 cycles OR 30 days, whichever first) prevents the classic "we hit cycles before calendar" surprise.
Composite risk indicator per tail
A weighted score combining deferred-defect density, days-to-next-critical-task, parts availability for due work, and recent reliability events. A tail moving from green to amber triggers a review; amber to red triggers an action assignment — not a report.
Technician and bay availability against scheduled work
Live view of certified technician hours by station and rating, mapped against scheduled and forecasted work. If a borescope-rated tech is unavailable for the only slot a tail can be on the ground, the dashboard flags the conflict weeks ahead — not the night before.
A 32-tail narrow-body fleet: what the dashboard caught in one week
The scenario below is a composite from operator implementations. The numbers are representative of what a live CMMS dashboard surfaces when it replaces a weekly status spreadsheet.
| What the dashboard surfaced | How it was found | Outcome if left undiscovered | Cost avoided |
|---|---|---|---|
| 2 tails with SB inspections 11 and 9 days overdue | AD/SB compliance stream — gold flag on tail view | Continued operation of non-compliant aircraft; potential regulatory finding | $80K–$220K exposure |
| 1 Category C MEL item expiring in 40 hours on a through-station | Deferred-defect countdown — auto-escalation | AOG at an outstation with no maintenance crew on duty | $150K+ AOG recovery |
| LLP replacement due in 28 days, no rotable in inventory | Next-due forecast + parts-on-hand mismatch | Grounding at peak demand; 5-day parts expedite | $45K expedite + lost revenue |
| No borescope-rated tech available for the only C-check slot in week 3 | Tech capacity vs. scheduled work conflict | Check slipped a week; cascading schedule disruption | $60K reschedule cost |
| 3 tails trending amber on composite AOG risk score | Reliability events + deferred-defect density weighting | Unplanned removals during line operations | $95K avoided per removal |
In total, the dashboard surfaced approximately $430K–$570K of avoidable cost exposure in a single week — before any of it reached the dispatch desk. That is the difference between fleet management and fleet visibility.
Spreadsheets and BI exports vs. a real-time CMMS dashboard
The comparison below is drawn from operator feedback during procurement. The cost of a "free" spreadsheet-based system is paid in latency, audit risk, and 2 a.m. phone calls.
- Refreshed manually — daily, weekly, or "when someone remembers"
- AD/SB compliance tracked in separate tabs; cross-reference by hand
- Deferred defects logged in text columns; no automatic countdown
- No link between technician capacity and scheduled work
- Audit trail = version history of a shared file
- AOG risk = gut feel of the maintenance controller
- Refreshed as work is signed off — seconds, not days
- AD/SB compliance mapped per tail, with evidence attached
- Deferred defects auto-count down by MEL category; auto-escalate
- Technician ratings and hours matched against due work live
- Audit trail = immutable sign-off chain, regulator-ready
- AOG risk = weighted composite score, trended over time
Stop finding out about airworthiness problems at 2 a.m.
See every tail, every AD/SB, every deferred defect and every due task in one live view — built for continuing airworthiness managers and CAMO teams who own the answer when dispatch calls.
From spreadsheets to live fleet airworthiness in 90 days
A phased rollout keeps the CAMO team in control and avoids the "big-bang cutover" that historically derails aviation IT projects. Each phase delivers standalone value before the next begins.
Data foundation & tail registry
Import the full tail registry, current AD/SB applicability, open deferred defects, and the maintenance program. Validate against the last audit. Outcome: a single source of truth for "what is the fleet."
Compliance & defect streams live
AD/SB compliance and deferred-defect countdowns go live per tail. Auto-escalation rules for Category C/D items configured. Outcome: the 2 a.m. call volume drops immediately.
Forecasting & capacity matching
Next-due forecasts (7/14/30-day) published; technician ratings and bay availability mapped against scheduled work. Conflict flags go to the maintenance planning team. Outcome: schedule slips cut by 60%+
Composite AOG risk & tuning
Weighted AOG risk score activated per tail. Thresholds tuned against 90 days of reliability data. Outcome: the dashboard stops reporting history and starts predicting next week.
Fleet airworthiness dashboard — what CAMO teams ask first
How does a real-time airworthiness dashboard stay current without manual data entry?
The dashboard reads from the CMMS source records — work card sign-offs, logbook entries, parts transactions, and reliability reports — as they happen. There is no separate "dashboard data entry" step. When a technician closes a deferred defect on the line, the tail's status updates in seconds, and the countdown is removed automatically. The only manual inputs are threshold decisions, which the continuing airworthiness manager configures once.
Can the dashboard handle both AD/SB compliance and MEL deferred defects together?
Yes — and that integration is the point. A tail can be fully AD/SB compliant but still grounded by an expired Category C MEL item. The dashboard shows both conditions on the same tail view, weighted into the composite AOG risk score. Teams that try to track these in separate systems are the ones who miss the cross-condition interactions that actually cause groundings.
What does implementation look like for a 20–40 aircraft fleet?
A phased 90-day rollout is typical: data foundation and tail registry in the first two weeks, compliance and defect streams live by day 45, forecasting and technician-capacity matching by day 75, and composite AOG risk scoring tuned by day 90. You can Book a Demo to see a scoped timeline for your specific fleet size and maintenance program complexity.
Is the dashboard audit-ready for regulators like the FAA, EASA, or CAA?
Every status shown on the dashboard is backed by an immutable sign-off chain — who did the work, when, with what credentials, and against which task card. The audit view exports directly to PDF or structured data, so a regulator asking "show me the compliance evidence for tail N748AX on SB 737-57-1234" gets a complete answer in one click, not a three-day records search.
How is the composite AOG risk score calculated — and can we tune it?
The score is a weighted composite of deferred-defect density, days-to-next-critical-task, parts availability for due work, and recent reliability events. Weights are configurable by the continuing airworthiness manager — for example, an operator with young aircraft may weight reliability events lower, while one with legacy types may weight parts availability higher. Thresholds for green/amber/red are tuned against 90 days of your own historical data during implementation.
Your fleet is airworthy — or it isn't. Know which, right now.
Stop managing airworthiness through exported spreadsheets and 2 a.m. dispatch calls. Deploy a live CMMS dashboard built for continuing airworthiness managers and CAMO teams who need the answer before the question arrives.
Free 14-day trial · No credit card