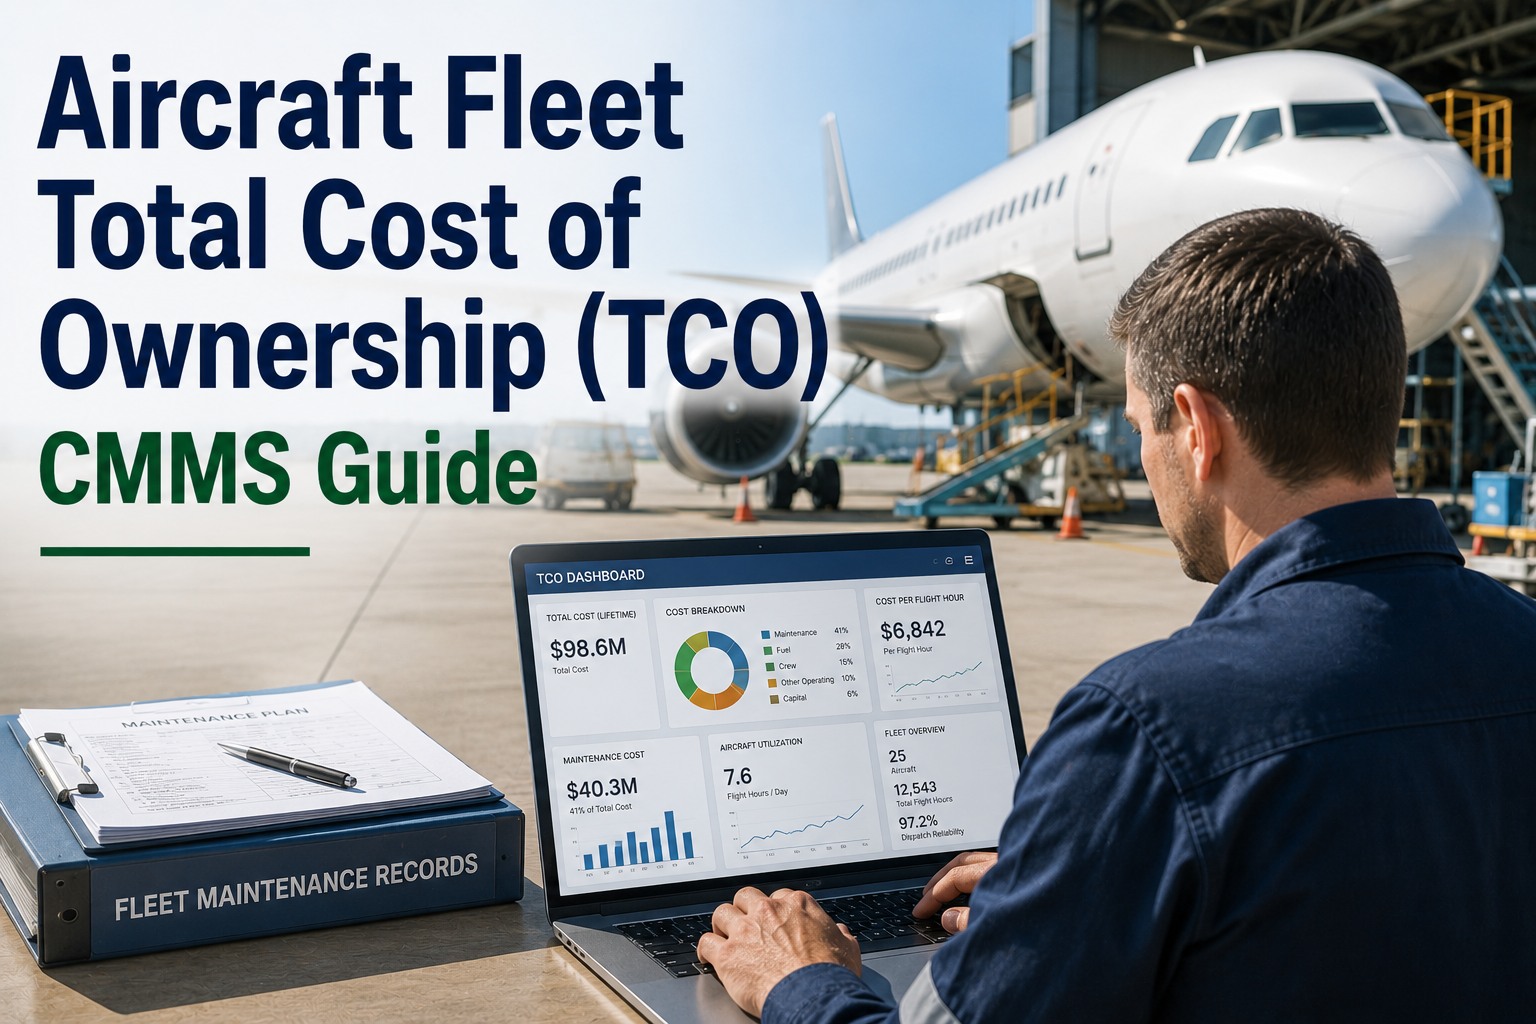
Aircraft fleet total cost of ownership (TCO) analysis aggregates every expense across an aircraft's operational life — acquisition, maintenance, fuel burn, engine reserves, and residual value — into a single, defensible figure that drives fleet strategy. For airlines, lessors, and MRO providers, maintenance alone can consume 25–40% of direct operating costs, yet most operators still track these streams in disconnected spreadsheets instead of a unified CMMS. This TCO CMMS guide for 2026 breaks down each cost element, shows how life-cycle modeling and fleet-mix analysis sharpen procurement and retirement decisions, and explains how AI-powered platforms like OxMaint turn real maintenance data into fleet-cost intelligence. Ready to replace guesswork with numbers? Start Free Trial and see your fleet TCO in real time.
Your aircraft purchase price is less than 30% of what you'll actually pay.
Maintenance, fuel, engine reserves, and residual-value erosion dominate the true cost of every airframe. A CMMS-built TCO model surfaces those numbers while you can still act on them — not at retirement.
What drives aircraft fleet TCO — the five cost streams
A narrowbody jet costs roughly $50M to acquire, but $120–180M to operate over 15 years. Below are the five streams that make up virtually all of that spend — and where CMMS data changes the math.
Airframe & engine purchase or lease
Purchase price, capitalized modifications, and initial spares packages. For leased aircraft, monthly lease rentals replace depreciation but still anchor the TCO baseline.
Base checks, line MRO, components, labor
The largest controllable slice. C-checks at $1–3M each, D-checks at $4–6M, engine shop visits at $2–5M, plus AOG line events. A CMMS tracks every dollar against tail number and forecast horizon.
Block fuel burn & tankering
Fuel is the most volatile TCO input. Drag penalties from deferred skin repairs, under-inflated tires, and dirty airframes add 1–3% burn — measurable when maintenance and fuel data sit in one system.
Engine & heavy-check reserves
Per-flight-hour accruals for future shop visits and heavy checks. Under-accruing distorts TCO by millions; a CMMS ties reserve rates to actual utilization and condition data.
Disposal, part-out, residual value
End-of-life value depends on maintenance status, hours/cycles remaining, and market timing. Aircraft sold "half-check" lose 15–25% of optimal value — a CMMS maintains the records buyers demand.
All values discounted to net present value over the holding period. Maintenance and fuel together typically exceed 55% of total — the two streams a CMMS directly controls.
How to model aircraft life-cycle costs in a CMMS
A defensible TCO model doesn't average industry benchmarks — it pulls real labor hours, parts consumption, and interval data from your maintenance records. Here's the five-month build.
Asset register & tail-level data import
Load every tail number, engine serial, and major component into OxMaint with MSN, hours, cycles, and current status. Tag each asset with acquisition cost and lease terms to establish the TCO baseline.
Maintenance forecast & reserve calibration
Import MPD tasks, AD/SB compliance status, and projected check intervals. OxMaint forecasts the next 24–60 months of base checks and engine shop visits, then maps reserve accrual rates against projected spend.
Parts inventory & labor cost attribution
Connect spare-parts pricing and labor rates to each work order. Every rotable repair, consumable issue, and technician hour now flows to a specific tail — the granular cost data spreadsheets can't hold.
Fuel-burn correlation & efficiency tracking
Layer in block-hour fuel data. OxMaint flags tails with rising burn that correlates to deferred maintenance — wash frequency, flap rigging, tire pressure — so you see the fuel cost of deferred work.
TCO dashboard & fleet-mix scenarios
Roll everything into a live TCO dashboard per tail, per fleet type, and per route. Run "keep vs replace" scenarios: what happens to TCO if you retire three A320ceos in Year 6 instead of Year 9?
A 50-aircraft narrowbody fleet: TCO without vs with CMMS tracking
Consider a regional operator flying 50 A320-family aircraft, averaging 2,800 block hours per tail annually. They tracked maintenance and reserves in spreadsheets for years. Here's what changed when they moved to CMMS-based TCO tracking.
| TCO Stream (per tail / year) | Spreadsheet Tracking | CMMS-Tracked (OxMaint) | Annual Savings |
|---|---|---|---|
| Base & line maintenance | $2.8M | $2.35M | $450K |
| Engine reserves (variance) | $1.2M | $1.05M | $150K |
| Fuel (maintenance-related drag) | $5.1M | $4.95M | $150K |
| AOG / unplanned events | $620K | $340K | $280K |
| Residual value protection | Baseline | +3% at disposal | $1.5M (per tail at sale) |
| Total per-tail annual savings | — | — | $1.03M / year |
Across 50 aircraft, the operator recovered $51.5M annually — roughly $1.03M per tail — by moving from reactive, spreadsheet-based cost tracking to CMMS-driven TCO management. The largest single contributor was cutting unplanned AOG events 45% through predictive maintenance alerts.
How OxMaint turns maintenance data into fleet TCO intelligence
OxMaint is an AI-powered CMMS and EAM platform built for maintenance and reliability teams that need real numbers — not estimates. Four capabilities directly compress aircraft fleet TCO.
Tail-level cost attribution
Every work order, parts issue, and labor hour auto-attributes to a specific tail number and engine serial. No more allocating MRO spend by fleet average — see exact per-aircraft TCO in real time.
Predictive maintenance alerts
AI models analyze component failure patterns, vibration data, and removal history to flag impending failures 30–90 days before they ground an aircraft. Convert unscheduled AOG into planned hangar visits.
Spare-parts inventory optimization
Track rotable pool levels, lead times, and consumption trends across stations. OxMaint auto-reorders at min-max triggers and flags slow-moving stock, so you carry 15–25% less inventory without raising AOG risk.
Compliance & audit-readiness
Every AD, SB, and MPD task carries a digital trail — sign-offs, parts certificates, and timestamps. Auditors and prospective buyers get a complete maintenance history in minutes, protecting residual value at sale or lease return.
Fleet TCO benchmarking — where do you stand?
A CMMS only delivers value if you can compare. Below are anonymized TCO benchmarks aggregated from OxMaint deployments across regional and mainline operators. Use them to pressure-test your own numbers.
Within nine months on OxMaint, our per-tail maintenance cost dropped 18% and our AOG rate fell from 9.4% to 5.1%. The TCO model we built inside the platform finally gave our finance team numbers they trusted for fleet-replacement decisions.
See OxMaint on your fleet — book a 30-minute demo
Watch a live TCO dashboard build from real work orders, parts data, and maintenance forecasts. Bring your numbers — we'll map them on the call.
Aircraft fleet TCO & CMMS — your questions answered
What is aircraft fleet total cost of ownership (TCO)?
Aircraft fleet TCO is the complete life-cycle cost of an aircraft — acquisition or lease, maintenance and reserves, fuel, crew, insurance, and disposal residual value — aggregated over the holding period and discounted to present value. In aviation, maintenance alone typically accounts for 25–40% of TCO, which is why CMMS-based tracking is essential for accurate figures.
How does a CMMS improve aircraft TCO tracking?
A CMMS like OxMaint captures every maintenance dollar at the tail-number level — labor hours, parts consumed, contractor invoices, and reserve accruals — and rolls them into a live TCO dashboard. This replaces spreadsheet averaging with exact per-aircraft cost data, enabling keep-vs-replace decisions grounded in real numbers. You can Start Free Trial to import your asset register and see your TCO baseline within days.
What cost elements should be in an aircraft fleet TCO model?
A complete aircraft TCO model includes five streams: acquisition or lease cost, maintenance (base checks, line MRO, components, labor), fuel burn, engine and heavy-check reserves, and residual value at disposal. Some models also factor crew, insurance, and navigation charges as operating overhead. The OxMaint CMMS TCO guide for 2026 focuses on the maintenance-controllable streams that deliver the biggest savings.
How much can airlines save with CMMS-based fleet TCO management?
Operators using OxMaint typically recover $800K–$1.2M per aircraft annually through reduced AOG events (30–50% fewer), optimized spare-parts inventory (15–25% lower carrying cost), and earlier maintenance interventions that prevent cascading failures. Across a 50-aircraft fleet, that's $40–60M per year — the kind of number that changes fleet-planning decisions.
How long does it take to implement a CMMS for aircraft TCO tracking?
A focused OxMaint deployment — asset register import, MPD task loading, parts inventory connection, and TCO dashboard configuration — takes 8–12 weeks for a mid-size fleet. Most operators see meaningful cost visibility by Month 3 and measurable savings by Month 6. To see the implementation roadmap on your own data, Book a Demo with our aviation team.
Stop estimating aircraft fleet TCO. Start measuring it.
Every month without CMMS-based TCO tracking, you're flying blind on $1M+ per tail in controllable costs. OxMaint gives you the numbers in weeks — not next budget cycle.
Free 14-day trial · No credit card