Airport Power Factor Monitoring | Energy Efficiency & Penalty Avoidance
By David Cook on January 30, 2026
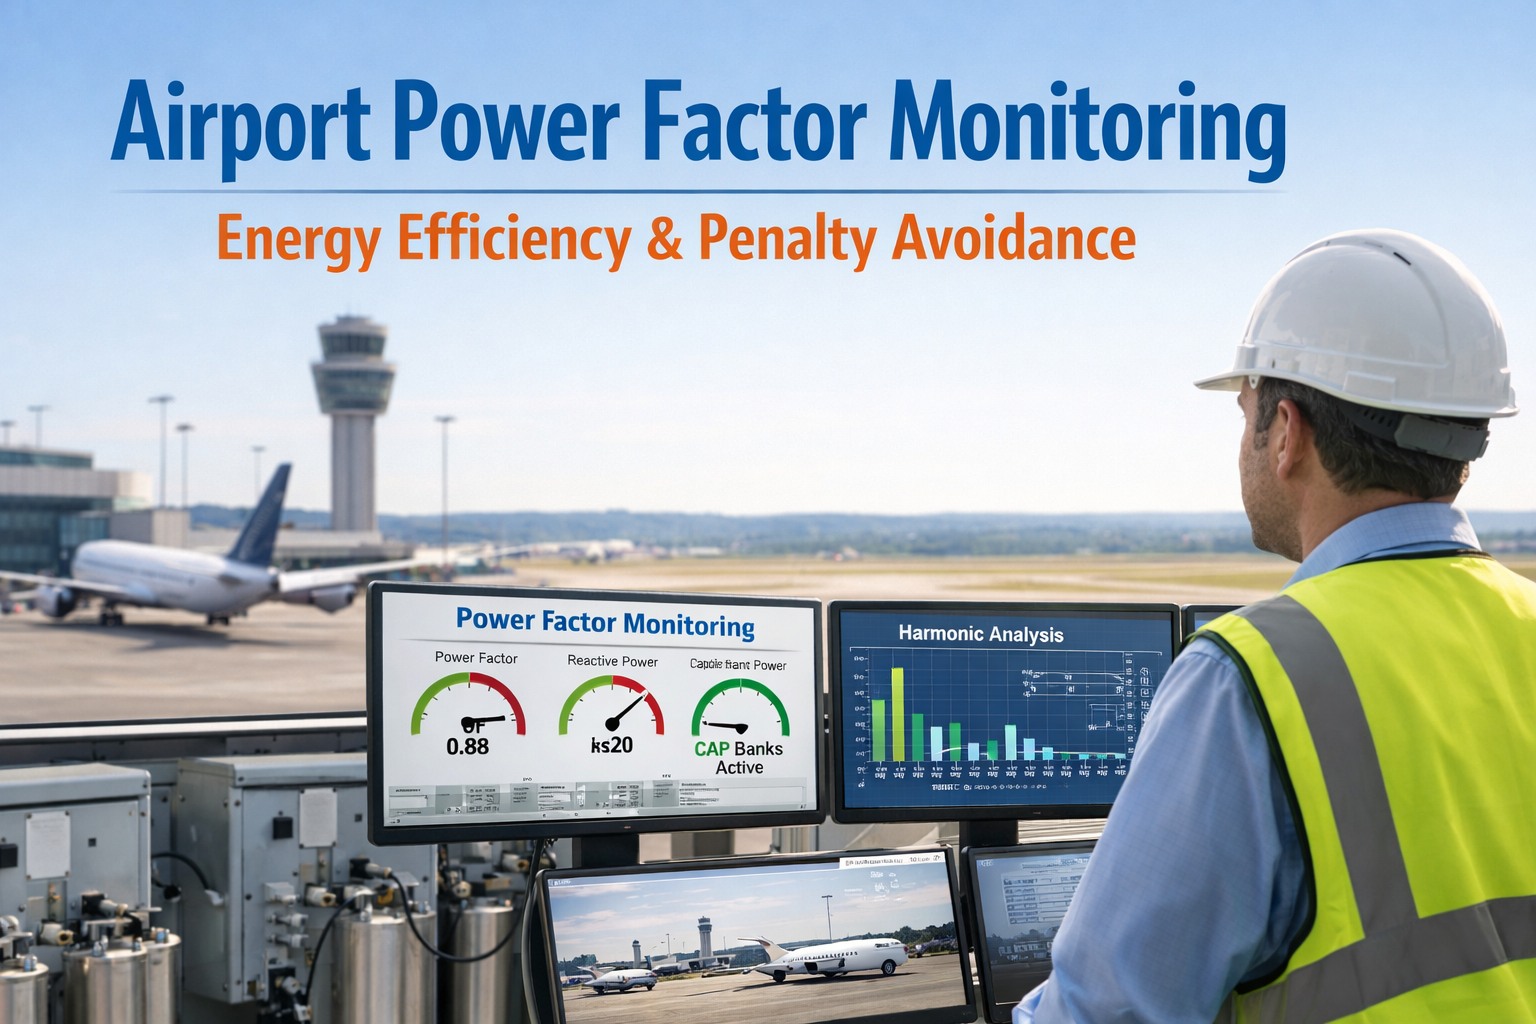
Airports consume up to 180 million kWh annually, with electrical systems powering everything from terminal HVAC to runway lighting. Poor power factor silently drains your budget through utility penalties that can exceed $100,000 per year—while failing capacitor banks and harmonic distortion threaten equipment reliability. Power factor monitoring transforms reactive power from a hidden cost into a controllable asset. Schedule a consultation to discover how real-time power factor intelligence can eliminate penalties and optimize your airport's electrical efficiency.
The Hidden Cost of Poor Power Factor
Every airport has two types of electrical loads: the real power that runs equipment and the reactive power that maintains magnetic fields in motors and transformers. When reactive power runs unchecked, utilities charge penalties that compound month after month.
Understanding the Power TriangleWhy reactive power costs you money
Real Power (kW)Does useful work—powers equipment
Reactive Power (kVAR)Sustains magnetic fields—you pay for it
Apparent Power (kVA)Total power the utility delivers
Power Factor = kW ÷ kVA
Annual Penalty Cost by Power FactorBased on 10 MW airport demand at $15/kW demand rate
0.70 PF
$128,000+
0.75 PF
$96,000
0.80 PF
$67,500
0.85 PF
$38,800
0.90 PF
$15,000
0.95 PF
$0
Most utilities require 0.85-0.95 power factor. Penalties calculated using kVA billing adjustment method.
Discover your penalty exposure. Create a free OXmaint account and our team will analyze your utility bills to calculate potential savings.
Real-time power factor monitoring provides visibility into electrical efficiency across every circuit, transformer, and load center in your airport—transforming reactive power from an invisible expense into actionable intelligence.
Power Factor Intelligence Dashboard
System Power Factor
Target: 0.95
Reactive Power
2,450
kVAR
12% vs last month
Penalty Avoided
$8,420
This Month
YTD: $67,360
Capacitor Status
Bank A: Online
Bank B: Online
Bank C: Degraded
The Three Pillars of Power Factor Management
Effective power factor optimization requires monitoring three interconnected systems. Neglecting any one creates blind spots that lead to penalties, equipment failures, and unexpected downtime.
01
Reactive Power Tracking
Continuous monitoring of kVAR across all circuits identifies which loads contribute most to poor power factor. Track reactive power trends by time of day, season, and operational mode.
Load profilingDemand patternsPeak analysis
02
Capacitor Bank Health
Real-time monitoring of capacitor bank performance detects degradation before failure. Track capacitance values, switching cycles, temperature, and current imbalance across all correction equipment.
Capacitance driftThermal monitoringCycle counting
03
Harmonic Analysis
VFDs, LED lighting, and electronic loads inject harmonic currents that cause resonance with capacitors. Monitor THD levels and individual harmonic frequencies to prevent equipment damage.
THD trendingSpectrum analysisResonance detection
See real-time power factor monitoring in action. Book a demo and we'll show you how leading airports optimize electrical efficiency.
Capacitor banks are your first line of defense against power factor penalties—but they degrade invisibly. By the time a failure becomes obvious, you've been paying penalties for months and face expensive emergency replacement.
Common Capacitor Bank Failure Modes
Harmonic Resonance
When system resonant frequency aligns with 5th or 7th harmonics, current amplifies 3-10x normal levels, causing rapid overheating and dielectric breakdown.
72°C
Thermal Stress
Operating above 55°C accelerates dielectric deterioration. Each 10°C rise above rated temperature cuts capacitor life in half.
Capacitance Degradation
Capacitance value drops 2-5% annually under normal conditions. Below 80% of rated value, correction becomes ineffective while energy losses increase.
847,000
Switching Fatigue
Contactors and capacitors have limited switching cycles. High-frequency on/off operation accelerates mechanical and electrical wear.
Harmonics: The Silent Capacitor Killer
Non-linear loads like VFDs, LED drivers, and UPS systems inject harmonic currents that interact dangerously with capacitor banks. Without harmonic monitoring, resonance conditions develop that destroy correction equipment.
Harmonic Spectrum AnalysisIEEE 519 recommends voltage THD below 5%
Fund.100%
3rd4%
5th18%
7th12%
9th6%
11th5%
13th3%
Total Harmonic Distortion
8.2%
Above IEEE 519 Limit
5th and 7th harmonics near capacitor resonance frequency. Risk of amplification.
Monitored vs. Unmonitored Systems
Without Monitoring
Penalties discovered on monthly bills
Capacitor failures cause sudden outages
Harmonic issues damage equipment silently
Reactive corrections based on guesswork
No visibility into degradation trends
$50K-150Kannual exposure from penalties and failures
With OXmaint Monitoring
Real-time power factor visibility
Predictive alerts before failures
Continuous harmonic spectrum analysis
Data-driven correction decisions
Automated maintenance scheduling
12-18 motypical ROI through penalty elimination
Airport Electrical Load Challenges
Airports present unique power factor challenges due to diverse load types, 24/7 operations, and critical reliability requirements. Understanding these challenges is the first step toward effective management.
Major Reactive Power Contributors
Load Type
Typical PF
Reactive Impact
Harmonic Risk
HVAC Systems
0.80-0.85
40-50% of reactive load
Low (VFDs increase risk)
Baggage Handling
0.75-0.82
High during peak operations
Moderate (motor drives)
Runway Lighting
0.90-0.95
Low but continuous
High (LED drivers)
Jet Bridges
0.70-0.80
Intermittent high spikes
Moderate
Terminal Electronics
0.95-0.98
Low reactive, high harmonic
High (switch-mode PSUs)
Ground Power Units
0.85-0.90
Variable by gate activity
High (power converters)
Take Control of Your Airport's Power Factor
OXmaint's power factor monitoring platform provides real-time visibility into reactive power, capacitor bank health, and harmonic distortion across your entire electrical infrastructure—enabling proactive correction that eliminates penalties and prevents equipment failures.
Power factor monitoring delivers measurable returns through penalty elimination, extended equipment life, and reduced energy losses. Most airports achieve full payback within 12-18 months.
$75K-150K
Annual Penalty Savings
Eliminate utility power factor surcharges through continuous optimization
2-3x
Extended Capacitor Life
Predictive maintenance prevents premature failures and emergency replacements
3-8%
Reduced Line Losses
Lower current flow means less energy wasted as heat in conductors
12-18
Months to Payback
Fast ROI with ongoing savings compounding year after year
Frequently Asked Questions
What power factor should our airport target?
Most utilities require 0.85-0.95 power factor to avoid penalties, with 0.95 being the optimal target for most facilities. Targeting above 0.98 risks leading power factor at light loads, which can also trigger penalties. Schedule a consultation for a utility bill analysis specific to your rate structure.
How quickly can we eliminate power factor penalties?
With monitoring in place, most airports identify the root causes of poor power factor within 30 days. Correction measures—whether optimizing existing capacitor banks or adding new correction equipment—typically show results on the next billing cycle.
What causes capacitor banks to fail prematurely?
The primary causes are harmonic resonance, thermal stress, and excessive switching cycles. Harmonic currents from VFDs and electronic loads are particularly dangerous—if the system resonant frequency aligns with the 5th or 7th harmonic, current can amplify 3-10x, destroying capacitors within months. Continuous monitoring detects these conditions before damage occurs.
Can monitoring integrate with our existing BMS or SCADA system?
Yes. OXmaint connects with major building management and SCADA platforms through standard protocols including Modbus, BACnet, and OPC-UA. Power factor data flows directly into your existing dashboards while also being available through the OXmaint platform. Sign up for a free account to explore integration options.
How do we know if harmonics are affecting our capacitor banks?
Warning signs include unexplained fuse failures, capacitor overheating, audible humming from capacitor banks, and voltage THD exceeding 5%. However, the only reliable method is continuous harmonic monitoring that tracks individual harmonic frequencies and identifies resonance conditions before they cause damage.
Stop Paying Penalties for Power You Don't Use
Your airport deserves electrical intelligence that matches its operational complexity. OXmaint delivers real-time power factor monitoring, capacitor health tracking, and harmonic analysis in one integrated platform—transforming reactive power from a hidden cost into optimized efficiency.