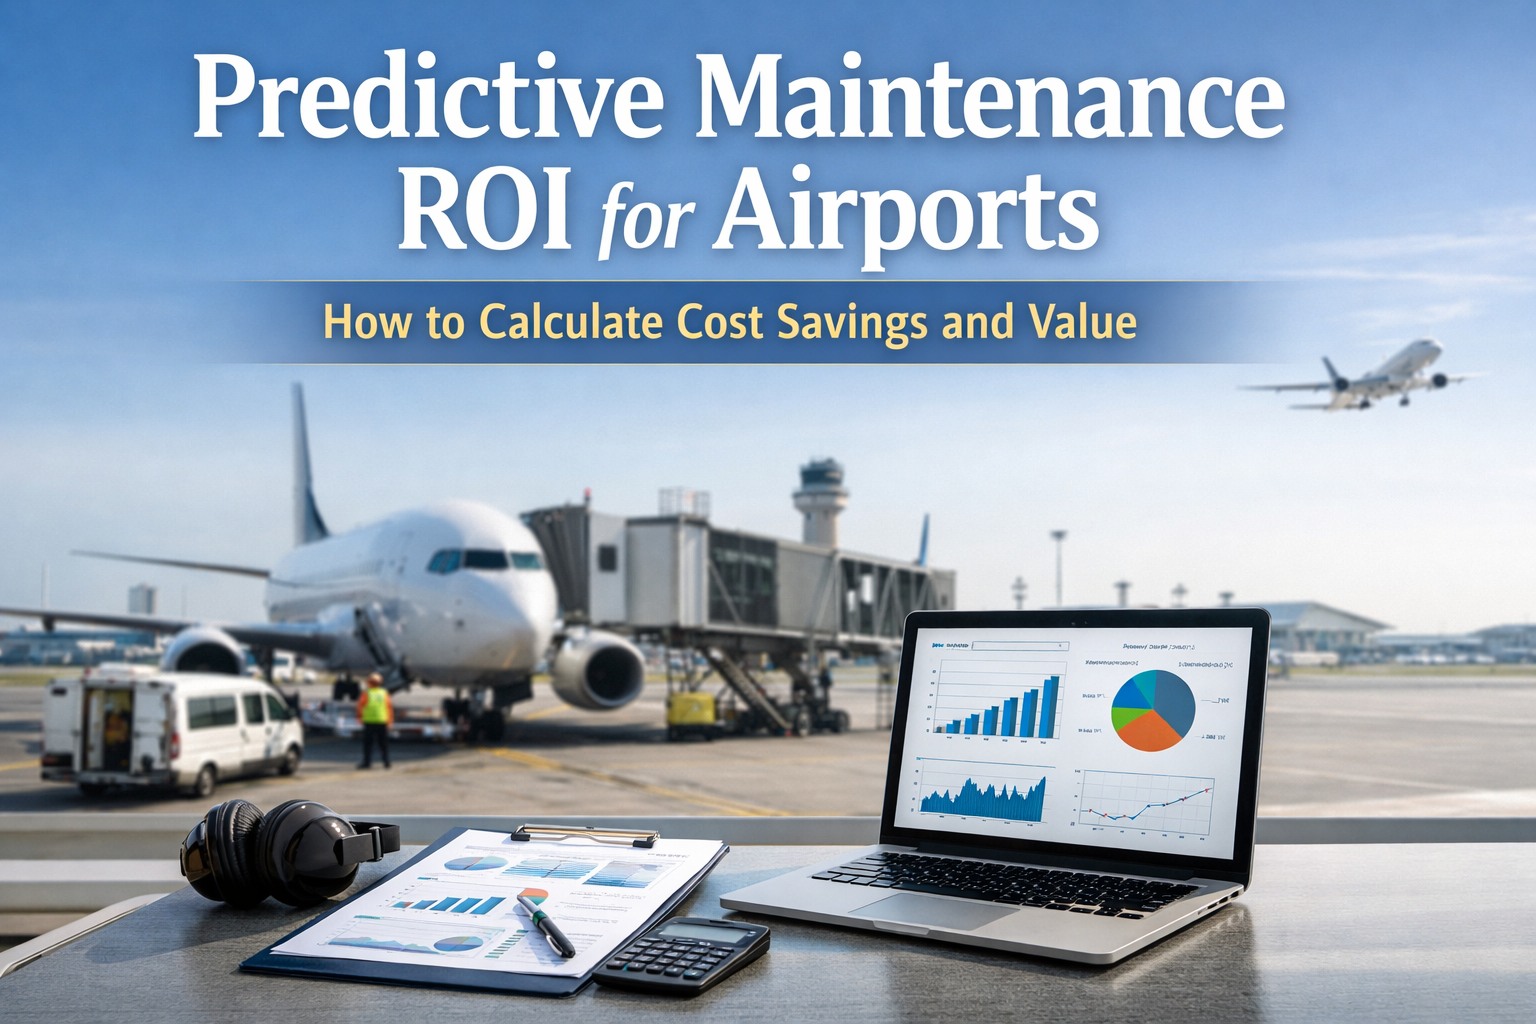
Predictive Maintenance ROI for Airports: How to Calculate Cost Savings and Value
By David Cook on January 30, 2026
Howdo you justify a predictive maintenance investment when competing for capital against terminal expansions, runway projects, and passenger experience upgrades? The answer lies in building a bulletproof financial case. Research shows predictive maintenance delivers 10:1 ROI on average, with 25-40% reduction in maintenance costs and up to 50% decrease in unplanned downtime. This guide provides the step-by-step methodology airport CFOs and finance directors need to calculate, document, and present the true financial value of predictive maintenance—transforming what leadership sees as a cost center into a measurable profit driver. Schedule a consultation to build your customized business case.
The ROI Formula
Calculating predictive maintenance ROI follows a straightforward formula, but the real work lies in accurately quantifying both sides of the equation. Start with the fundamentals, then layer in the comprehensive cost categories that most business cases miss.
Before calculating potential savings, you need accurate baseline data on current maintenance spending. This becomes your "before" snapshot against which all improvements are measured. Gather 12-24 months of historical data for statistical validity.
Essential Baseline Metrics
Unplanned Downtime Costs
Number of unplanned equipment failures per year
Average duration of each failure event
Direct cost per hour of downtime
Revenue impact from operational disruptions
Passenger compensation and rebooking costs
Maintenance Labor Costs
Total maintenance labor hours annually
Fully-loaded hourly labor rate
Overtime and emergency call-out premiums
Contractor and outsourced labor spending
Time spent on diagnostic troubleshooting
Parts & Inventory Costs
Annual spare parts expenditure
Safety stock inventory carrying costs
Emergency parts expediting fees
Obsolete inventory write-offs
Storage and handling costs
Equipment & Asset Costs
Current asset replacement schedule
Depreciation rates by equipment type
Historical equipment lifespan data
Capital expenditure forecast
Warranty claim history
Step 2: Quantify Financial Benefits
Predictive maintenance generates value across multiple categories. The most compelling business cases capture both direct savings and indirect benefits that compound over time.
Downtime Reduction
Highest Impact
Unplanned downtime is typically the largest cost component. Airport equipment downtime costs $100-166 per minute for direct operational impact, plus downstream effects on passenger experience and airline relationships.
Get a customized ROI projection. Schedule a consultation and our team will analyze your airport's specific data to build a comprehensive financial model.
A credible business case includes all implementation and ongoing costs. Underestimating costs undermines credibility with finance leadership and sets unrealistic expectations.
Total Cost of Ownership Components
Year 1 Costs (CAPEX + Setup)
IoT Sensors & Hardware
$200 - $500 per asset
Software Platform License
$15,000 - $50,000/year
Installation & Integration
$10,000 - $30,000
Staff Training
$5,000 - $15,000
Project Management
$10,000 - $25,000
Consulting & Configuration
$5,000 - $20,000
Ongoing Costs (Annual OPEX)
Software Subscription
$15,000 - $50,000/year
Sensor Replacement (5%/year)
$2,000 - $10,000/year
Connectivity (cellular/WiFi)
$1,000 - $5,000/year
System Administration
0.1 - 0.25 FTE
Ongoing Training
$2,000 - $5,000/year
Support & Maintenance
15-20% of license
Step 4: Build the Financial Model
Present your analysis using financial metrics that resonate with CFOs and finance committees. A multi-year projection demonstrates how ROI compounds as the system matures and predictive accuracy improves.
CFOs and finance committees evaluate investments using specific financial frameworks. Present your business case using these metrics to speak their language.
Return on Investment (ROI)
The percentage return relative to investment. Target: 200%+ for technology investments to compete effectively against other capital allocation opportunities.
ROI = (Net Benefits ÷ Total Costs) × 100
Payback Period
Months until cumulative benefits exceed cumulative costs. Target: Under 18 months for most airport technology investments.
Payback = Total Investment ÷ Monthly Net Benefit
Net Present Value (NPV)
The present value of future cash flows minus initial investment. Positive NPV indicates a value-creating investment. Use your organization's discount rate (typically 8-12%).
All costs over the investment lifecycle including acquisition, operation, maintenance, and disposal. Compare TCO against baseline maintenance costs to show true savings.
Finance leaders and aviation industry experts validate the financial case for predictive maintenance investments in airport operations.
"The ROI case for predictive maintenance was stronger than any technology investment we'd evaluated. We achieved payback in under 6 months, and the ongoing savings now fund continuous improvements across our operations budget."
Patricia Williams
Chief Financial Officer
Regional Airport Authority
5.8 moPayback achieved
"What convinced our board was the CAPEX deferral story. By extending equipment life 30%, we pushed back $4.2 million in replacement costs—that's capital we redirected to passenger experience improvements."
David Chen
VP of Finance & Planning
International Airport Group
$4.2MCAPEX deferred
"The U.S. Department of Energy data showing 10:1 ROI potential is consistent with what we see in airport implementations. The key is starting with high-impact assets and proving value before scaling—that's how you build a compelling multi-year investment case."
Dr. Robert Martinez
Aviation Infrastructure Economist
Industry Research Firm
10:1Validated ROI ratio
Build Your Custom Financial Model
OXmaint's team works with airport finance leaders to develop comprehensive ROI analyses tailored to your specific operations, asset base, and financial requirements. Get the data-driven business case you need to secure investment approval.
How long does it take to see positive ROI from predictive maintenance?
Most airport implementations achieve payback within 12-18 months, with some seeing positive ROI in as little as 4-6 months. The timeline depends on your baseline costs, asset criticality, and implementation scope. Starting with high-impact assets—equipment where failures cause the most expensive disruptions—accelerates time to value. Schedule a consultation to get a customized payback projection for your operation.
What data do I need to calculate our potential ROI?
The essential data includes: current annual maintenance spending, number and cost of unplanned equipment failures, average downtime duration and hourly cost, labor rates and utilization, and spare parts inventory costs. Historical data from 12-24 months provides the best baseline. If you don't have complete data, our team can help you establish reasonable estimates based on industry benchmarks.
How do I justify this investment against other capital priorities?
Predictive maintenance investments typically deliver faster payback and higher ROI than infrastructure projects. Frame it as an enabler that protects other investments—a new terminal or runway delivers less value if equipment failures cause operational disruptions. The key is presenting predictive maintenance as risk mitigation and operational optimization, not just a technology purchase.
Should we pilot first or implement across all assets?
We strongly recommend starting with a pilot on 10-20 critical assets. This approach proves ROI with lower initial investment, generates real data for scaling decisions, builds internal expertise, and creates champions for broader rollout. Use pilot results to build the business case for full implementation. Sign up for a free account to explore pilot options.
What's a realistic ROI percentage to present to leadership?
Industry research consistently shows 200-500% ROI for well-implemented predictive maintenance programs, with some achieving 10:1 returns. For a conservative business case that maintains credibility, we recommend projecting 150-250% first-year ROI, with higher returns in subsequent years as the system matures. Always show your assumptions and methodology—finance leaders respect transparency.
Turn Maintenance from Cost Center to Profit Driver
Predictive maintenance delivers measurable financial returns that compound year over year. OXmaint provides the platform, analytics, and expertise to help airport finance leaders build compelling business cases and achieve documented ROI.