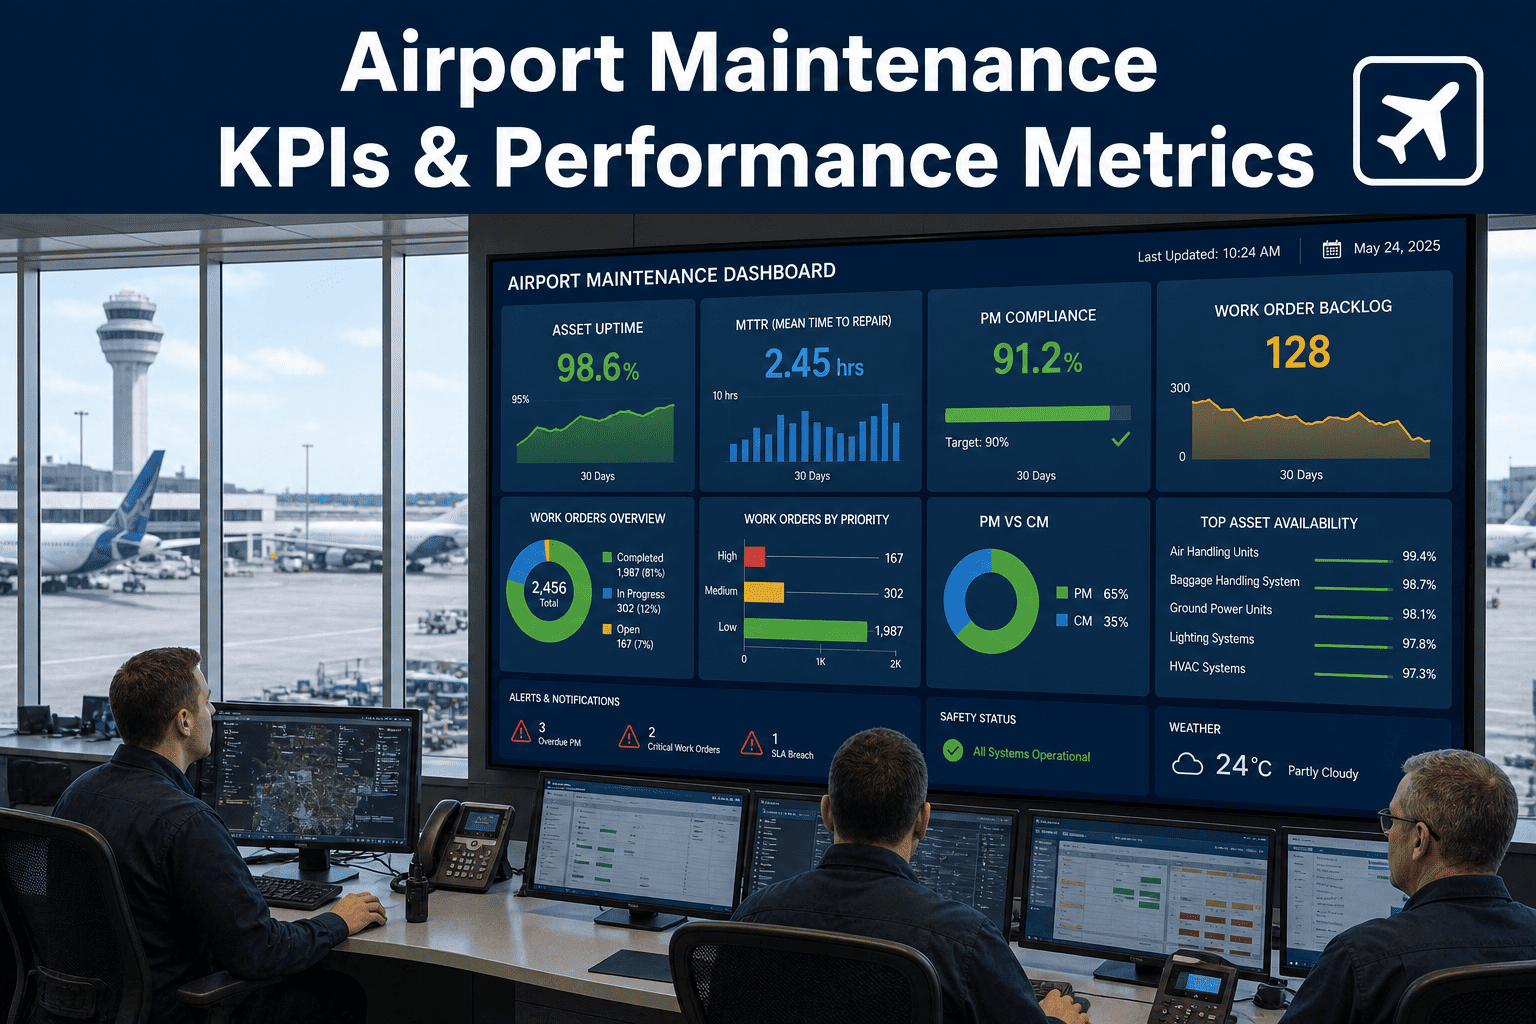
Aviation maintenance managers are buried in data — work orders, inspection records, parts requests, asset histories — but most still cannot answer the question their VP of Operations asks on Monday morning: "Are we ahead of failures or behind them?" A KPI dashboard does not add more data to the pile. It extracts the six or eight numbers that actually tell you whether your maintenance operation is working or drifting toward the next emergency. See how Oxmaint's aviation maintenance dashboard surfaces those numbers automatically.
Article · Aviation KPIs · Maintenance Dashboard · Airport Analytics
How to Build an Aviation Maintenance KPI Dashboard
The metrics that actually matter, how to structure them for operational and executive audiences, and how modern CMMS platforms automate the entire reporting layer for aviation maintenance teams.
68%
Of maintenance managers cannot report MTTR within 24 hours of request (Gartner)
3.2×
Faster problem identification for teams using structured KPI dashboards vs ad-hoc reporting
$4.7M
Average annual cost of poor maintenance visibility for mid-size airport operations (ACI data)
40%
Reduction in reactive work when maintenance teams track PM compliance weekly (Plant Engineering)
What Is an Aviation Maintenance KPI Dashboard?
An aviation maintenance KPI dashboard is a structured reporting interface that translates raw work order, asset, and inspection data into a small set of operational and financial metrics — tracked over time, updated in near-real-time, and visible to both maintenance managers and executive stakeholders. The best dashboards do two things simultaneously: they tell technicians what needs attention today, and they tell directors whether the maintenance programme is trending toward reliability or toward crisis.
In aviation contexts, KPI dashboards carry additional weight because performance metrics are often tied to regulatory compliance, airline service level agreements, and airport authority reporting requirements. EASA Part-145 organisations, FAA Part-145 repair stations, and airports with ICAO Annex 14 obligations need documented evidence that maintenance activities are being tracked, performed, and reviewed systematically — a KPI dashboard is the operational backbone of that evidence trail.
Modern CMMS platforms like Oxmaint auto-populate maintenance KPIs from work order data, inspection records, and asset condition scores — eliminating the manual spreadsheet assembly that consumes 4–6 hours of a maintenance coordinator's week in most airports without integrated systems. Start a free trial to see your aviation maintenance KPIs automatically calculated, or book a demo to walk through a live dashboard built for your operation.
Teams that review maintenance KPIs weekly catch performance degradation 6–8 weeks before it becomes a compliance or operational failure.
The 8 KPIs Every Aviation Maintenance Dashboard Needs
KPI 01
Asset Uptime (%)
Percentage of scheduled operational hours where each asset was available and functional. Track by asset class and terminal zone. Target: 97%+ for critical airside equipment.
KPI 02
PM Compliance Rate (%)
Percentage of scheduled preventive maintenance tasks completed on time vs overdue. A compliance rate below 85% predicts rising reactive work within 60–90 days. Target: 92%+.
KPI 03
Mean Time to Repair (MTTR)
Average elapsed time from work order creation to completion for corrective maintenance. Measures technician efficiency and parts availability. Track separately for airside vs landside.
KPI 04
Mean Time Between Failures (MTBF)
Average operational time between failure events per asset or asset class. Rising MTBF signals improving reliability; declining MTBF signals an asset approaching end-of-life or a PM programme gap.
KPI 05
Reactive Work Order Ratio (%)
Reactive (unplanned) work orders as a percentage of total work orders. World-class maintenance organisations target below 20%. Above 40% indicates a reactive-dominant programme with predictable cost and reliability consequences.
KPI 06
Work Order Backlog (Days)
Total open work order volume expressed as estimated completion days against current crew capacity. A growing backlog predicts declining PM compliance within 30–45 days — a leading indicator, not a lagging one.
KPI 07
Maintenance Cost per Asset
Total maintenance spend (labour + parts + contractor) divided by asset count, tracked monthly. Useful for comparing asset class cost profiles and identifying assets where replacement is more economical than continued repair.
KPI 08
Inspection Pass Rate (%)
Percentage of inspections completed with all items passed vs flagged. Declining pass rates in specific asset classes are early signals of broader condition deterioration requiring PM programme adjustment.
Why Most Aviation Maintenance Dashboards Fail — 4 Critical Pain Points
⚠
KPIs Built on Stale Manual Data
When maintenance records live in spreadsheets, whiteboards, and paper logs, KPI reports are already 48–72 hours old before they reach a manager's desk. Decisions are made on last week's reality, not today's asset condition.
⚠
No Separation of Operational vs Executive Views
Technicians need task-level detail — what work order is due today, which parts are on order, which inspection is overdue. Directors need trend lines and financial summaries. A single dashboard serving both audiences serves neither well.
⚠
Lagging Indicators Without Leading Indicators
Most aviation maintenance dashboards report what already happened — MTTR, repair costs, failure counts. Without leading indicators (PM backlog, asset health scores, overdue inspections), there is no early warning system built into the reporting layer.
⚠
No Cross-Terminal or Multi-Site Aggregation
Airport groups managing multiple terminals or satellite facilities often have siloed maintenance data across separate systems or spreadsheets. Portfolio-level KPIs are assembled manually, consuming hours of coordinator time and producing inconsistent results.
How Oxmaint Builds Your Aviation KPI Dashboard Automatically
Auto-Calculated KPIs from Live Work Order Data
Oxmaint calculates MTTR, MTBF, PM compliance, reactive work ratio, and backlog automatically from work order timestamps and completion records — no manual calculation, no spreadsheet assembly. KPIs update as work orders close.
Dual-View Dashboard Architecture
Operations view shows today's open work orders, overdue PMs, and asset alerts for technicians and coordinators. Executive view shows trending KPIs, cost summaries, and compliance rates for directors and VPs — both from the same data source.
Asset Health Scores as Leading Indicators
Oxmaint's condition scoring system provides leading indicator data — assets trending toward degradation appear in the dashboard before they generate a failure event, giving managers 2–8 weeks of advance visibility.
Multi-Terminal and Multi-Site Portfolio Roll-Up
Airport groups see KPIs aggregated across all terminals and facilities in one portfolio view — with the ability to drill down to individual sites, asset classes, or specific equipment. No manual data assembly across separate systems.
Scheduled KPI Reports for Executive Distribution
Weekly or monthly KPI summaries can be scheduled for automatic email delivery to directors, VP Operations, and airport authority contacts — formatted for executive consumption without requiring CMMS access.
OEE Dashboard for High-Utilisation Equipment
For baggage handling systems, conveyor networks, and other high-cycle airport equipment, Oxmaint provides OEE (Overall Equipment Effectiveness) tracking — combining availability, performance, and quality metrics into a single reliability score.
Reactive Reporting vs Predictive Dashboard — What Changes
| Dashboard Element |
Reactive / Manual Approach |
Oxmaint Live Dashboard |
| Data freshness |
48–72 hours old (manual entry lag) |
Live — updates as work orders open and close |
| KPI calculation |
Manual spreadsheet formulas; errors common |
Auto-calculated from work order timestamps and records |
| Leading indicators |
Not tracked; only lagging metrics available |
Asset health scores, PM backlog, overdue inspections visible in real time |
| Executive reporting |
Manual assembly 4–6 hrs/week; often delayed |
Scheduled auto-export to director and VP distribution list |
| Multi-site view |
Each terminal or facility reported separately |
Portfolio roll-up across all terminals; drill-down to asset level |
| Compliance tracking |
PM schedule vs completion tracked manually; gaps missed |
PM compliance % auto-tracked with overdue alerts and trend lines |
KPI Dashboard ROI — What Aviation Teams Actually Report
6 hrs
Per Week Saved on Manual Reporting
Time recovered by maintenance coordinators when KPI calculation is automated by CMMS (avg. Oxmaint customer)
93%
PM Compliance Achieved
Airports tracking PM compliance weekly in Oxmaint vs 63% baseline before dashboard implementation
−38%
Reactive Work Order Volume
Reduction in reactive work orders within 12 months of structured KPI tracking and weekly review cadence
2.8 wks
Earlier Failure Detection
Average lead time improvement between problem identification and failure when asset health KPIs are reviewed regularly
Aviation teams that shift from spreadsheet-based to live CMMS dashboards see measurable improvements in PM compliance, reactive work reduction, and maintenance cost within the first quarter — start a free trial to experience this shift on your own asset data, or book a demo to see a live KPI dashboard built for your operation.
Frequently Asked Questions
What are the most important KPIs for an airport maintenance dashboard?
For operational management, the highest-priority KPIs are PM Compliance Rate (early warning of programme drift), Reactive Work Order Ratio (indicates whether you are ahead of or behind failures), and Work Order Backlog (predicts upcoming PM compliance decline). For executive and financial reporting, Asset Uptime %, Maintenance Cost per Asset, and MTTR are the most useful. The critical distinction is leading vs lagging indicators — most aviation maintenance operations over-report lagging metrics (what went wrong) and under-report leading metrics (what is about to go wrong).
How does Oxmaint calculate MTTR and MTBF automatically?
Oxmaint uses work order timestamps — creation time (failure or fault reported), assignment time, and completion time — to calculate MTTR automatically for every corrective work order. MTBF is calculated from the time gap between consecutive failure events on the same asset ID, accumulated across work order history. Both metrics are available per asset, per asset class, per terminal zone, and across the full portfolio — filterable by date range, priority level, and asset category. No manual calculation or spreadsheet formulas are required.
Can Oxmaint KPI dashboards support regulatory compliance reporting for EASA or FAA Part-145 requirements?
Yes. Oxmaint's work order records, inspection completion data, and technician certifications are stored with full audit trails meeting EASA Part-145 and FAA Part-145 documentation requirements. KPI reports can be exported in PDF and CSV formats for inclusion in regulatory submissions, compliance audits, and quality assurance reviews. The system supports defect recording, certification of release to service (CRS) workflows, and maintenance organisation exposition (MOE) documentation requirements. Australian CASA and UK CAA maintenance record requirements are also supported.
How long does it take to set up an aviation maintenance KPI dashboard in Oxmaint?
The core KPI dashboard is live from day one of Oxmaint deployment — asset uptime, PM compliance, and work order metrics populate automatically as the first work orders are entered. The richest KPI data (MTBF trends, cost per asset, OEE scores) accumulates over 30–90 days as work order history builds. Most Oxmaint aviation customers have a fully operational executive dashboard within 3 weeks of go-live. The platform does not require a separate BI tool, data warehouse, or custom dashboard development — KPIs are built into the CMMS reporting layer.
OXMAINT AVIATION MAINTENANCE DASHBOARD
See Your Aviation Asset ROI in 30 Minutes
Stop assembling KPI reports manually every week. Oxmaint auto-calculates every aviation maintenance metric — MTTR, PM compliance, reactive work ratio, asset uptime — and delivers them in a live dashboard visible to both operations teams and executive stakeholders.
✔ Live KPI dashboard — no manual spreadsheet assembly
✔ Multi-terminal and multi-site portfolio roll-up
✔ Scheduled executive reports delivered automatically
No heavy implementation required · Works across multi-site portfolios · Live in days, not months