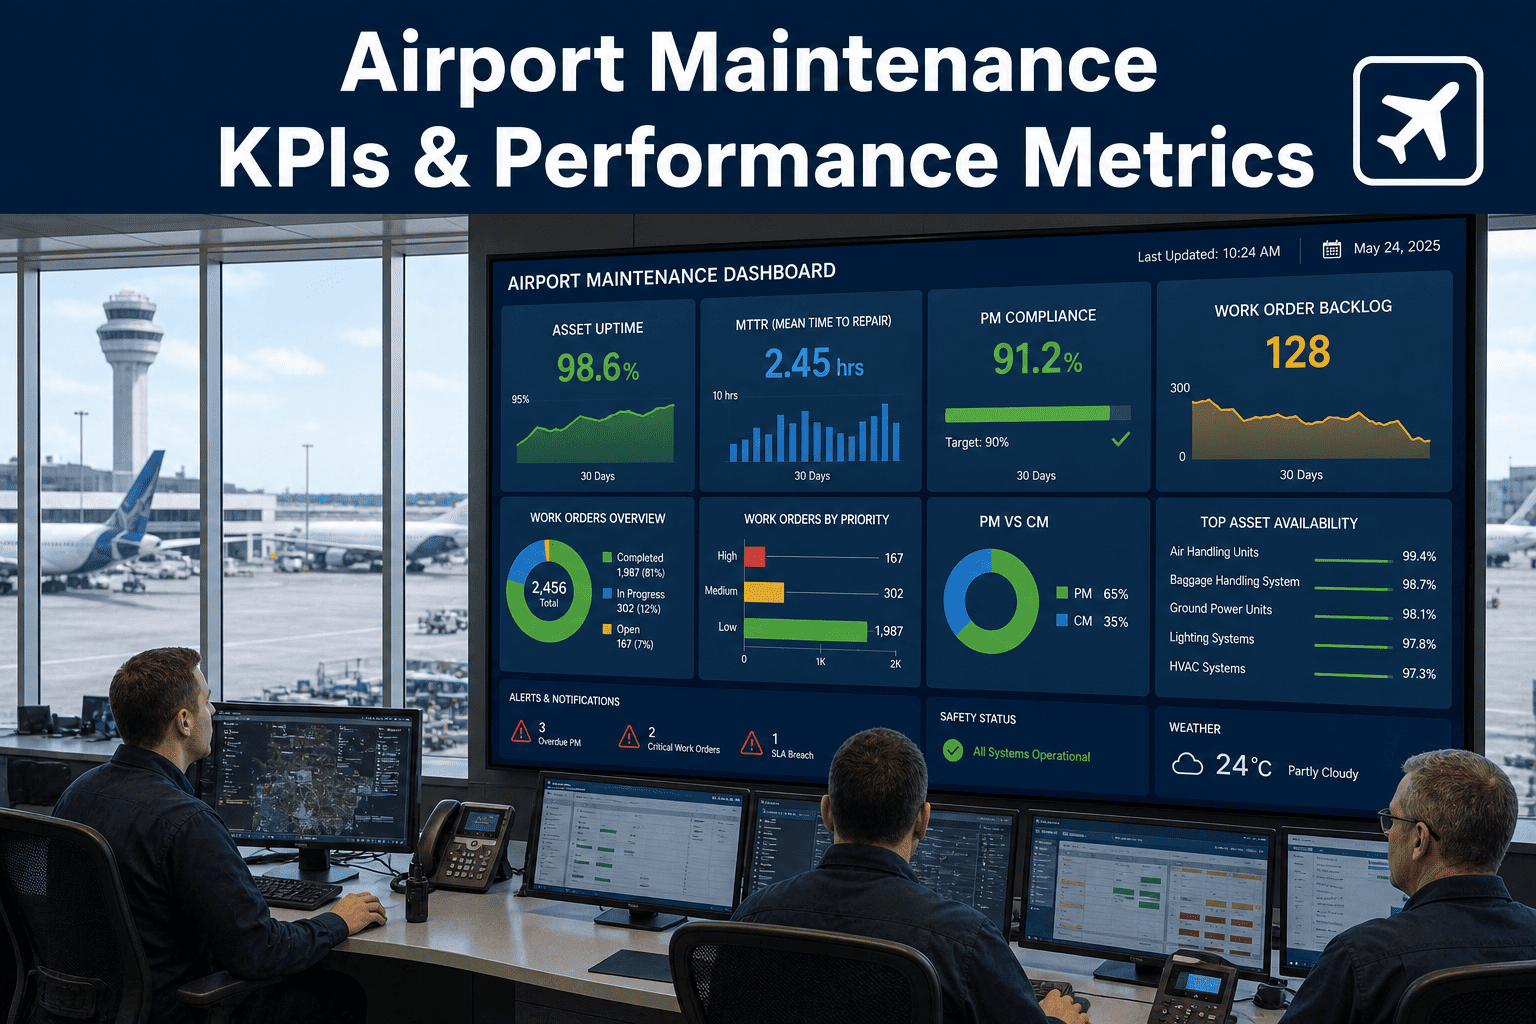
An airport maintenance operation generates thousands of work orders, hundreds of asset failures, and millions in operating costs every year—but without the right KPIs tracked in a CMMS, none of that data turns into actionable intelligence. Facility managers who track uptime by terminal zone, MTTR by asset class, PM compliance by crew, backlog by priority level, and cost per passenger through their terminals make decisions based on evidence instead of urgency. The airports that run leanest aren't working harder—they're measuring smarter and using CMMS dashboards to catch problems before they cascade into delays, passenger complaints, or regulatory findings. Start a free trial to build your airport KPI dashboard.
Stop Managing Airports on Gut Feel. Start Tracking KPIs That Drive Performance.
OxMaint gives airport operations teams pre-built KPI dashboards that track uptime, MTTR, PM compliance, backlog, labor hours, and cost per passenger in real time. Turn maintenance data into decisions that reduce costs, improve reliability, and keep terminals running.
18
Core Airport KPIs
Tracked in OxMaint across operations, reliability, compliance, and cost
73%
Airports Miss PM Targets
Industry benchmark showing majority fail to hit 90% PM completion rate
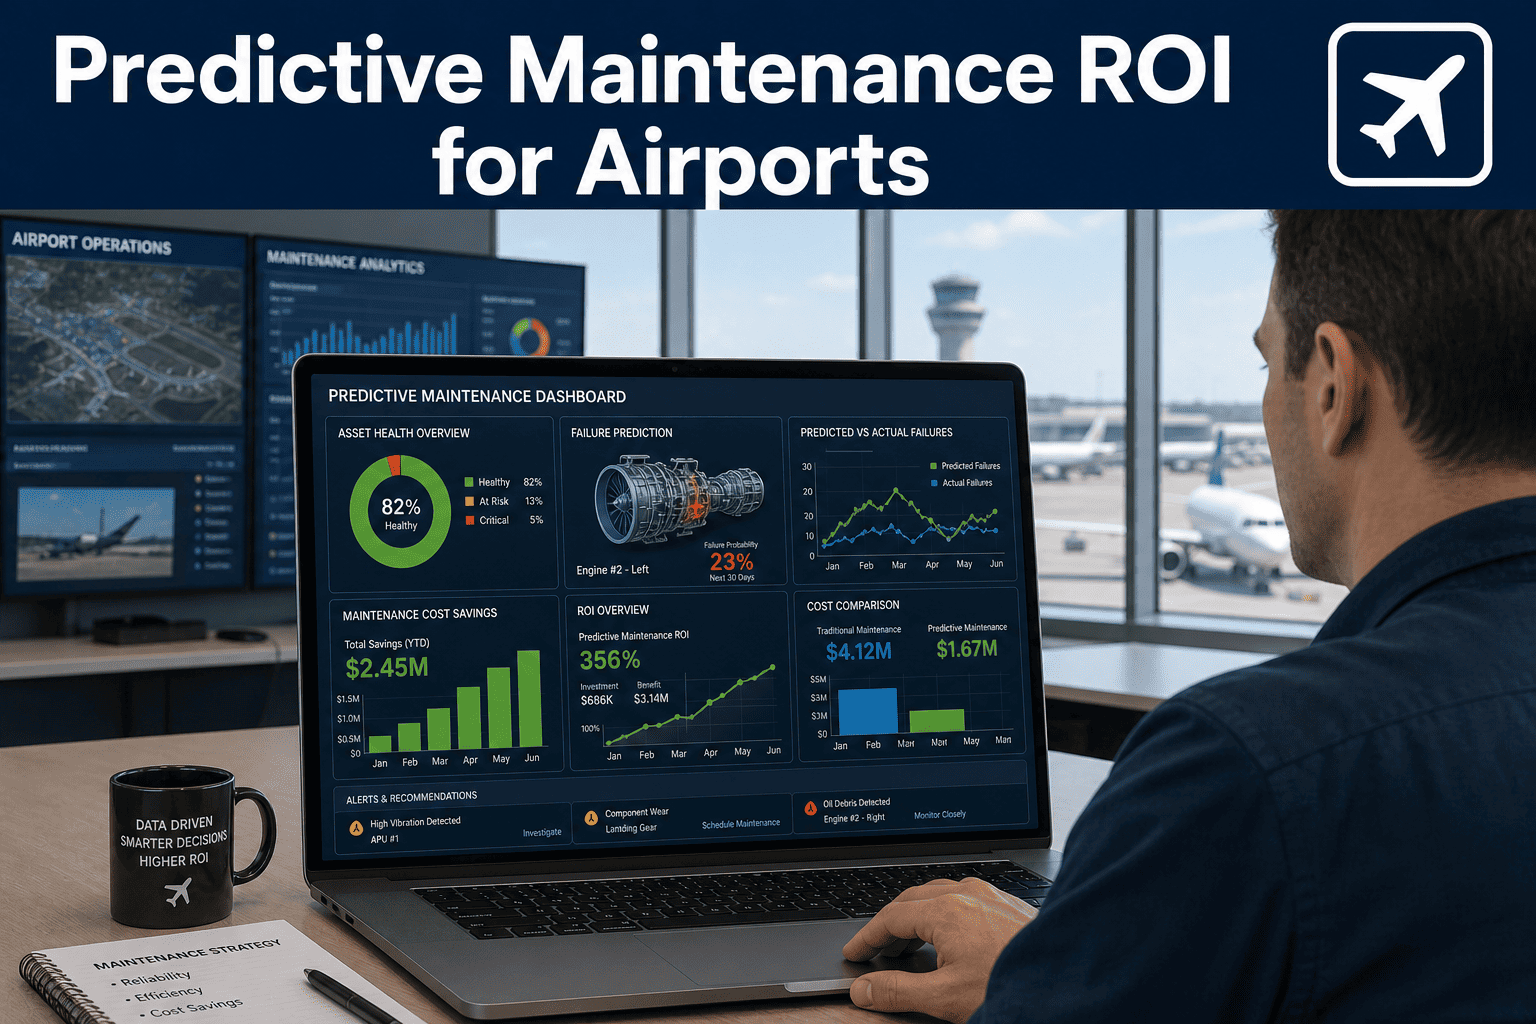
4.8x
Emergency Repair Cost
Reactive maintenance costs versus planned preventive work
$2.40
Maintenance Cost Per PAX
Industry average annual maintenance spend per passenger throughput
Why Airport KPIs Matter More Than Other Facilities
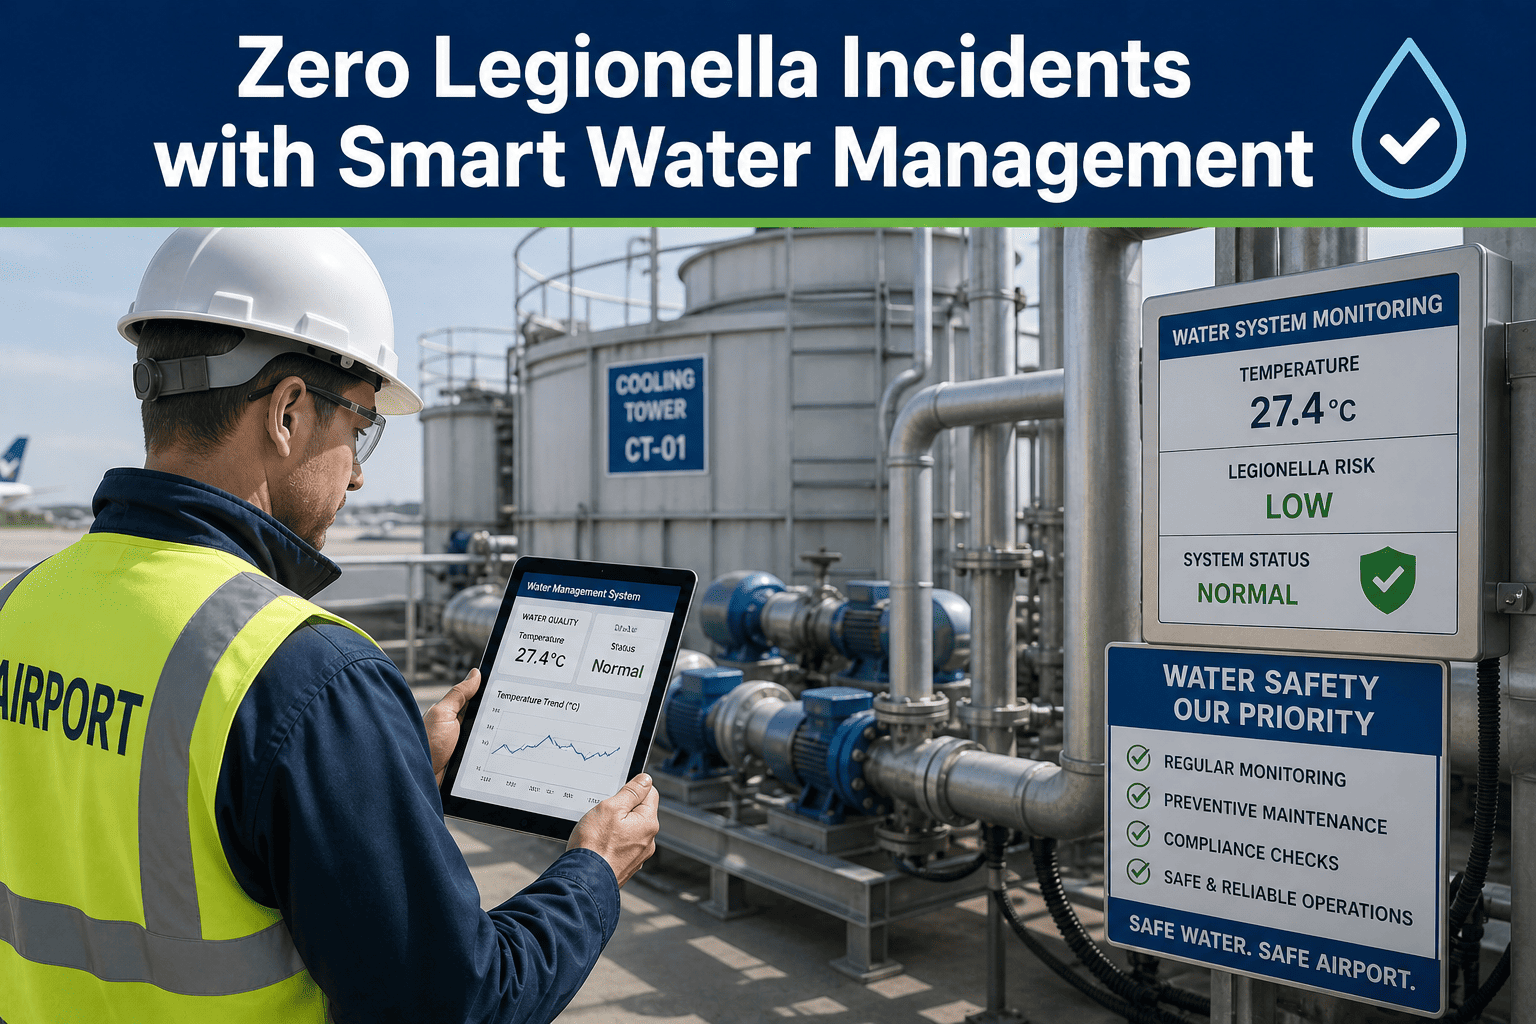
Unlike office buildings or warehouses, airports operate under constant regulatory oversight, passenger safety scrutiny, and revenue pressure from airlines. A baggage handling system failure costs $4,000 per hour in airline penalties. An HVAC outage in a terminal during peak summer travel triggers passenger complaints and media coverage. A jet bridge malfunction delays departures and cascades into missed connections across the network. Airport maintenance teams need KPIs that flag these risks before they become incidents—and that means tracking performance at the asset class, location zone, and technician crew level, not just facility-wide averages. Book a demo to see airport-specific KPI tracking.
Operational Performance KPIs
Measure how effectively your maintenance operation is running day-to-day, focusing on response times, completion rates, and technician productivity.
Work Order Completion Rate
Mean Time to Repair (MTTR)
Schedule Compliance %
Labor Hours per Work Order
Asset Reliability KPIs
Track equipment health and failure patterns to shift from reactive to preventive maintenance across critical airport systems.
Mean Time Between Failures (MTBF)
Asset Uptime by System
PM Compliance Rate
Emergency Work Order %
Cost Control KPIs
Monitor spend efficiency across labor, parts, and contractors to keep maintenance budgets aligned with passenger throughput and revenue.
Maintenance Cost per Passenger
Parts Inventory Turnover
Contractor vs In-House Ratio
Cost per Asset by Class
Compliance & Safety KPIs
Ensure inspection schedules, safety checks, and regulatory documentation stay current across terminals, runways, and passenger areas.
Inspection Completion Rate
Overdue Work Order Backlog
Safety Incident Rate
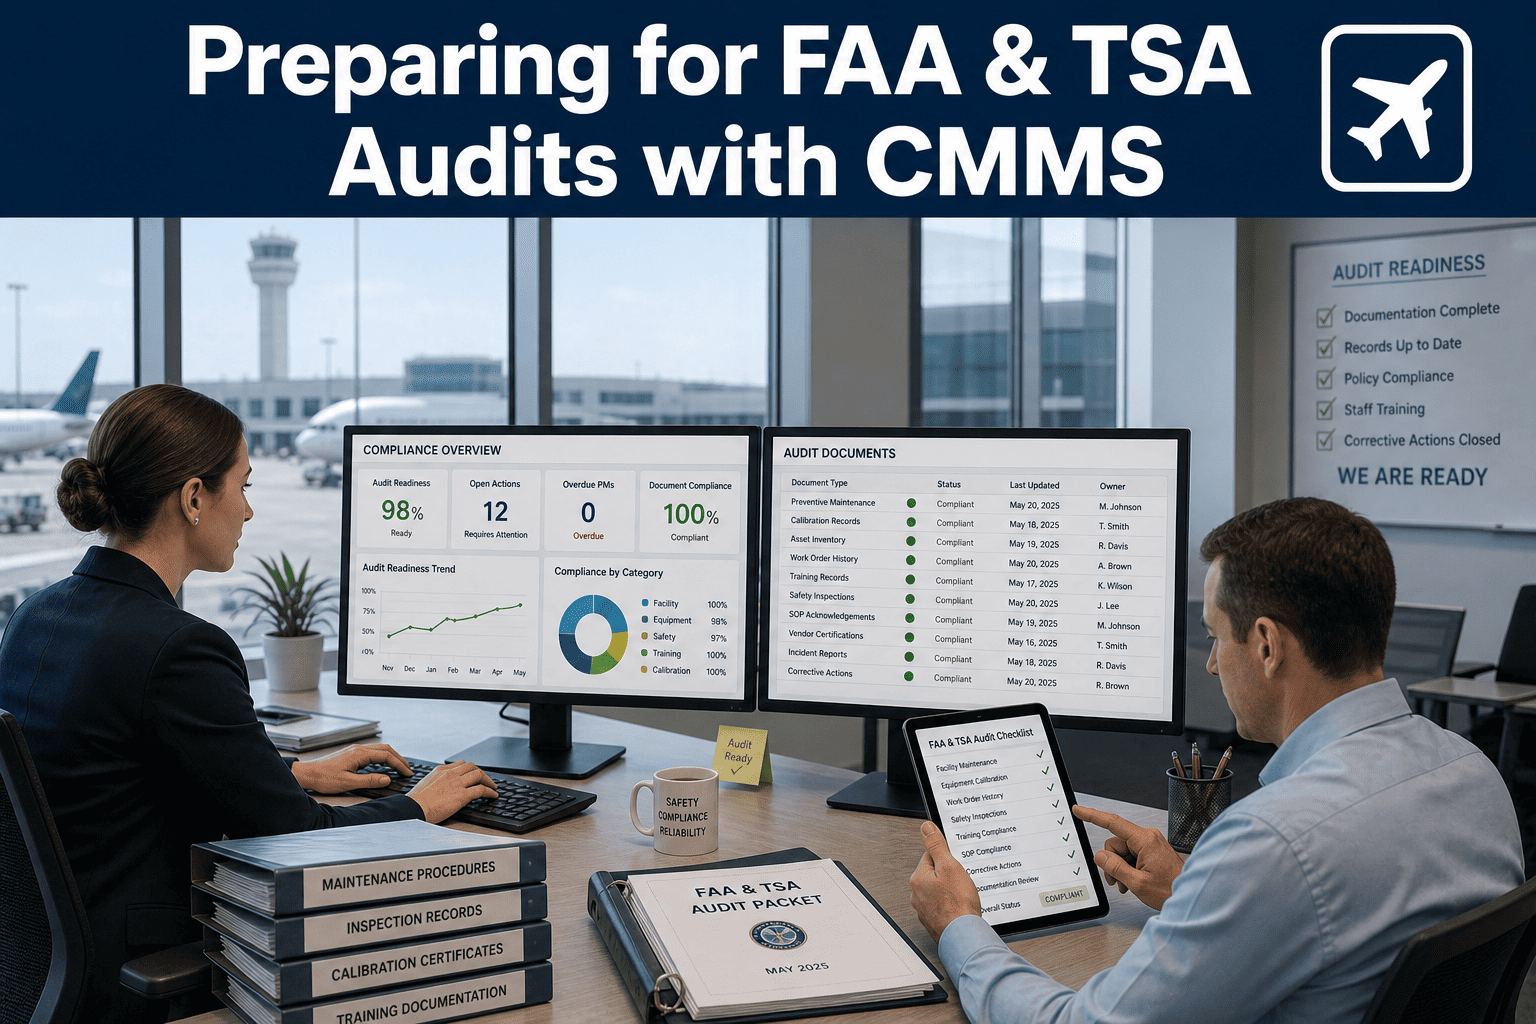
Audit Readiness Score
The 8 Critical Airport Maintenance KPIs to Track in Your CMMS
1
PM Compliance Rate
Formula: (Completed PMs / Scheduled PMs) × 100
Target: ≥90% across all asset classes
Why it matters: Every missed PM increases the probability of emergency failures. Airports running above 90% see 40% fewer reactive work orders than those below 75%.
2
Mean Time to Repair (MTTR)
Formula: Total repair time / Number of repairs
Target: <2 hours for critical systems (HVAC, baggage, jet bridges)
Why it matters: MTTR directly impacts passenger experience and airline penalties. A 3-hour baggage system repair costs $12K in airline SLA violations.
3
Asset Uptime by Zone
Formula: (Operating hours / Total hours) × 100 per terminal/concourse
Target: ≥99.5% for passenger-facing systems
Why it matters: Zone-level tracking catches localized failures—like Gate A concourse escalators failing more than B concourse—so you fix root causes, not symptoms.
4
Work Order Backlog
Formula: Number of open work orders >7 days old
Target: <5% of total active work orders
Why it matters: Backlog buildup signals understaffing, poor scheduling, or parts delays. Airports with >10% backlog see twice as many emergency failures.
5
Maintenance Cost per Passenger
Formula: Total maintenance spend / Annual passenger throughput
Target: $1.80-$2.60 depending on terminal age and asset mix
Why it matters: Normalizes cost against traffic volume so you can compare year-over-year efficiency even as passenger counts fluctuate.
6
Emergency Work Order Percentage
Formula: (Emergency WOs / Total WOs) × 100
Target: <15% of all work orders
Why it matters: High emergency rates mean you're in reactive mode. Best-in-class airports keep emergencies below 10% through strong PM programs.
7
Mean Time Between Failures (MTBF)
Formula: Total operating time / Number of failures per asset class
Target: Varies by asset (e.g., 2,000+ hours for jet bridges)
Why it matters: Rising MTBF proves your PM program is working. Declining MTBF flags assets entering end-of-life that need CapEx replacement.
8
Schedule Compliance Rate
Formula: (Work orders completed on scheduled date / Total scheduled WOs) × 100
Target: ≥85% on-time completion
Why it matters: Low schedule compliance signals poor planning, technician shortages, or parts delays—all fixable with better CMMS workflows.
How OxMaint Delivers Airport KPI Dashboards
OxMaint auto-calculates every KPI from the work order, asset, and parts data your team is already entering. No manual spreadsheet exports, no end-of-month reporting delays, no hunting for numbers across systems. The dashboard updates in real time as technicians close work orders, log parts usage, and mark PMs complete. Facility managers see current performance, trend lines, and drill-down views by asset class, location zone, or technician crew—all in one screen. Start a free trial to see your airport KPIs live.
Real-Time KPI Calculation
Metrics update automatically as work orders close, eliminating manual data pulls and spreadsheet calculations. See current performance, not last month's history.
Drill-Down by Asset & Zone
Click any KPI to see performance by terminal, concourse, asset class, or technician crew. Identify where problems concentrate instead of looking at facility-wide averages.
Trend Analysis & Forecasting
View 30, 60, 90-day trend lines to spot performance degradation before it hits critical thresholds. Forecast backlog growth and staffing needs.
Benchmark Comparison
Compare your KPIs against industry benchmarks for similar-sized airports. Know if your 82% PM compliance is acceptable or a red flag.
Custom Alert Thresholds
Set alerts when any KPI breaches your target—like MTTR exceeding 2 hours or backlog climbing above 5%. Get notified before small issues become crises.
Export-Ready Reports
Generate executive summaries, board reports, and regulatory filings with one click. All KPIs export to PDF or Excel with full source data traceability.
Frequently Asked Questions
What airport maintenance KPIs should I track first in a CMMS?
Start with PM compliance rate, MTTR, and work order backlog. These three KPIs give immediate visibility into whether your maintenance operation is preventive or reactive, fast or slow, and on top of workload or buried. Once these stabilize, add cost per passenger and MTBF tracking.
Start a free trial to track your first three KPIs.
How does OxMaint calculate MTTR and MTBF for airport assets?
MTTR pulls from work order timestamps: total repair hours divided by number of repairs per asset class. MTBF tracks operating hours between failures using work order history and asset runtime logs. Both metrics auto-update as technicians close work orders in the system.
Can I track KPIs by terminal zone or asset class in OxMaint?
Yes. Every asset is tagged with location (terminal, concourse, gate area) and class (HVAC, baggage, jet bridge, etc.). All KPIs can be filtered and drilled down by these dimensions so you see performance at the level you actually manage.
Book a demo to see zone-level KPI tracking.
What's a good PM compliance target for airports?
Best-in-class airports run at 92-95% PM compliance. Anything below 85% means you're missing scheduled maintenance and increasing emergency failure risk. OxMaint's PM scheduling engine makes 90%+ compliance achievable within the first quarter of use.
Turn Maintenance Data Into Decisions
OxMaint gives airport facility managers the KPI dashboards they need to run maintenance like a business: track uptime, control costs, reduce backlog, and prove performance to executive leadership. Stop flying blind. Start tracking what matters.