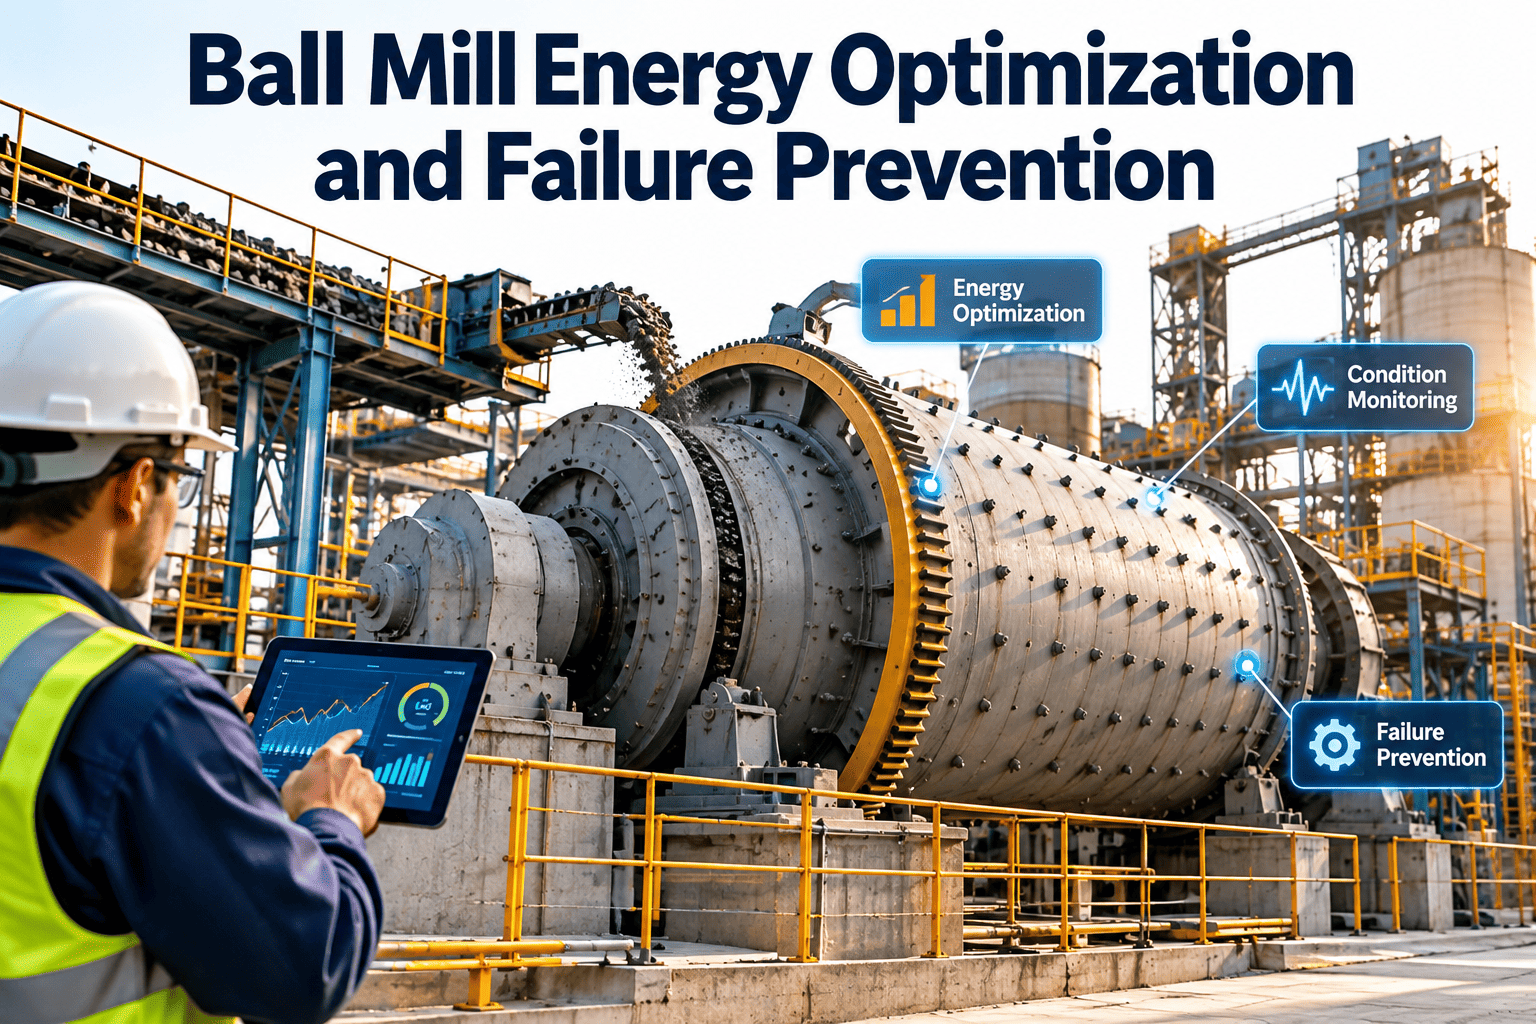
Cement grinding is the single largest electrical load in most cement plants, and the ball mill circuit carries the bulk of that draw. Specific energy consumption in a well-tuned closed-circuit mill sits well below what most plants are actually running, and the gap is rarely a design flaw — it is drift. A liner losing its lifting profile, a media charge quietly losing top-size balls, a classifier vane out of calibration: each one nudges kWh per tonne upward on its own, and each one is also an early signal of a mechanical failure building toward a shutdown, long before it shows up as a stopped mill on the production report. Treating energy and failure prevention as the same maintenance conversation, not two separate ones, is where the real savings sit — see how that connects to your mill fleet with a free Oxmaint trial.
Every Kilowatt-Hour Your Ball Mill Wastes Is Also A Failure Warning
Worn liners, depleted media charge, and drifting separators inflate specific energy consumption long before they cause a mechanical stop. Track them together and you cut power cost while catching failures early.
Most Plants Are Measuring Energy From The Wrong Point
Before any optimization work starts, it matters where the power reading is actually taken. A number pulled from the switchgear rather than the motor terminal, or averaged across a period with inconsistent throughput and fineness, produces a baseline that looks stable while masking real drift underneath.
Cement grinding alone typically accounts for a large share of total electrical draw at a plant, and only a small fraction of the energy fed into a ball mill is actually converted into new surface area on the ground particles. The rest is dissipated as friction, heat, sound, and vibration inside the mill shell. That inherent inefficiency is not something maintenance can fix, but the mechanical condition of the mill determines how much worse than that baseline inefficiency the circuit is actually running — and that gap is entirely addressable.
A clean baseline needs three things: a stable measurement window of at least 48 to 72 hours, consistent throughput and target fineness across that window, and a reading taken at the motor terminal rather than upstream switchgear where transformer and distribution losses distort the number. Without those three conditions, any before-and-after comparison from a maintenance intervention is unreliable, because normal production variability can be larger than the improvement being measured.
Four Mechanical Levers Move Specific Energy Consumption
Specific energy consumption is not one number that drifts uniformly. It is the sum of several mechanical conditions, each degrading on its own schedule, and each one traceable back to a specific maintenance action rather than a vague process tuning exercise.
Treating these four levers as independent variables matters because they rarely move in isolation for long. A mill running with worn liners often also carries a depleted media charge, simply because the same operational pressure that delayed the reline also delayed the last top-up. Separating out which lever actually moved the SEC number, rather than fixing all four at once and hoping the trend improves, is the only way to know which intervention was worth the maintenance hours spent on it.
As shell and end liners wear past their original lifting profile, the trajectory of the grinding media changes, reducing impact energy transfer to the material being ground.
Grinding balls wear down and are consumed continuously. Without regular top-up tracked against actual tonnage, the charge gradually loses its optimal size gradation.
The classifier decides what returns to the mill for regrinding and what leaves as finished product. A drifting separator increases recirculating load unnecessarily.
Proper airflow sweeps finished material out of the grinding zone before it cushions ball impacts. Diaphragm slot blockage and damaged lifters disrupt that flow.
What A Well-Tuned Circuit Actually Achieves
The right benchmark depends heavily on circuit configuration. Comparing an open-circuit mill against a roller-press pre-grind system as if they were the same asset produces meaningless targets, so the comparison needs to start with the right configuration class.
It also matters that the benchmark be applied per mill rather than as a single plant-wide average. Two mills of identical design on the same site can carry genuinely different achievable targets once feed material hardness, moisture, and Blaine specification differ between the products each one runs. Averaging their performance into one plant-wide SEC figure hides whichever mill is actually the worse performer, which is precisely the mill that would benefit most from attention.
| Circuit Configuration | Typical Industry SEC | Achievable SEC, Well-Tuned |
|---|---|---|
| Open circuit ball mill | 42–48 kWh/t | 38–42 kWh/t |
| Closed circuit with classifier | 36–42 kWh/t | 30–36 kWh/t |
| Closed circuit with roller press pre-grind | 28–34 kWh/t | 24–28 kWh/t |
| Vertical roller mill, for reference | 22–28 kWh/t | 20–24 kWh/t |
A mill running 15–25% above its configuration's achievable benchmark is not failing outright, which is exactly why the gap tends to go unaddressed. It shows up as a steadily inflated power bill rather than a stoppage, until the underlying mechanical cause finally does cause one.
Energy Drift Today Is Often A Failure Warning For Next Month
The same readings that explain a rising kWh/t trend also tend to be the leading indicators for the mechanical failures maintenance teams actually get called out for. Treating them as one data stream, rather than an energy report and a maintenance log kept separately, catches both problems from the same alert.
This is also where the organizational split between process engineering and maintenance tends to cause the most damage. A process team watching SEC trends may flag a rising number without knowing whether the cause is mechanical or a genuine feed change, while a maintenance team logging liner wear may have no visibility into whether that wear has actually started costing power yet. Neither team alone has the full picture, and the fix is not a new meeting between them — it is a shared record both teams pull from, so the correlation is visible without anyone having to ask.
The Mechanical Failures That Follow Energy Drift
A mill that has been running with degraded liner, media, or ventilation condition for an extended period is not just burning excess power. The same underlying conditions tend to accelerate a specific set of mechanical failures that eventually force an unplanned stop.
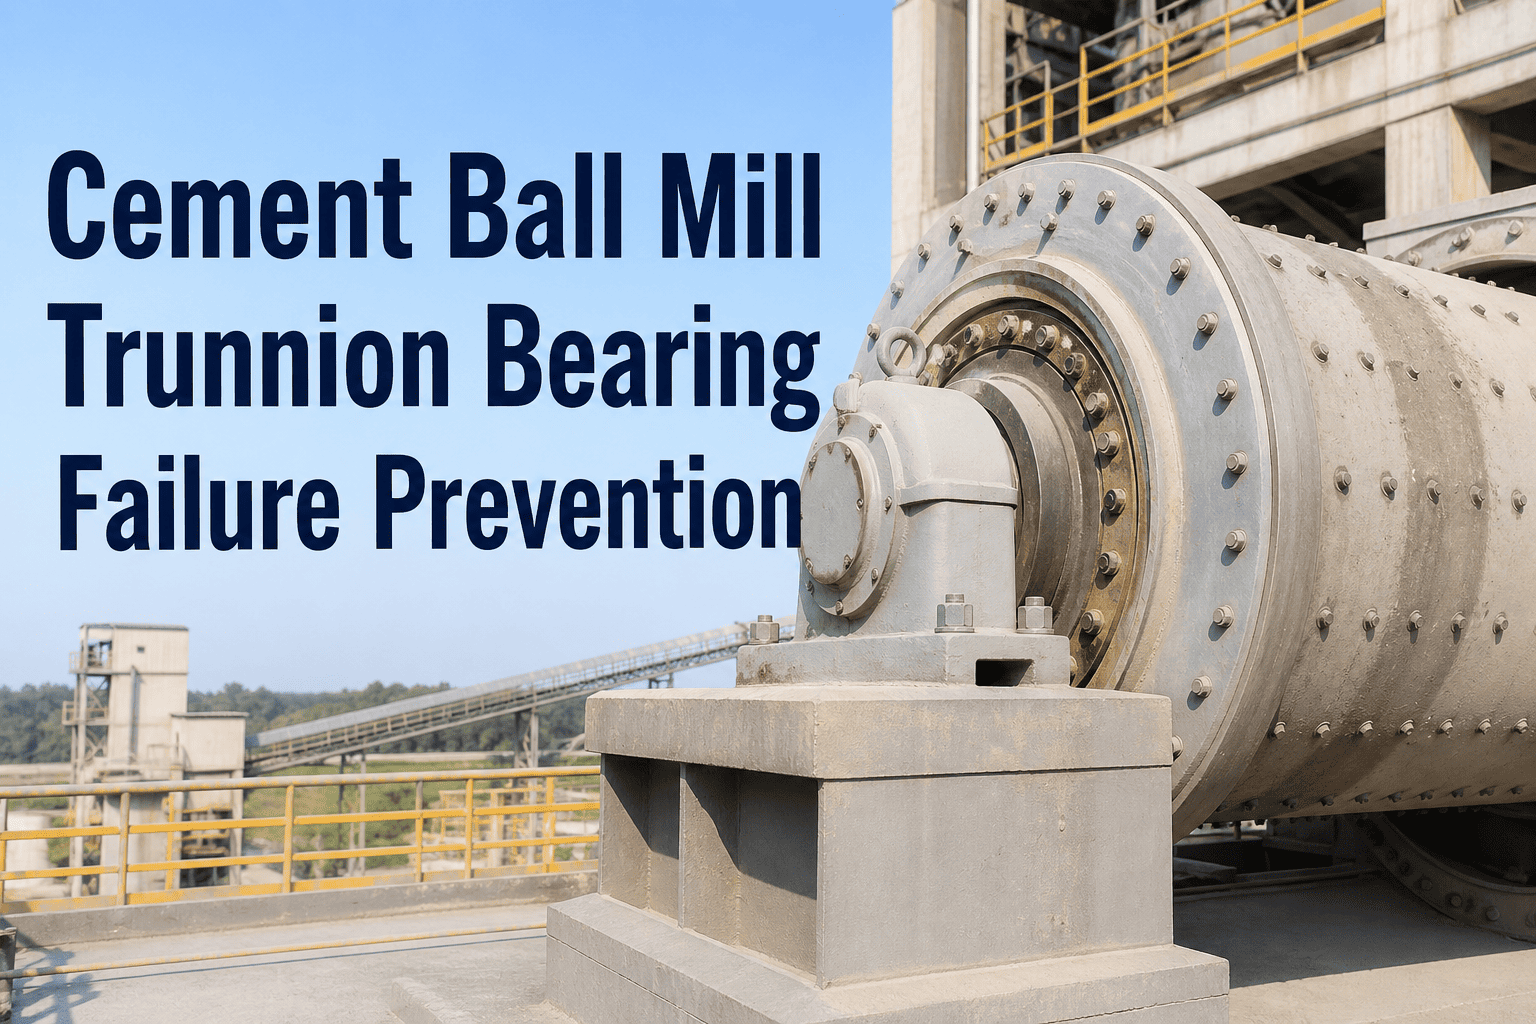
A mill running heavier or unevenly loaded due to charge or liner issues places uneven stress on trunnion bearings, which shows up first as a slow rise in bearing temperature during routine checks.
Changed load distribution inside the mill alters torque transfer through the drive train, accelerating wear on the girth gear and pinion faces over successive months.
Blocked diaphragm slots restrict material flow and airflow together, and the resulting buildup of material can accelerate mechanical wear on the lifters behind it.
A mill consistently running above its design specific energy consumption places sustained extra load on the drive motor, shortening the interval between winding inspections and increasing failure risk.
None of these failures happen overnight. Each one develops gradually, in step with the same energy drift that shows up first as a rising kWh/t trend — which is exactly why tracking that trend against mechanical condition catches the failure risk months before it becomes a stoppage.
A 4 kWh/t Reduction Across A 100 TPH Mill Adds Up Fast
Oxmaint links liner readings, media top-ups, classifier settings, and mill power draw to the same asset record so a rising SEC trend traces back to the lever that moved it.
Building A Combined Energy And Reliability Program
Measure specific power consumption at the motor terminal over a stable window at target throughput and fineness, not from a single snapshot reading.
Record liner thickness and media top-up quantities against the mill asset and against tonnage processed, not just the calendar date of the last inspection.
Plot specific energy consumption alongside liner wear and media charge data so a drifting trend can be traced back to the lever that actually moved it.
Trigger liner inspection, media top-up, or separator recalibration work orders automatically once a mill's SEC or a component's wear crosses a defined threshold.
What Closing The Gap Looks Like On A Typical Circuit
A closed-circuit mill running at 40 kWh/t against a 30–36 kWh/t benchmark for its configuration is not an unusual finding. Closing even half of that gap, through liner, media, and separator work bundled into a single maintenance cycle, is typically achievable without touching cement quality or clinker factor.
The order these interventions happen in matters more than most plants assume. Recalibrating a separator against a mill that is still running a depleted media charge will show some improvement, but it hides how much more is available once the charge itself is corrected — so the gain gets credited to the wrong lever and the maintenance team moves on before the job is actually finished. Working through liner and media condition first, then re-baselining, then addressing separator and ventilation settings, gives each intervention a clean before-and-after reading instead of a blended result that is hard to act on next time.
Each of these four actions is inexpensive relative to the annual power cost of leaving the gap unaddressed, which is exactly why bundling them into one planned intervention, backed by a clean before-and-after SEC reading, tends to be an easy case to make even to a plant manager focused primarily on production targets rather than energy line items.
How Oxmaint Connects Energy And Reliability Data
Specific energy consumption is plotted against liner condition, media top-up events, and classifier settings on one timeline per mill.
Liner thickness readings and media charge history are logged against the mill asset and tracked by tonnage processed since the last intervention.
Crossing a wear or SEC threshold automatically generates a work order for liner inspection, media top-up, or separator recalibration.
Multiple mills across a plant or portfolio are compared against the same configuration-specific benchmark, surfacing the worst performer first.
Frequently Asked Questions
How much can specific energy consumption realistically be reduced?
Plants tracking liner, media, and separator condition together commonly hold grinding energy well below industry averages for their circuit configuration, without changing product quality. Start a free trial to benchmark your own mill fleet.
Does liner wear affect throughput as well as energy consumption?
Yes. As lifting profile degrades, both specific energy consumption and throughput capacity are affected together, since the same reduced impact energy that wastes power also grinds less material per hour.
How often should media charge be checked against target gradation?
Most plants run a full sieve analysis quarterly, with a lighter check after any major top-up, and log the results against the mill asset so drift becomes visible over successive cycles.
Can a high-efficiency separator upgrade alone close the SEC gap?
A separator upgrade typically closes part of the gap by reducing recirculating load, but liner and media condition still need to be tracked, since either can independently offset the gains. Book a demo to model the combined effect for your mill.
Why does energy monitoring belong in a CMMS rather than a separate process report?
Because the mechanical causes of energy drift are the same conditions maintenance teams already inspect for, keeping both in one system avoids the same root cause being diagnosed twice by two different teams.
Stop Treating Grinding Energy And Mill Reliability As Separate Problems
Oxmaint tracks liner wear, media charge, and separator settings against your mill's SEC trend, so drift gets traced to its cause and a work order follows automatically.