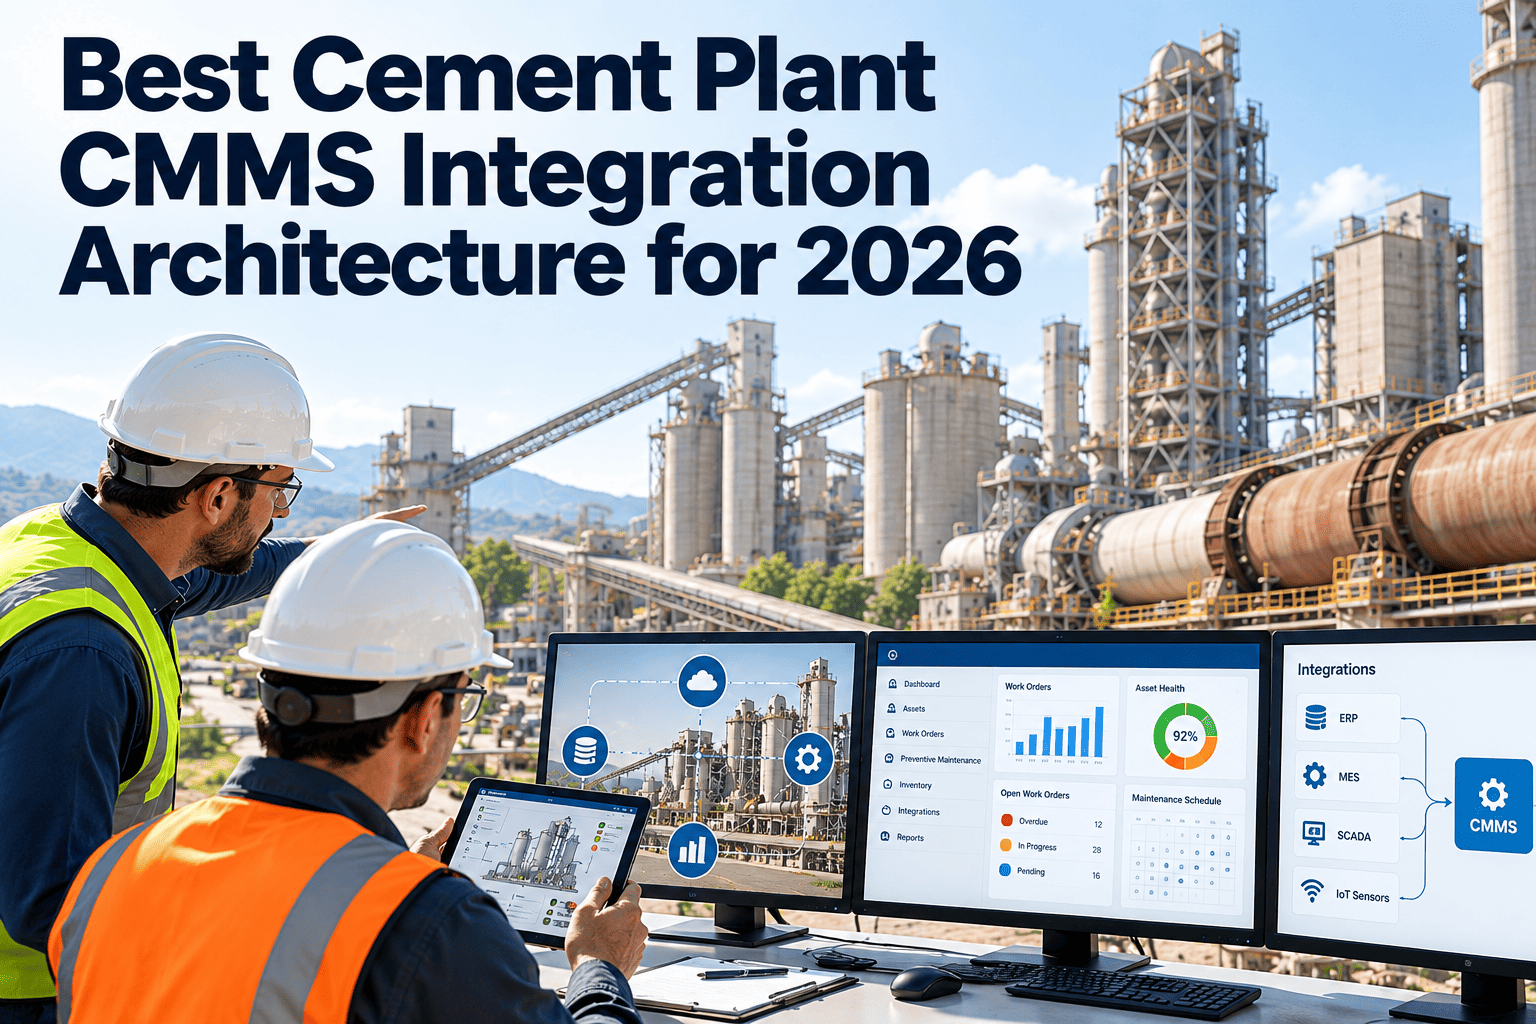
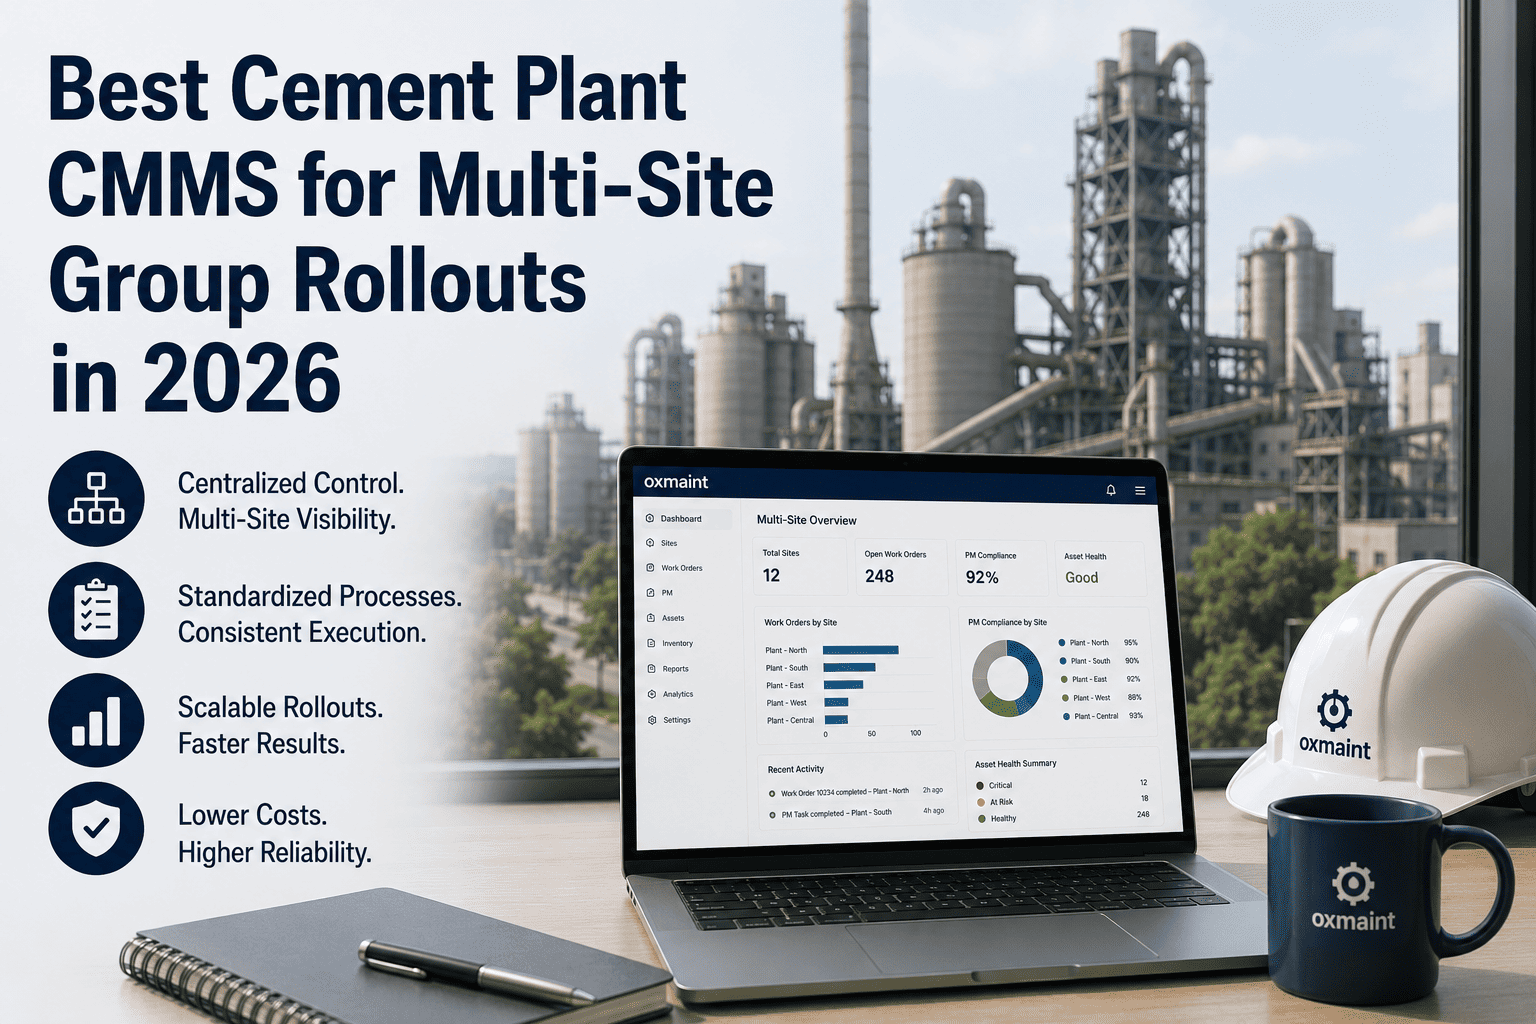
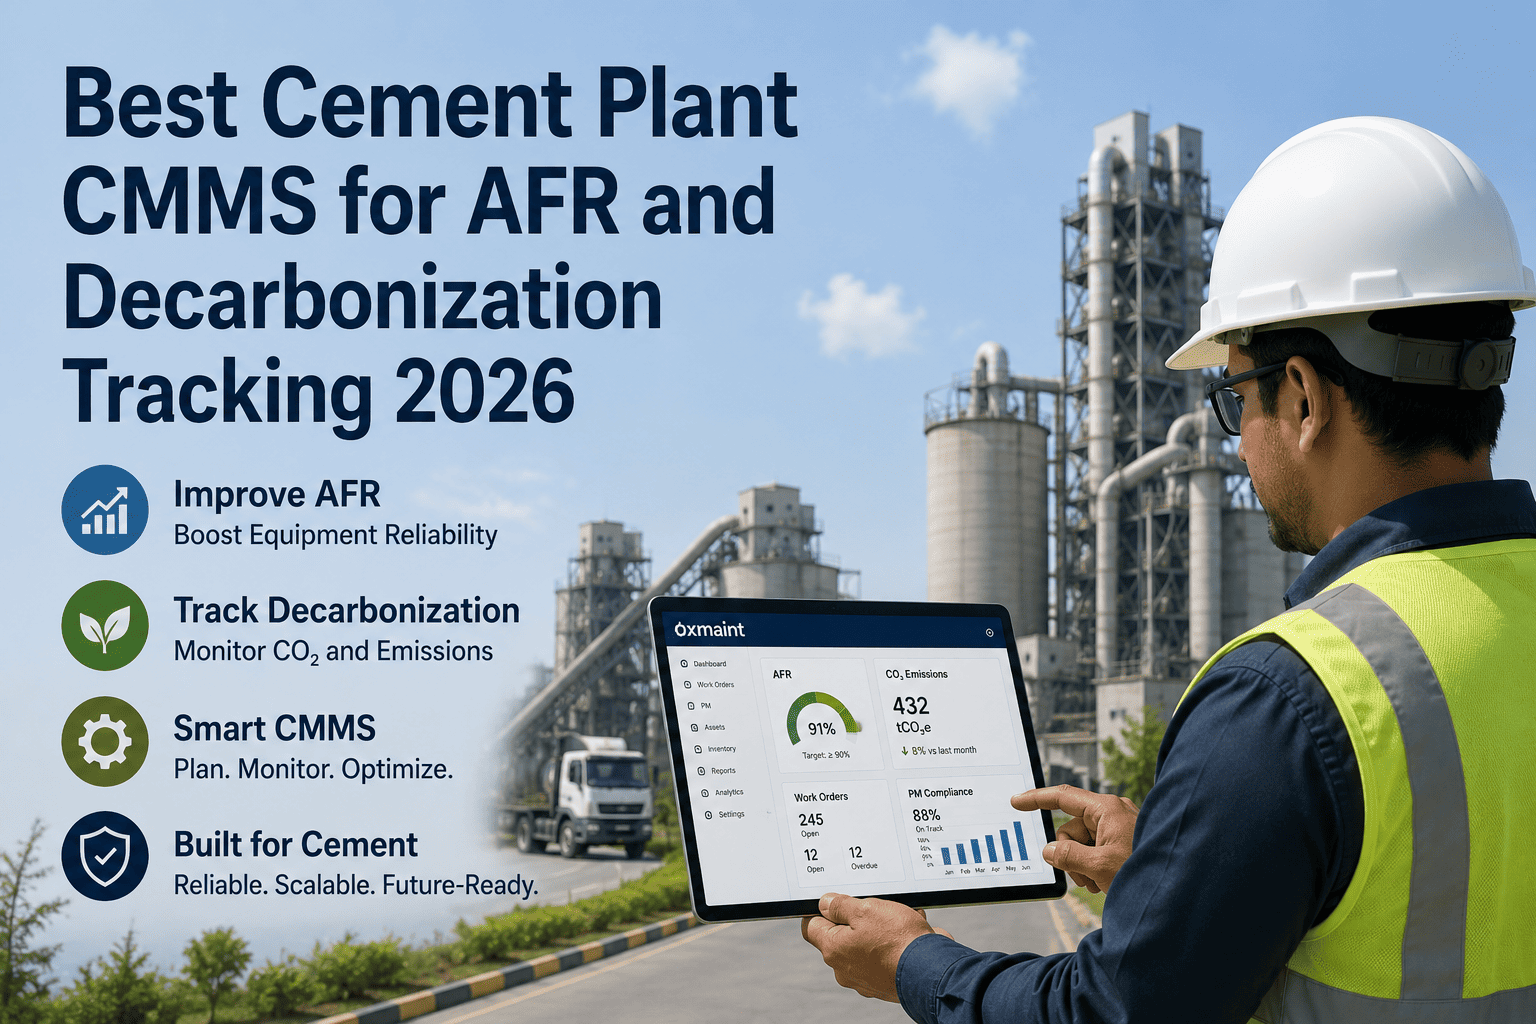
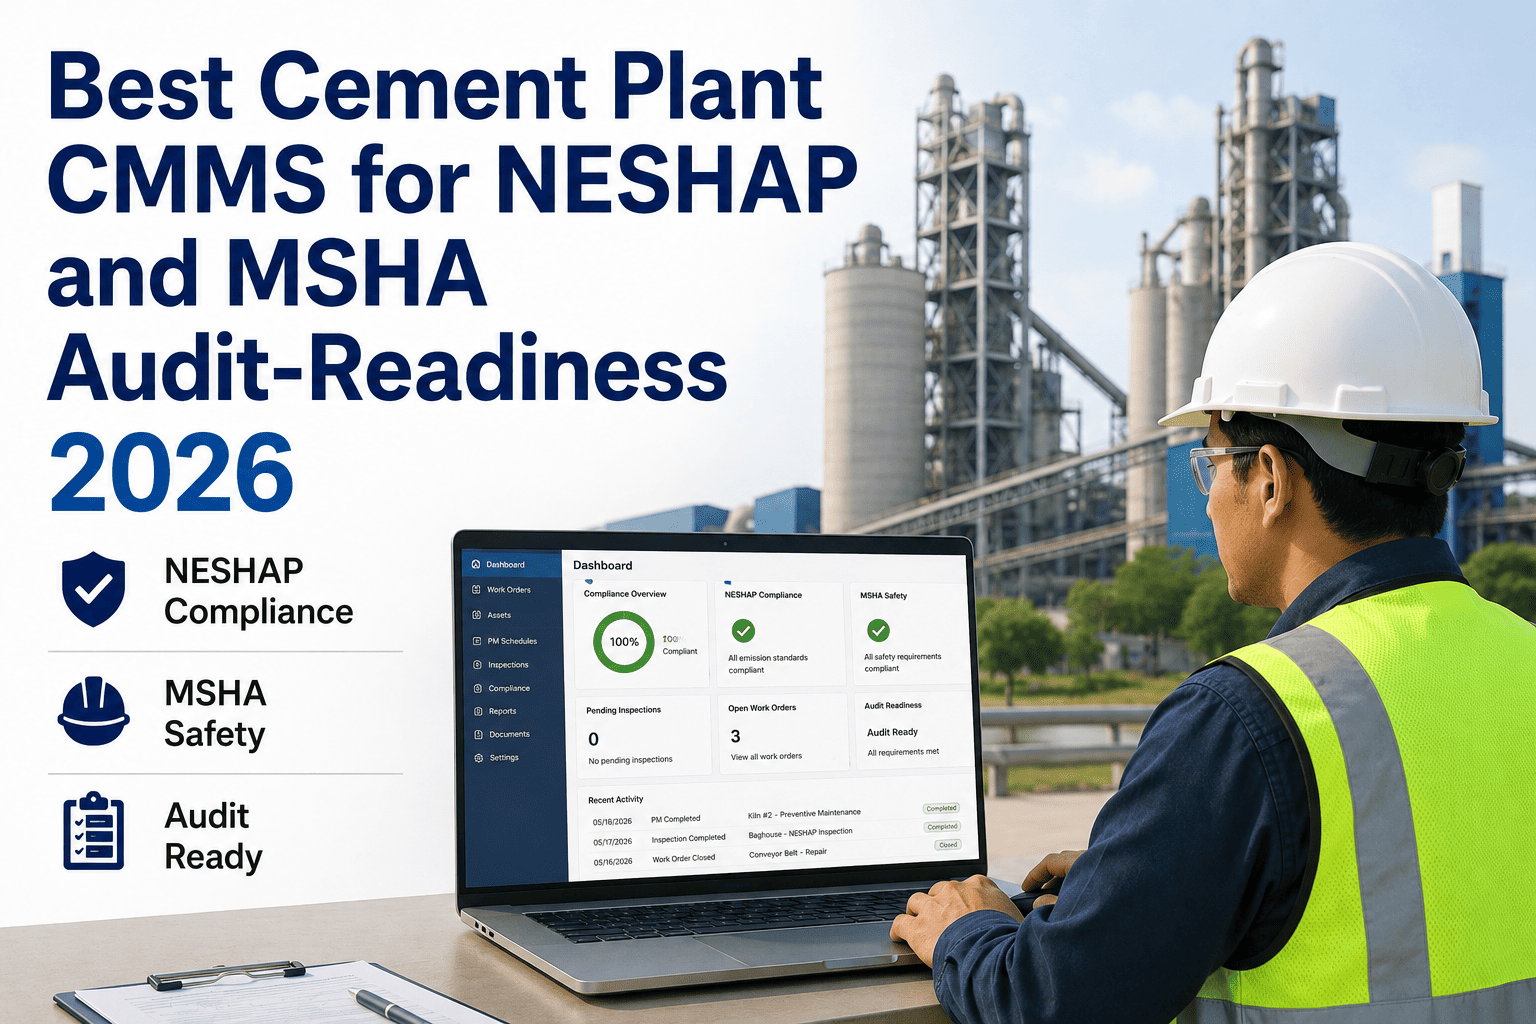
The gap between a cement plant that runs predictive maintenance and one still managing work orders on paper or spreadsheets is measurable in millions — per year, per plant, at documented facilities across multiple continents. In 2026, the evidence base for what a well-implemented CMMS actually delivers in cement operations is no longer theoretical: it comes from real plants with real kiln lines, real quarry operations, and real finance teams signing off on the results. The 12 case studies on this page span six cement plant operation types — kiln reliability programs, refractory management, alternative fuels and raw materials (AFR) handling, packing and dispatch operations, quarry and crushing circuits, and multi-plant group rollouts. Each case documents the implementation approach, the measurable outcome, and the specific maintenance problem that drove the decision to deploy. When you are ready to see how these results apply to your plant's asset base and current maintenance challenges, start a free trial on Oxmaint — the CMMS behind many of the outcomes documented here.
2026 Case Study Collection · Cement Manufacturing
Best Cement Plant CMMS Implementations of 2026
12 documented case studies across kiln reliability, refractory management, AFR operations, packing lines, quarry circuits, and multi-plant group rollouts.
Aggregate Results Across All 12 Implementations
45–68%
Average unplanned downtime reduction across kiln-focused deployments
$1.9M+
Annual savings documented at a single 5000 TPD plant within 12 months
91%
Planned maintenance compliance achieved after full deployment at a 2-kiln line plant
8 days
Time to first automated PM work order on kiln thrust roller — Day 8 of deployment
Case Studies 01–04: Kiln Reliability Programs
The rotary kiln is the highest-value and highest-risk asset in every cement plant. These four implementations focused on kiln uptime, predictive monitoring, and failure prevention — the scenarios with the highest financial stakes.
Situation Before
Paper logbooks, Excel PM tracking, and verbal shift handovers. 68% of all work orders were corrective. Kiln tire slip caused an extended Q2 shutdown that had been preceded by an identical event in Q4 the prior year — invisible because there was no system to connect the two incidents.
45%
Unplanned downtime reduction
91%
PM compliance at Month 12
Day 8
First automated PM work order
"The most valuable thing was not the software — it was being forced to look at our own data for the first time. We had been treating every breakdown as an isolated event. The CMMS showed us that most of them were the third occurrence of something we had already seen twice."
— Maintenance Manager, 5000 TPD Cement Plant, Indonesia
Situation Before
Losing $2.9M annually to unplanned kiln shutdowns. Reactive work consumed 61% of all work orders. Vibration anomalies on kiln thrust rollers and raw mill circuits were discovered only after failure — no structured predictive monitoring existed.
52%
Kiln downtime reduction
8 mo
Time to measurable results
61% → 34%
Reactive work order share
Situation Before
$4.2M annual unplanned downtime losses. Manual kiln and preheater inspections required confined space entry. Two production lines with aging equipment experiencing increasing maintenance demand without condition-monitoring infrastructure.
45%
Unplanned downtime cut
$1.9M
Annual savings documented
Zero
Confined space entries for routine inspections
Situation Before
Asset health digital twin deployed on kiln main drive and separator fan circuits in late 2024. CMMS integration required to convert twin output into actionable work orders — without integration, twin data was being reviewed manually and inconsistently.
2
Forced outages avoided in first 6 months
$1.8M
Avoided loss from first intervention
3–6%
Specific heat consumption reduction
Q2 2025
Time to first measurable intervention
Every kiln in every one of these case studies was already failing slowly — they just didn't know it. Oxmaint's condition-monitoring integration and automated work order generation is what turned sensor data into action before the shutdown. Start free today.
Case Studies 05–08: Refractory, AFR, Packing & Quarry
Beyond the kiln drive train, these four implementations tackled the specialized maintenance challenges that cause a disproportionate share of cement plant downtime: refractory failures, alternative fuels handling equipment, packing line stoppages, and quarry circuit breakdowns.
Refractory brick replacement was driven by visual inspection and operating intuition — leading to either premature replacement (cost waste) or emergency shell repairs (production loss). No systematic kiln shell temperature trending was connected to planned outage scheduling.
30%
Reduction in refractory replacement cost through condition-based scheduling
2
Emergency shell repairs avoided in first 12 months
100%
Kiln shell scans linked to CMMS work order history
Thermal substitution rate (TSR) target of 60% was unachievable due to chronic AFR feed system stoppages — shredder wear, conveyor jams, and dosing equipment failures. Reactive maintenance on AFR equipment was costing as much as the fuel savings it enabled.
58%
TSR achieved after AFR equipment PM program deployed
42%
Reduction in AFR system unplanned stoppages
€320K
Annual fuel cost savings unlocked by reliable AFR feed
Three rotary packing machines running 18-hour dispatch windows. Unplanned packer stoppages were causing dispatch delays averaging 40 minutes per event — six to eight times per shift. Bag reject rates and spout wear were tracked manually, with no PM trigger based on bag count or mechanical cycle data.
71%
Reduction in unplanned packing line stoppages
Cycle-based
PM triggers on spout wear, valve replacement, and bag sensor calibration
+18%
Dispatch throughput increase across all three packing lines
Primary jaw crusher and secondary cone crusher circuit experienced two to three unplanned stops per week. Mobile equipment — drill rigs, haul trucks — had no structured PM schedule; maintenance was driven entirely by operator complaints. MSHA-equivalent local regulatory compliance for mine equipment records was managed on paper.
65%
Reduction in crusher circuit unplanned stops
Digital
Pre-shift mobile equipment inspections replacing paper records
100%
Regulatory inspection record completion rate at Month 3
Case Studies 09–12: Multi-Plant Group Rollouts
Scaling CMMS across multiple plants introduces standardization challenges, data migration complexity, and change management requirements that single-plant deployments don't face. These four group rollout case studies document what works — and what to watch for.
09
4-Plant Group • North Africa
Standardized CMMS Rollout
18-Month Implementation
Four plants, four different maintenance cultures, and three legacy CMMS systems — none sharing asset data or PM template libraries. Corporate reliability team had no cross-plant visibility into failure patterns or maintenance spend.
Single
Asset hierarchy across all 4 plants
340+
Standardized PM templates deployed
28%
Group-level maintenance cost reduction
10
6-Plant Group • South & Southeast Asia
Phased Regional Rollout
24-Month Program
Starting with the two highest-performing plants as reference sites, the group built a shared maintenance best practice library before rolling out to four additional plants. Each subsequent plant deployment took 60–90 days rather than the 6-month timeline of the first two.
60 days
Deployment time per plant from Month 12
35%
Average unplanned downtime reduction group-wide
6x
Faster deployment at plants 3–6 vs plants 1–2
11
3-Plant Integration • European Union
CMMS + ERP + ISO Compliance Integration
12-Month Implementation
EU CBAM enforcement requirements and ISO 14001/50001 recertification created pressure to link maintenance records to emissions and energy compliance documentation. Three plants on SAP Finance needed CMMS work orders to post costs to SAP cost centers automatically.
Real-time
SAP cost posting from CMMS work orders
3
ISO audits passed with CMMS-generated audit packages
40%
Reduction in audit preparation time
12
8-Plant Multinational Group
Global Reliability Benchmarking Program
36-Month Program
A multinational cement group operating 8 plants across 5 countries needed group-level MTBF, MTTR, and cost-per-tonne benchmarks to identify which plants were underperforming and justify capital allocation decisions. No common data definitions, no shared asset hierarchy, and no aggregated view existed before deployment.
8 plants
On a single maintenance intelligence platform
Live
Cross-plant MTBF, MTTR, OEE dashboards
22%
Group-wide maintenance cost per tonne reduction
5 Implementation Lessons Across All 12 Cases
01
Start with your 10–15 most critical assets, not your full asset list
Every successful implementation began with a focused criticality-ranked asset list. Plants that tried to migrate every asset at once created data quality problems that delayed value delivery by 3–6 months.
02
The first automated PM work order is the milestone that changes behavior
In case after case, technician and management engagement shifted visibly when the first system-generated work order arrived before a failure occurred. The credibility of the system is established in that moment.
03
Root cause entries on closed work orders are the data asset that compounds
The 5000 TPD Indonesia plant cited root cause entry discipline as the single most important behavior change. Without it, failure pattern detection never improves beyond the initial model. With it, prediction accuracy reaches 92%+ within 12 months on plant-specific equipment.
04
Group rollouts that build a shared template library first deploy 6x faster
The 6-plant Southeast Asia rollout demonstrated the compounding value of reference-site templates. Plants 3–6 took 60 days each versus 6 months for the first two. Shared PM templates, asset hierarchies, and failure mode libraries are the group's most reusable maintenance asset.
05
CMMS and ERP integration is not optional for plants with ISO or CBAM obligations
The EU plants in cases 11 and 12 found that maintenance records disconnected from financial and compliance systems became an audit liability. Work order costs posting to SAP automatically is not a convenience — it is a compliance requirement when CBAM and ISO 55001 auditors request asset-level cost evidence.
Frequently Asked Questions
How long does it take to see measurable results after CMMS deployment at a cement plant?
Most cement plants see their first automated PM work orders and initial downtime reductions within 30–90 days of deployment on critical assets. Measurable financial results — documented avoided downtime events and reduced reactive maintenance spend — typically emerge at months 3–6. The largest gains (40–52% downtime reduction) are documented at months 8–18, as AI prediction models mature on plant-specific failure histories.
Start your free Oxmaint trial and get your first automated work orders running within the first week.
What makes refractory management particularly well-suited to CMMS-based condition monitoring?
Refractory brick life is predictable from kiln shell temperature scan data — but only if scan results are connected to replacement decision workflows rather than filed as standalone PDFs. A CMMS that links shell scan readings to PM trigger thresholds converts refractory management from intuition-based to data-driven, preventing both premature replacement waste and the far more costly emergency shell repair scenarios documented in case study 05.
What is the typical ROI timeline for a full-plant CMMS implementation in cement?
Full-plant CMMS implementations at 1.5–3 MTPA cement facilities typically achieve ROI within 12–18 months. The Indonesia 5000 TPD plant reached full ROI in 18 months with $1.9M in annual savings against $1.4M investment. AI robotics-integrated implementations report 200–300% ROI within 18–24 months. The key variable is starting baseline — plants with high reactive maintenance rates achieve the largest absolute returns because their cost reduction potential is highest.
Book a demo to see a ROI estimate for your plant's specific asset base.
How do multi-plant group rollouts differ from single-plant deployments in terms of implementation approach?
The critical success factor for group rollouts is asset hierarchy standardization before deployment begins — agreeing on how assets are named, categorized, and structured across all plants so that cross-plant benchmarking is meaningful. Groups that standardize templates at two reference sites first, then deploy to remaining plants, reduce per-plant implementation time by 60–80% compared to parallel rollouts without a shared template foundation.
Can packing and dispatch operations benefit from CMMS in the same way kiln circuits do?
Yes — and the payback is often faster because packing line PM is simpler to instrument. Cycle-count-based PM triggers (spout wear, valve replacement, bag sensor calibration) based on bag count rather than calendar intervals prevent the majority of unplanned packing stops. Case study 07 documented a 71% reduction in packing line unplanned stoppages and an 18% dispatch throughput increase within six months — a result that required no sensor infrastructure, only structured PM scheduling in the CMMS.
Your Plant Is One Implementation Away From These Results
Every plant in these 12 case studies started exactly where yours is today — with reactive maintenance, paper records, and a team that knew something needed to change. Oxmaint is the CMMS that took them from reactive to predictive, from firefighting to planning, from cost center to competitive advantage. Start free today.