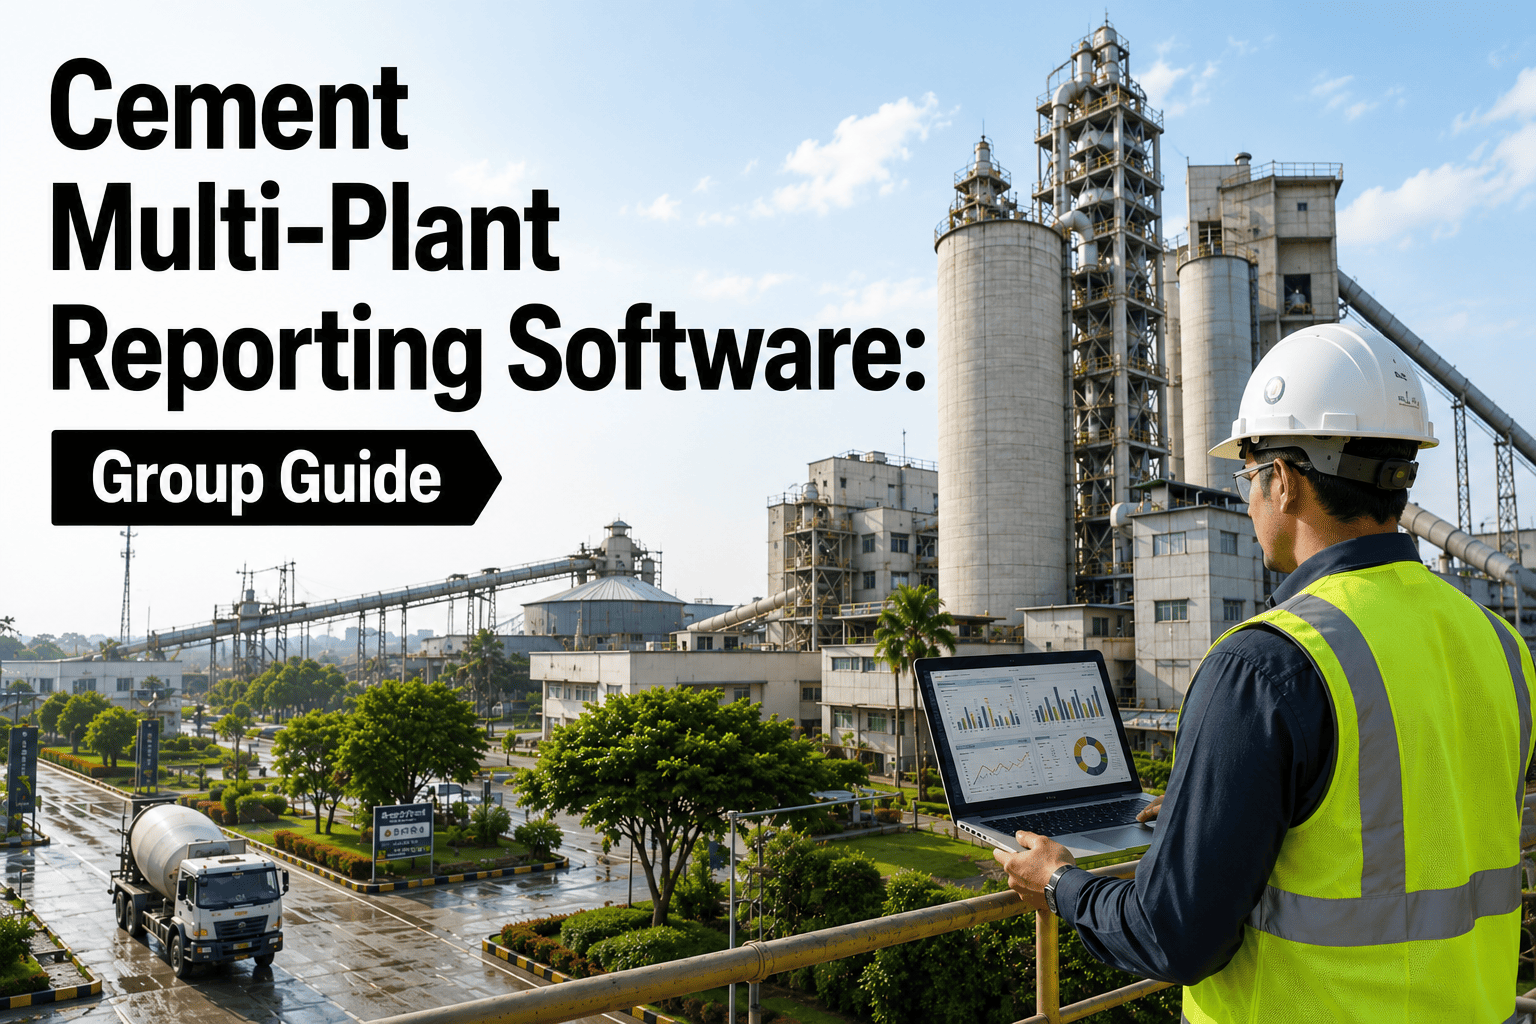
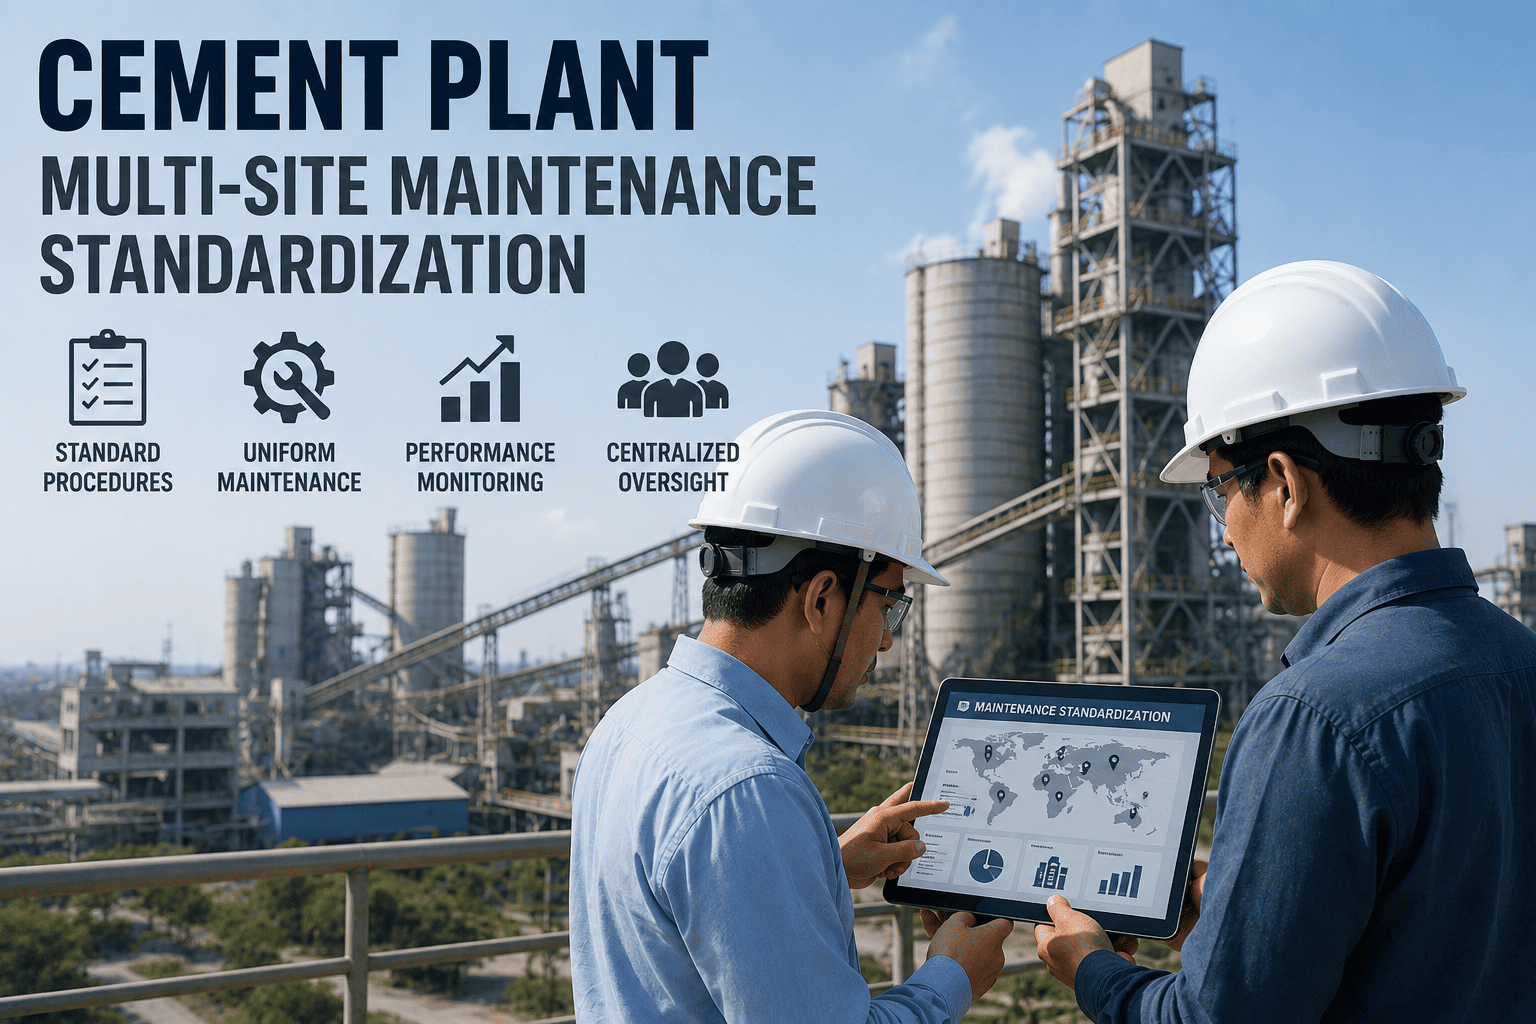
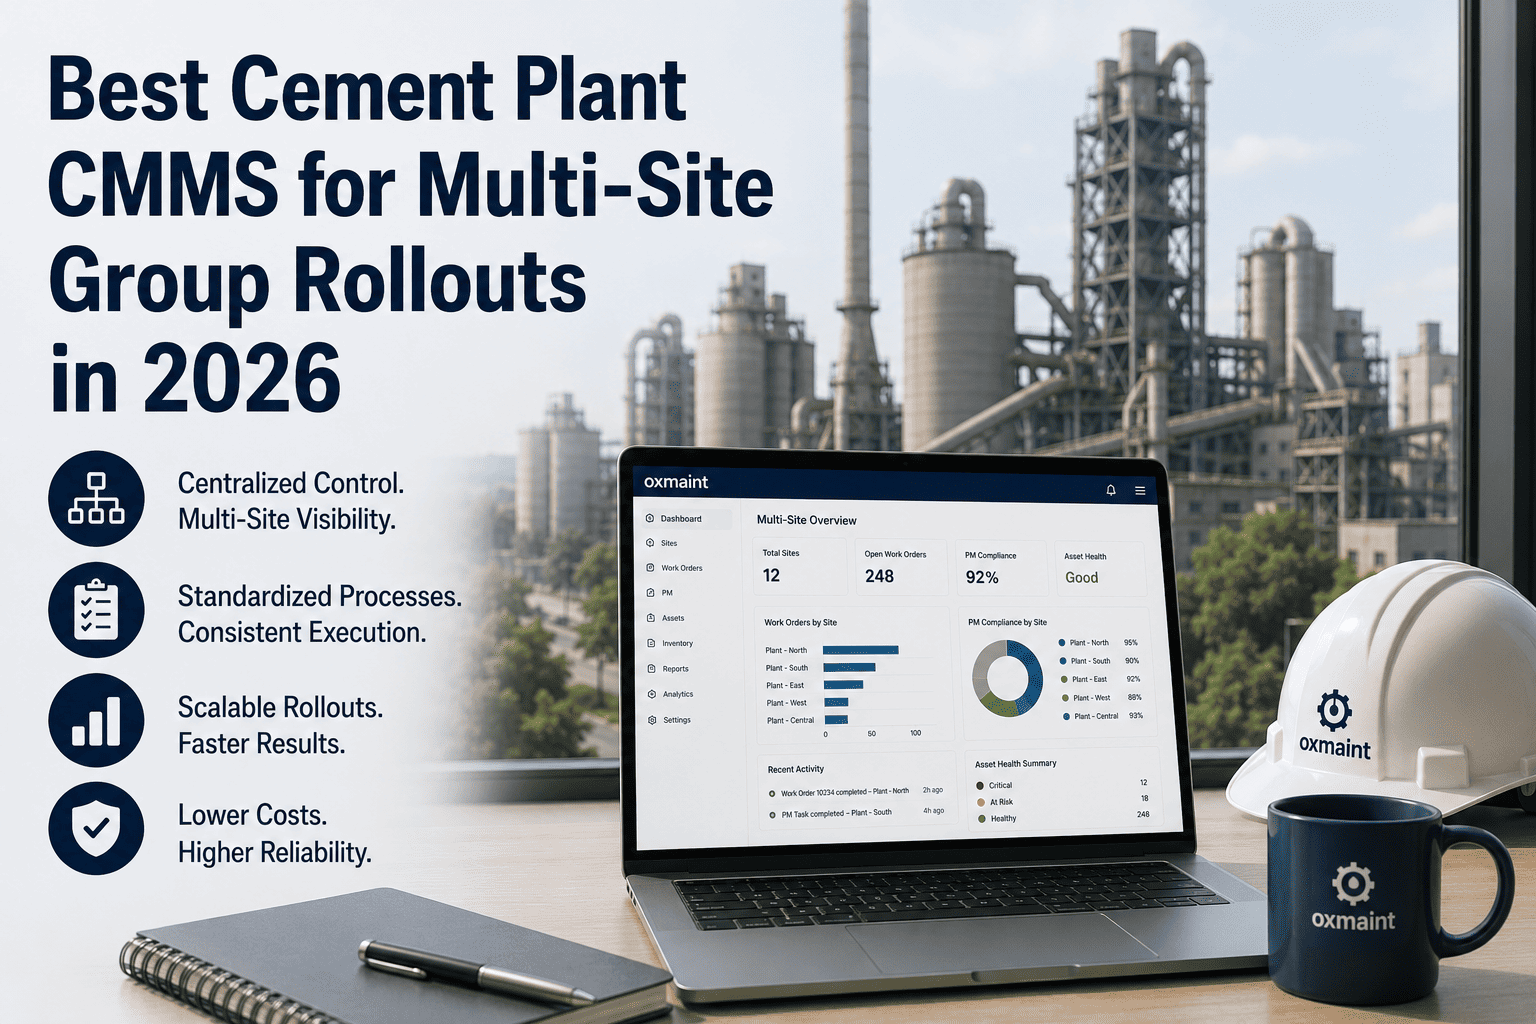
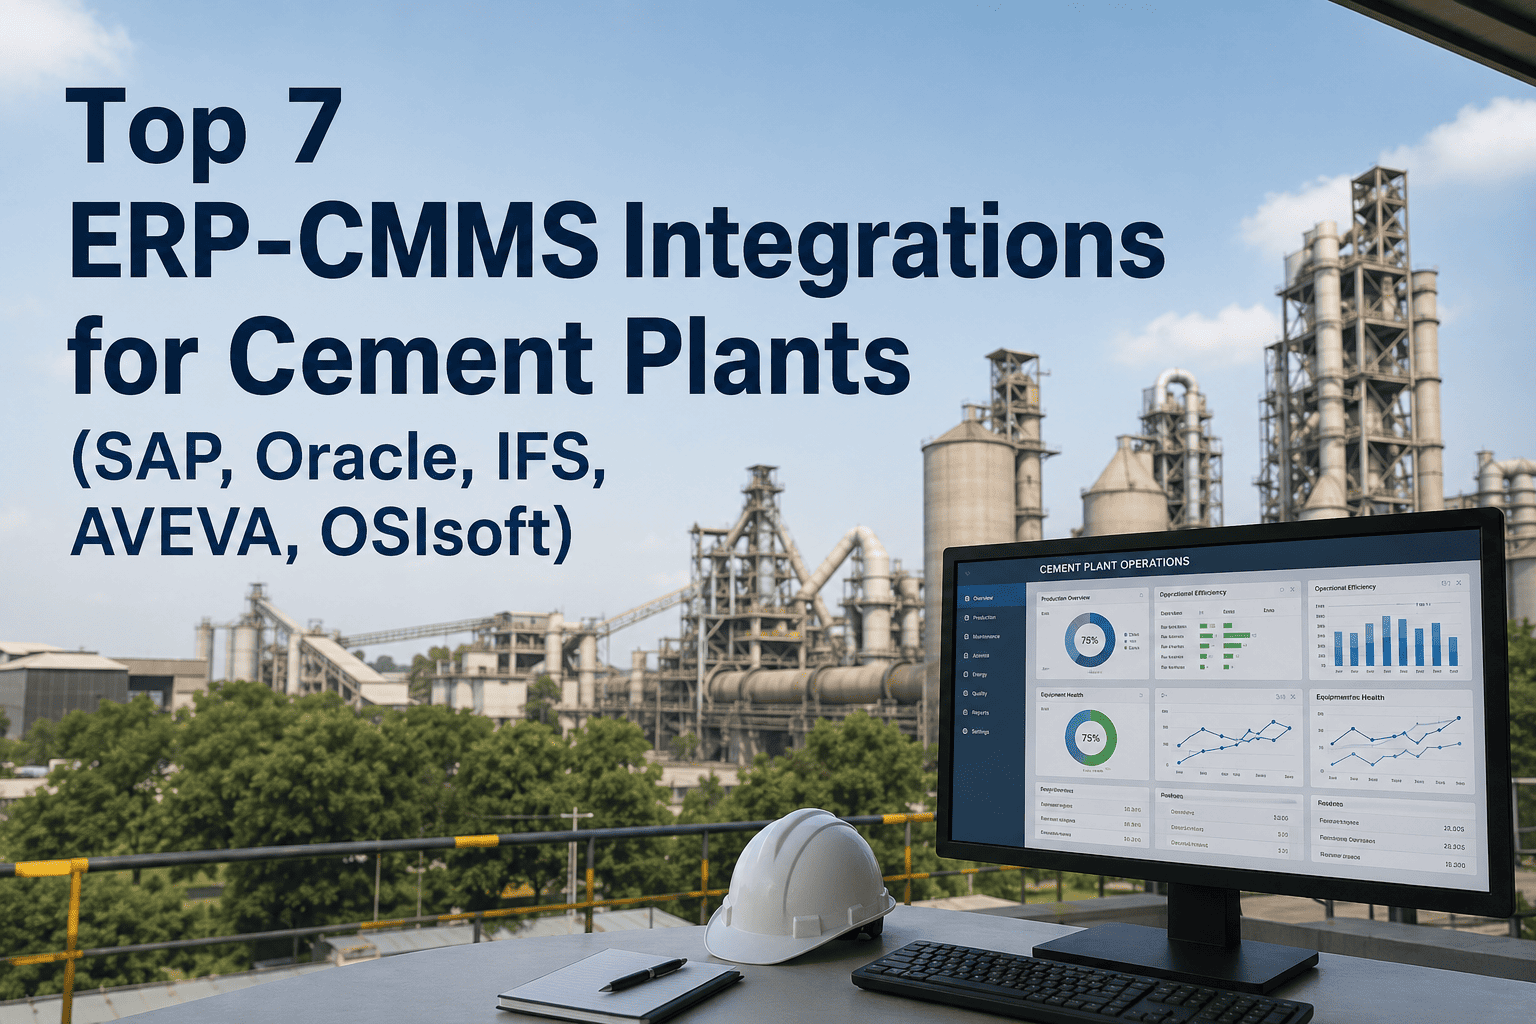
A cement group managing three plants with three different CMMS configurations — or worse, three plants running on spreadsheets — is not managing maintenance. It is managing chaos at scale. One plant runs 94 percent kiln availability while another in the same group barely reaches 71 percent, yet no one at corporate can explain the gap because there is no shared baseline, no common asset taxonomy, and no unified KPI methodology across sites. Multi-site CMMS standardization solves this structurally: it creates a single corporate maintenance framework that every plant operates within, while preserving the plant-level autonomy needed for local equipment configurations, regulatory requirements, and operational rhythms. The result is a group that learns from its best performers and systematically closes the gap at underperforming sites — not after a consultant's annual visit, but in real time. Oxmaint's enterprise architecture is built exactly for this: corporate defines the standards, plants execute against them, and the group dashboard shows who is winning and why. Start your multi-site CMMS rollout on Oxmaint — free for your first plant, with enterprise consolidation ready when you scale.
23%
Average kiln availability gap between best and worst performer in a typical 4-plant cement group
326 hrs
Unplanned downtime per plant per year — industry average without standardized PM programs
4–6 wks
Time to deploy Oxmaint enterprise CMMS across all sites with full KPI dashboards live in 90 days
60–80%
Reduction in unplanned kiln stops for cement groups running centralized cloud CMMS monitoring
Why Group Cement Plants Fail to Standardize Maintenance
The technical challenge of multi-site CMMS standardization is real but solvable. The organizational challenge — getting plant managers who have run their sites independently for years to adopt a shared framework — is harder. Understanding the root causes of fragmentation is the first step toward designing a standardization program that actually sticks.
01
No Common Asset Taxonomy
Plant A calls it a "kiln main drive." Plant B records it as "KMD unit 1." Plant C has it under three separate asset codes. Corporate cannot benchmark what it cannot compare. Standardizing asset naming and hierarchy is the non-negotiable first step.
02
Incompatible KPI Definitions
One plant calculates MTBF by calendar time; another by production runtime. One counts a planned shutdown in availability; another excludes it. Even well-intentioned reporting produces numbers that cannot be compared across sites without re-calculation.
03
PM Procedures Exist Only Locally
Plant-level maintenance engineers have developed excellent PM routines over years of experience. But when a best-practice procedure for kiln tyre wear measurement sits in one plant's local CMMS, it never reaches the other three plants that face the identical failure mode.
04
No Cross-Plant Failure Learning
A bearing failure on the raw mill at Plant C in March is logged, repaired, and forgotten. The same bearing fails at Plant A six weeks later — because no one saw the pattern. A shared CMMS surfaces cross-plant failure trends before they repeat.
05
Corporate Has No Visibility
Monthly PDF reports from site managers are the corporate maintenance team's only view into plant performance. By the time a problem appears in a PDF, the cost has already been incurred. Real-time group dashboards change this from retrospective to proactive.
06
Spare Parts Duplicated Across Sites
Each plant maintains its own storeroom buffer with no visibility into what the other plants hold. Critical spares that cost ₹40 lakh each sit on shelves at three plants simultaneously while the group's total capital tied up in identical parts goes unnoticed.
Enterprise CMMS for Cement Groups
One Standard. Every Plant. Real-Time Group Visibility.
Oxmaint's two-tier enterprise architecture lets corporate define mandatory PM standards and KPI methodology — while each plant retains the flexibility to manage site-specific equipment, local regulations, and operational schedules. The group dashboard shows everything, in real time.
The Two-Tier CMMS Architecture: Corporate Standards + Plant Autonomy
The most common mistake in multi-site CMMS rollouts is forcing complete uniformity — trying to make every plant run an identical system regardless of local equipment variations, regional regulatory requirements, or different kiln technologies. The right architecture separates what must be standardized from what should remain flexible.
CORPORATE LAYER
What Corporate Defines and Controls
Asset taxonomy and naming conventions — common across all plants
KPI definitions — MTBF, MTTR, OEE, kiln availability calculated identically at every site
Mandatory minimum inspection points for critical assets — kiln, mill, cooler
Group-wide spare parts catalogue — common part numbers, approved vendors
Cross-plant performance benchmarking dashboard — visible to group leadership
Failure mode library — best practices shared from any plant to all plants automatically
PLANT LAYER
What Each Plant Manages Locally
Additional site-specific PM tasks for local equipment configurations or OEM requirements
Local regulatory compliance records — jurisdiction-specific emission permits, water discharge
Plant-specific work order workflows — shift patterns, local approval hierarchies
Site storeroom management — local stock quantities within group catalogue framework
Contractor management records — local service agreements and vendor performance
The Group Benchmarking Dashboard: What Real Visibility Looks Like
Corporate maintenance leaders managing four to twelve cement plants need more than a list of work orders. They need a view that answers three questions instantly: which plant is underperforming, what is driving the gap, and what corrective action is already scheduled. A properly configured group CMMS dashboard delivers this in five connected layers.
L1
Portfolio Health Scorecard
All plants ranked by kiln availability, OEE, PM compliance rate, and open critical work orders. Underperformers flagged in amber or red. Group average displayed as benchmark line. Refreshes in real time — not monthly.
Group View
L2
Plant-Level Drill-Down
Click any underperforming plant to see its asset health scores, overdue PM count, top work order backlog by asset class, and MTBF trend vs group average. Answer "why is Plant C below target" in under 60 seconds.
Plant View
L3
Cross-Plant Failure Pattern Detection
When the same component fails at two plants within 90 days, the CMMS surfaces a pattern alert. Corporate maintenance engineering reviews the pattern and pushes a revised PM procedure to all plants — including those that have not yet experienced the failure.
Intelligence
L4
Shared Spare Parts Visibility
View total group stock of any critical part across all plant storerooms simultaneously. When Plant B urgently needs a kiln tyre segment, the system shows that Plant D has two in stock rather than triggering an emergency OEM order at three times the price.
Inventory
L5
Rollout Progress Tracking
For groups in the process of CMMS standardization, a rollout tracker shows asset registration completion percentage, PM template adoption rate, and training completion by plant — so corporate can identify where adoption is lagging and intervene early.
Rollout
Multi-Site CMMS Rollout: A Phased Deployment Playbook
Phase 1
Foundation — Weeks 1 to 2
Define corporate asset taxonomy: naming convention, hierarchy depth, asset class definitions for all cement plant equipment
Agree group-wide KPI calculation methodology: MTBF, MTTR, OEE, availability — get sign-off from all plant managers before proceeding
Identify Pilot Plant — select highest-readiness site with clean existing data and motivated maintenance manager to lead rollout
Phase 2
Pilot Plant Deployment — Weeks 3 to 6
Register all critical assets at pilot plant using agreed taxonomy — kiln, mills, cooler, compressors, bag filters
Build and validate PM template library for pilot plant — verify inspection intervals and task descriptions with site engineers
Run full PM cycle on CMMS — generate first set of work orders, complete, and record. Validate KPI calculation outputs match manual calculations
Phase 3
Group Rollout — Weeks 7 to 14
Deploy to remaining plants using pilot plant configuration as template — replicate PM library, adapt for site-specific equipment variants
Migrate historical data from existing systems where available — at minimum, last 12 months of work order history for trend continuity
Train plant-level super-users and maintenance engineers — 2-day hands-on sessions, site-specific configuration review
Phase 4
Group Dashboard Live — Day 90
Activate corporate group dashboard — all plants contributing live KPI data, portfolio scorecard operational
First cross-plant benchmarking review — identify performance gaps, assign corporate maintenance engineering support to lagging plants
Establish shared spare parts visibility — integrate group storeroom catalogue, configure inter-plant transfer workflow for critical spares
Frequently Asked Questions
How long does a multi-site CMMS standardization rollout actually take?
Most cement groups complete initial deployment across all sites within four to six weeks, with full group KPI dashboard functionality live within 90 days. Plants migrating from clean existing CMMS data move faster; those migrating from spreadsheets take slightly longer. The pace is primarily determined by asset data migration quality and PM procedure documentation readiness.
Book a demo to get a site-specific deployment estimate for your group.
Can plant managers keep their local procedures while still contributing to group benchmarking?
Yes — by design. Oxmaint's two-tier model lets corporate define mandatory inspection points and KPI methodology, while plants add site-specific steps for local equipment, OEM requirements, or regional regulations. The group dashboard aggregates the mandatory KPIs consistently; local additions are visible only at the plant level. Plant managers retain ownership of their sites without compromising group comparability.
What is the ROI case for a multi-plant CMMS standardization project?
The primary ROI driver is closing the performance gap between plants. A 23 percent kiln availability gap between best and worst performer in a four-plant group represents tens of crores in recoverable production value annually. Cement groups running centralized cloud CMMS monitoring reduce unplanned kiln stops by 60 to 80 percent across the portfolio.
Start with Oxmaint free and demonstrate value at one plant first.
How does a group CMMS handle different equipment configurations across plants?
The corporate PM template library defines inspection points at the asset class level — a "rotary kiln" template covers the universal inspection items common to all kilns. Each plant then extends the template with site-specific additions for their particular kiln OEM, liner configuration, or local auxiliary equipment. The mandatory corporate checklist is always completed; local items are additional.
What happens to plant-level data privacy in a group CMMS?
Oxmaint's enterprise architecture supports role-based access control: plant maintenance teams see only their own plant's detailed operational data. Corporate reliability engineers see the group benchmarking dashboard. Individual plant KPIs are visible to corporate; plant-level work order details and contractor information remain accessible only to authorized site users.
See the access control configuration in a live demo.
Oxmaint Enterprise
Your Group's Best Plant Knows Something the Others Don't. Find Out What.
Oxmaint's multi-site CMMS gives corporate maintenance leaders the visibility to see every plant's performance, identify what the best sites are doing differently, and systematically deploy those practices across the group — in 90 days, not three years.