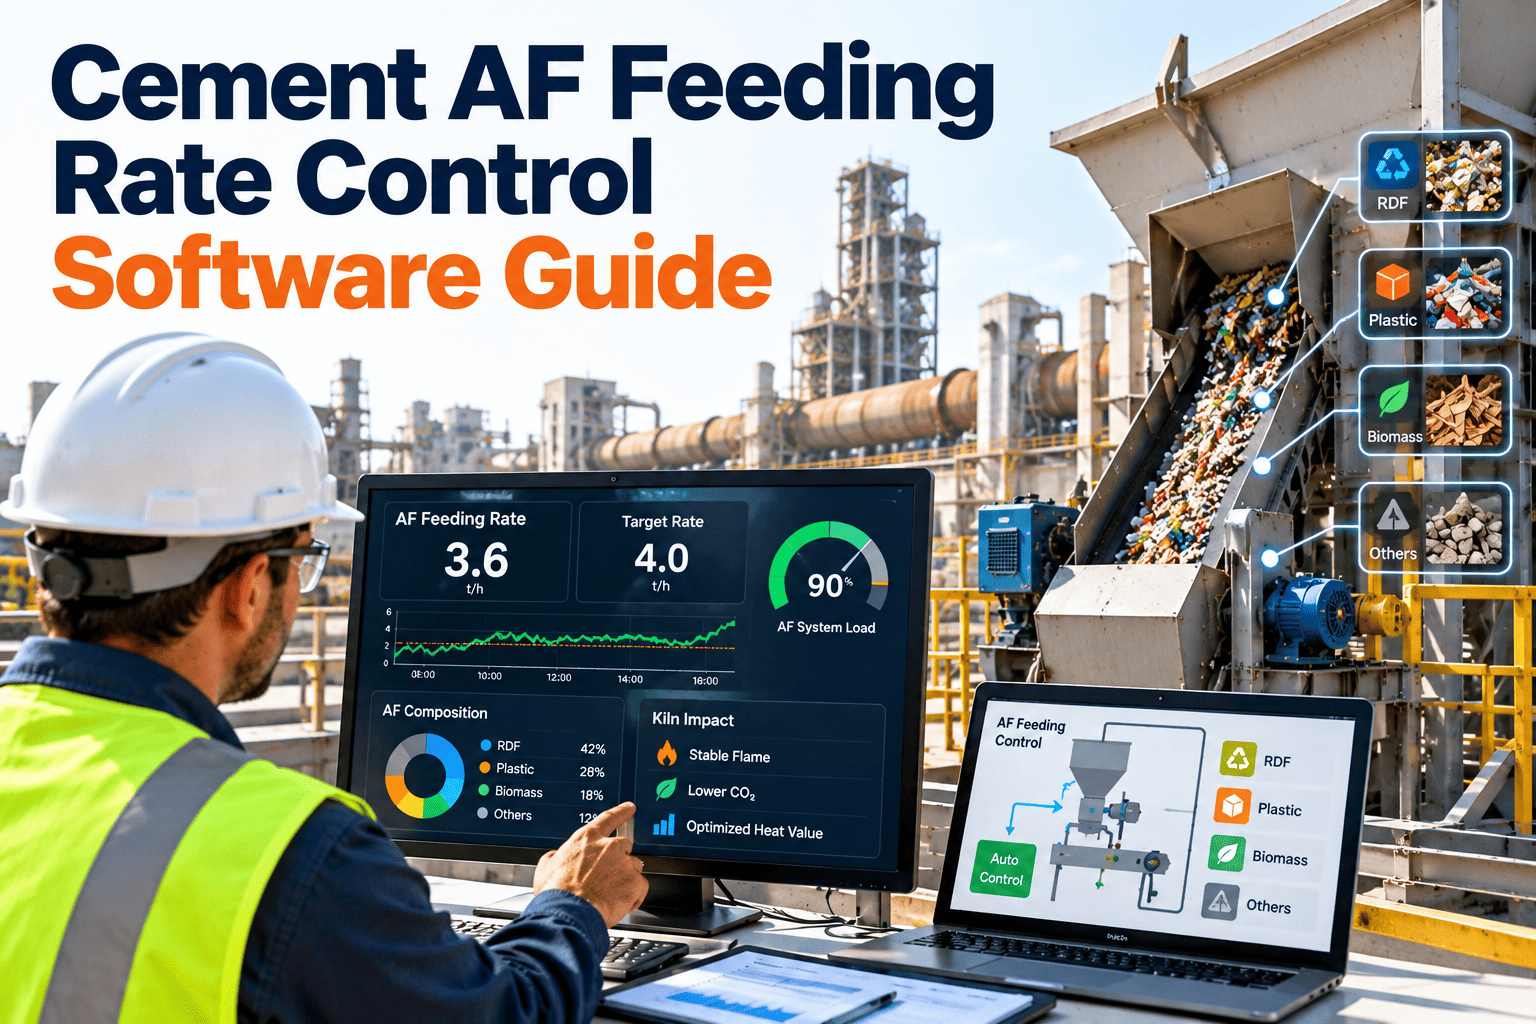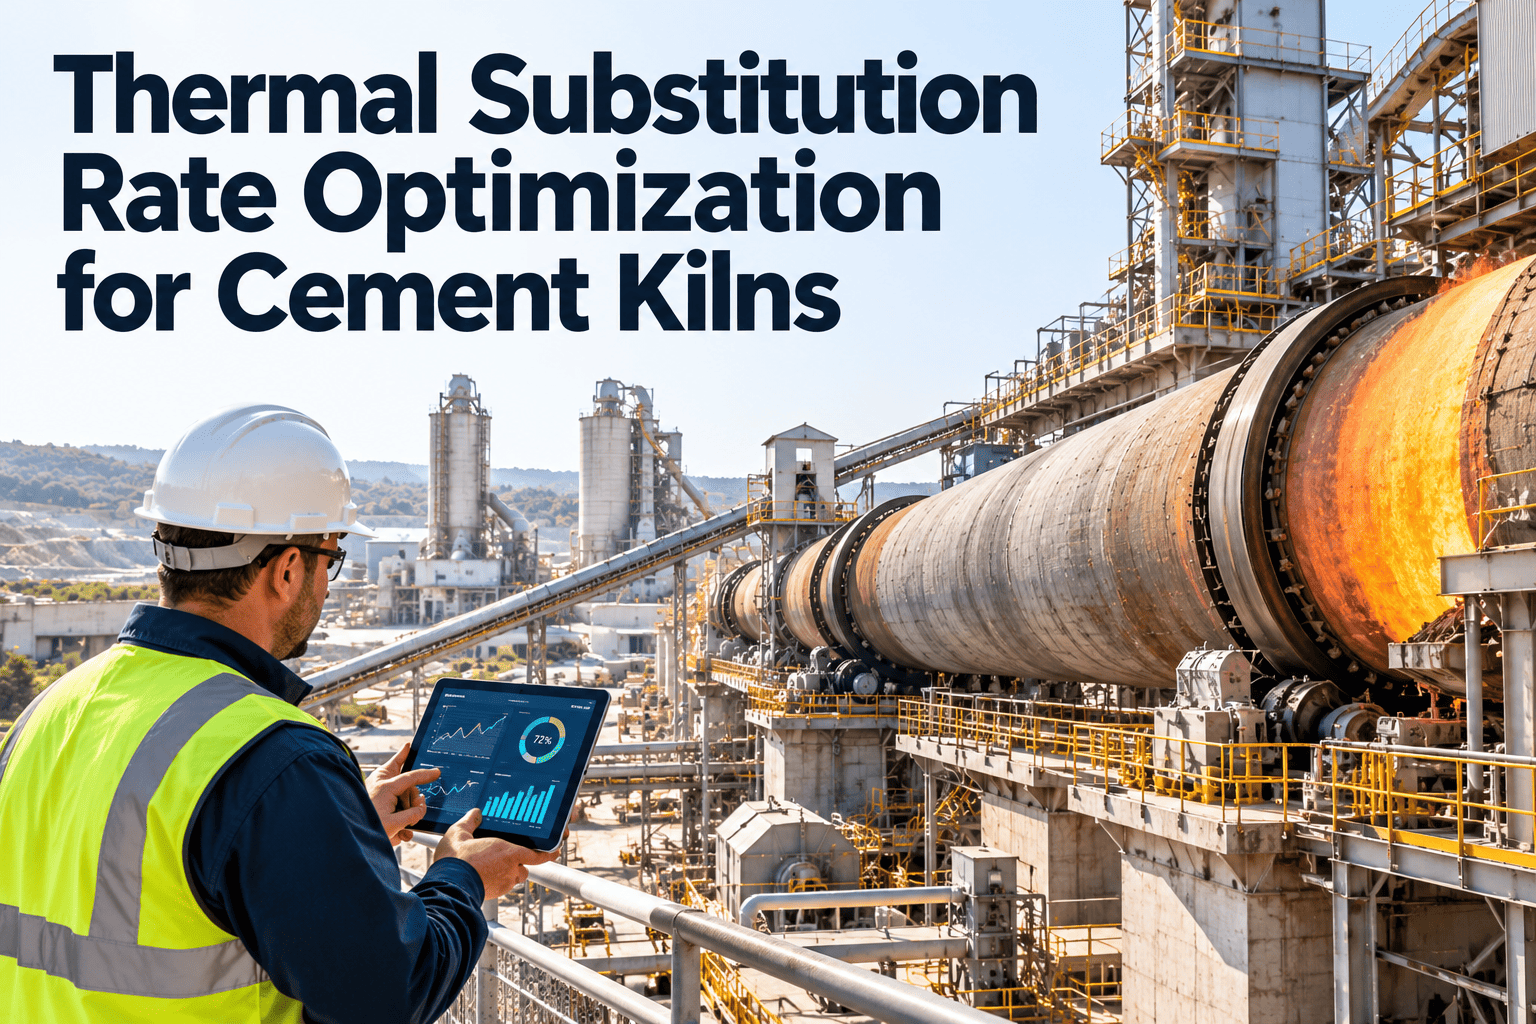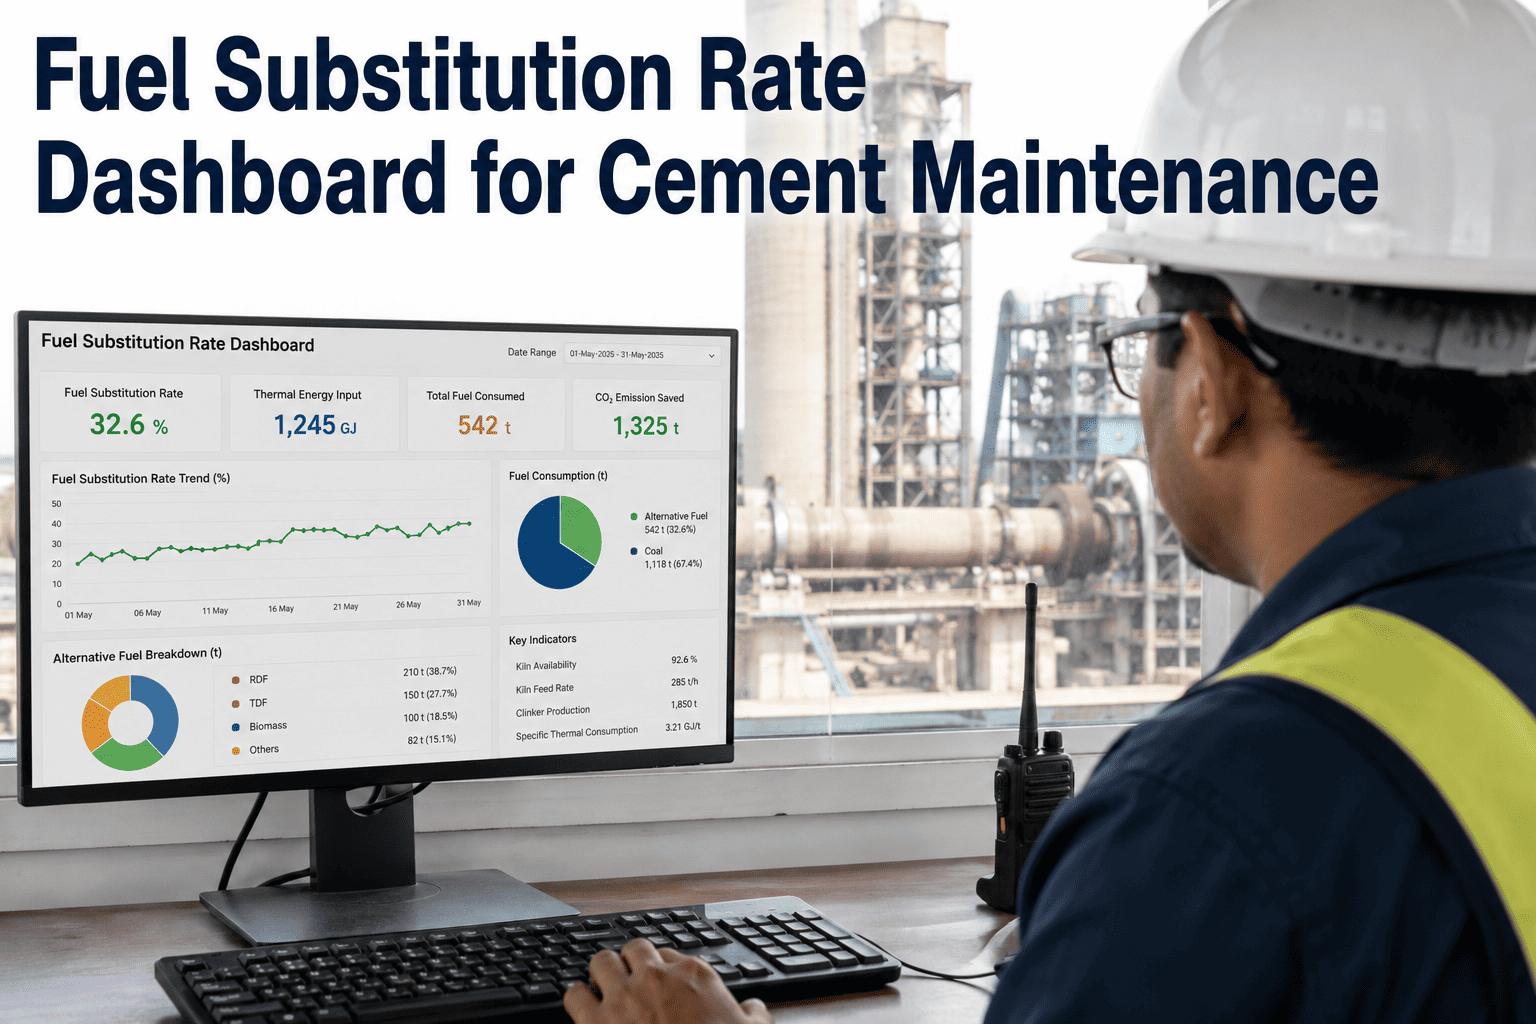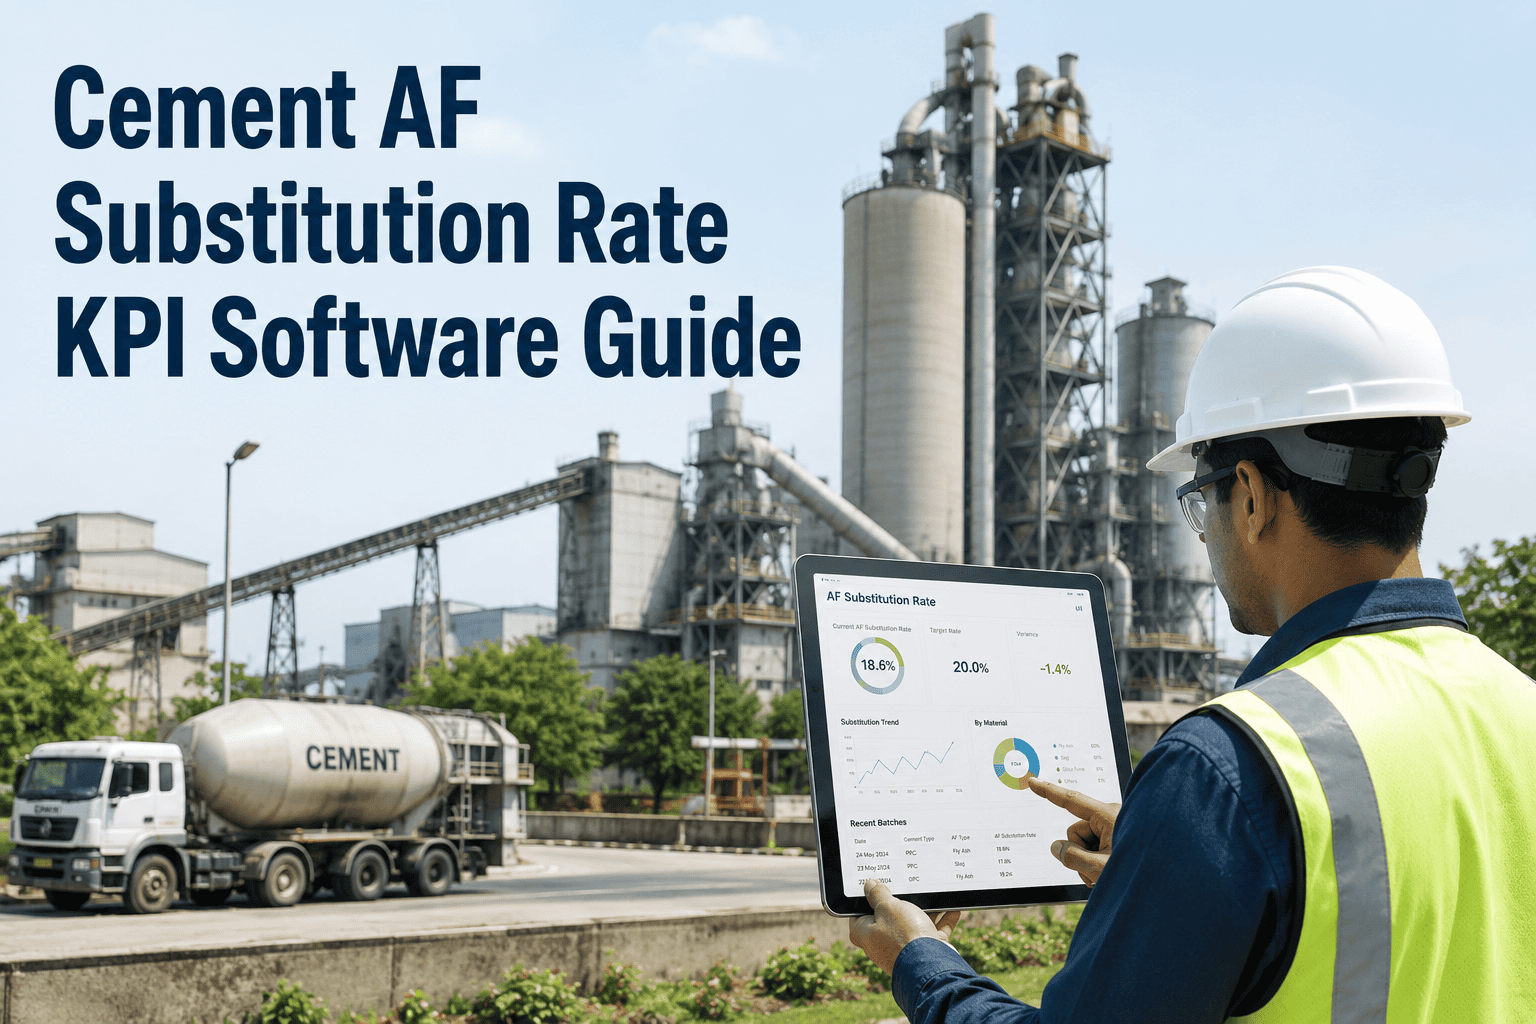
Thermal substitution rate — the percentage of kiln energy coming from alternative fuels instead of coal or petcoke — is the one sustainability number every cement plant CFO and ESG lead has to defend every single quarter, to the board, to investors, and increasingly to regulators. Yet on most plants that number is still assembled from feed-rate logs, weighbridge slips, and a spreadsheet someone rebuilds by hand before every reporting cycle. A single missed fuel delivery ticket or a miscounted RDF batch can shift the reported AF substitution rate by a full percentage point — enough to turn a good quarter into an uncomfortable board conversation. This guide breaks down how the AF substitution KPI is actually calculated, where the reporting typically breaks, and how to turn it into a number your team can defend with a Start Free Trial instead of a scramble.
CEMENT SUSTAINABILITY KPI GUIDE · AF SUBSTITUTION RATE
Can you defend your AF substitution rate number if the board asks where it came from?
Most plants can report a substitution rate. Far fewer can trace it back to a specific fuel delivery, a specific feed rate, and a specific calorific value test — and that traceability is exactly what ESG audits and investor due diligence now ask for.
THE CALCULATION
How thermal substitution rate is actually calculated — and where it breaks
TSR looks like a simple ratio on paper: alternative fuel thermal energy divided by total thermal energy, times 100. In practice it depends on four inputs that live in four different systems, and if any one of them drifts, the reported number stops matching reality.
Where AF thermal energy = Σ (fuel feed rate × calorific value) for every alternative fuel stream, and total thermal energy adds the same calculation for coal and petcoke feed.
Feed rate accuracy
Dosing system feed rates for TDF, RDF, and biomass streams must be logged continuously, not spot-checked. A feeder running 8% under setpoint for a shift quietly understates the whole day's substitution number.
Calorific value testing
RDF and biomass calorific value swings with moisture and composition, sometimes truck to truck. Using a stale lab average instead of current test results is the single biggest source of TSR reporting error.
Weighbridge and delivery data
Every AF delivery ticket needs to reconcile against what actually got fed to the kiln. Gaps between received tonnage and consumed tonnage usually mean either theft, spoilage, or a data entry error worth chasing down.
Coal and petcoke baseline
The denominator matters as much as the numerator. Fossil fuel feed rates need the same logging rigor as AF streams, or the ratio itself becomes unreliable even when AF data is perfect.
FUEL TYPE BENCHMARKS
What realistic substitution rates look like by fuel and by process point
Not every alternative fuel behaves the same way, and not every point in the pyro-system can take the same substitution level. A calciner can run far higher AF rates than a kiln burner, and knowing the ceiling for each stream keeps your KPI targets grounded in physics instead of wishful thinking.
| Fuel Stream | Typical Calorific Value | Achievable TSR | Key Watch-Point |
|---|---|---|---|
| Tire-derived fuel (TDF) | High, stable | Good starting stream, 5–15% | Sulfur loading variability |
| Refuse-derived fuel (RDF) | Moderate, variable | Up to 80–100% in calciner | Moisture and chlorine content |
| Biomass (husks, bagasse) | Moderate | Scales with supply consistency | Seasonal calorific swings |
| Kiln burner (any AF blend) | Blend-dependent | Capped near 50–60% | Flame stability and clinker quality |
Stop rebuilding your TSR number in a spreadsheet every quarter
Pull feed rate, calorific value, and delivery data into one system so your AF substitution KPI is defensible the moment someone asks for the source.
WHERE REPORTING BREAKS
Five reasons your AF substitution KPI does not match what the kiln actually burned
Almost no plant reports a fraudulent TSR number on purpose. What happens instead is a slow accumulation of small, disconnected gaps between what the kiln burned and what got recorded — and each gap below compounds with the others.
Fuel data lives in three different systems
Weighbridge tickets, feeder PLC logs, and lab calorific value reports rarely talk to each other. Someone manually copies numbers between them once a month, and that copy step is where errors enter.
Calorific value updates lag actual deliveries
Using last month's average calorific value for this month's RDF batch is common practice — and it is exactly the shortcut that makes a reported TSR drift away from the real number.
Feeder downtime is not backed out of the average
If an AF dosing line was down for six hours during the month, that period still needs to be excluded from the substitution calculation — otherwise the monthly average understates what the kiln achieved when the feeder was actually running.
No audit trail behind the final number
When an ESG auditor or investor asks to see the source data behind a reported TSR, a static spreadsheet with no linked evidence is a weak answer — and increasingly the answer that gets flagged first.
Reporting is monthly, decisions need to be daily
A monthly rollup tells you what already happened. Plants pushing TSR higher need daily or shift-level visibility so a feeder problem gets fixed the same week, not discovered at quarter close.
CMMS CONFIGURATION
How a CMMS turns AF substitution rate into a number you can trust
The fix is not a better spreadsheet template — it is connecting fuel feed data, lab results, and delivery records to the same system that already tracks your kiln maintenance, so the KPI updates itself instead of getting rebuilt by hand.
Fuel stream asset tracking
Model each AF dosing line and fossil fuel feed as its own asset, so feed rate, downtime, and calorific value all roll up to the same source of truth automatically.
Automated TSR calculation
Feed rate and calorific value inputs calculate substitution rate continuously instead of at month end, so shift supervisors see the day's real number, not last quarter's.
Delivery-to-consumption reconciliation
Match weighbridge tickets against actual feeder consumption automatically, flagging gaps between what was delivered and what was burned before they become a quarter-end surprise.
Downtime-adjusted reporting
Exclude AF feeder downtime windows from the substitution average automatically, so maintenance stoppages do not quietly drag down a number that is actually a maintenance issue, not a fuel one.
ESG-ready audit trail
Every feed rate, lab result, and delivery ticket behind the reported TSR is timestamped and exportable, so an auditor's question gets a source document, not a shrug.
Trend dashboards by fuel type
See substitution rate broken out by TDF, RDF, and biomass separately, so the team knows exactly which stream to push harder on to hit the next target.
We used to spend the first week of every quarter reconciling feeder logs against weighbridge tickets just to get one TSR number the board would accept. Once fuel tracking moved into the CMMS alongside our maintenance data, the number updates daily and every figure traces back to a source record. Our last ESG review took an afternoon instead of two weeks.
FREQUENTLY ASKED
Cement AF substitution rate KPI — straight answers
What is a good AF substitution rate for a cement plant?
Global average sits around 18%, European plants average closer to 46%, and top performers sustain above 70%. A realistic near-term target depends more on feed system design and fuel supply consistency than on kiln size or age.
Why does my reported TSR not match what the kiln actually burned?
Usually because calorific value data lags real deliveries, feeder downtime is not excluded from the average, or fuel data is manually copied between weighbridge, PLC, and lab systems. Each gap compounds into a KPI that drifts from reality.
How often should AF substitution rate be reported?
Daily or shift-level tracking catches feeder and supply problems while they are still cheap to fix; monthly rollups are what boards and ESG reports see, but they should be built from daily data, not calculated fresh at month end. Book a Demo to see a live daily TSR dashboard.
What do ESG auditors actually ask for behind a TSR number?
Increasingly, auditors want source-level evidence — feed rate logs, calorific value test results, and delivery tickets — not just a final percentage. A KPI without a traceable audit trail behind it is a common finding in sustainability reviews.
Can a CMMS actually improve AF substitution rate, not just report it?
Yes — by linking fuel feed reliability to maintenance data, a CMMS surfaces which feeder outages or calibration drifts are capping your substitution rate, so the fix targets the actual constraint. Start Free Trial to connect your fuel and maintenance data in one place.
Make your AF substitution KPI defensible, not just reportable
Connect fuel feed rates, calorific value data, and delivery records to your maintenance system so the next board question or ESG audit gets a source-backed answer in minutes.
Free 14-day trial · No credit card