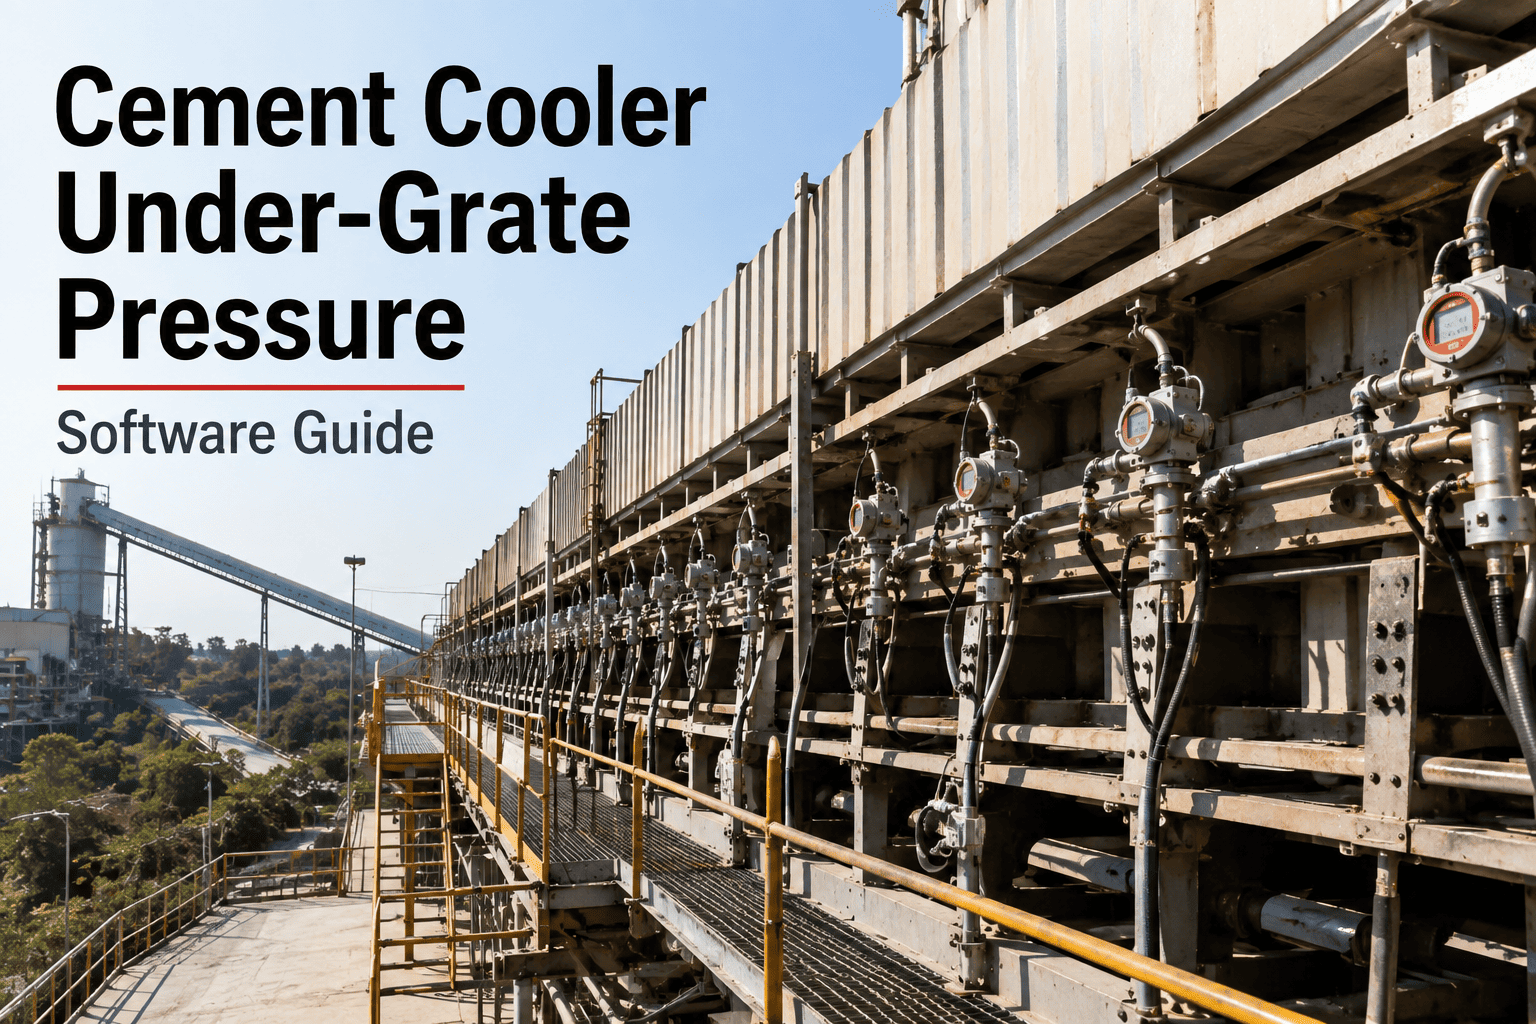
A clinker cooler tells engineers what is wrong with a grate plate roughly six weeks before anyone sees a red river in the clinker bed — but only if someone is watching the under-grate pressure, chamber by chamber. Most plants still log this number by hand once a shift, average it across the whole cooler, and miss the one compartment where slot wear is already collapsing airflow. By the time secondary air temperature drifts and fuel consumption climbs, the plate has usually already failed and adjacent plates are overloaded. The plants that catch this early treat under-grate pressure as a per-compartment trend, not a single control-room number, and route deviations straight into a work order before the shutdown becomes unplanned. See how a structured, compartment-level pressure workflow looks inside a CMMS — Start Free Trial and map your cooler's compartments today.
What if you could see a grate plate failing six weeks before it does?
Under-grate pressure is the fastest-moving number a grate cooler produces. A compartment reading that drifts more than 15% from its own baseline is usually the very first sign of slot wear, a broken plate, or a bed that has started to channel — well before red rivers, spillage, or a discharge temperature spike ever show up on shift logs.
Your cooler isn't one number — it's six to twelve chambers, each telling a different story
A grate cooler is divided into individually fed under-grate compartments running from the red-hot inlet to the cool discharge end. Averaging them into a single control-room pressure reading is exactly how a failing plate in one chamber hides behind healthy readings everywhere else. Here is what a compartment-by-compartment view typically shows across a standard four-zone cooler.
Hot-end inlet chambers
Clinker bed temperature exceeds 1,000°C here, and plates in this zone wear three to four times faster than the cold end. Pressure swings show up first and fastest — this is where the tightest deviation band belongs.
Primary cooling chambers
Carries the bulk of secondary air recovery to the kiln. A sagging pressure trend here is the single strongest predictor of falling secondary air temperature and rising specific heat consumption.
Secondary cooling chambers
Slower-moving bed, moderate wear rate. Pressure here tends to drift gradually, which makes it easy to dismiss as noise — until a sustained trend confirms a genuine airflow imbalance.
Cold-end discharge chambers
Lowest wear rate, longest plate life. A sudden pressure spike here usually points to fines build-up or a partially blocked grate rather than plate wear itself.
The thresholds that separate a shift-log entry from a work order
A single low reading can be an air-blower hiccup. A genuine grate fault shows a sustained compartment deviation held over consecutive shifts. These are the deviation bands plants use to decide when a reading gets logged and when it gets escalated.
| Compartment | Normal Deviation | Watch Band | Escalation Band | CMMS Action |
|---|---|---|---|---|
| Zone 1 — hot end | Within 8% | 8–15% | Over 15% for 3+ shifts | Open WO — plate inspection |
| Zone 2 — primary cooling | Within 10% | 10–18% | Over 18% for 3+ shifts | Open WO — airflow audit |
| Zone 3 — secondary cooling | Within 12% | 12–20% | Over 20% sustained | Log for next shutdown |
| Zone 4 — cold end | Within 15% | 15–25% | Sudden spike, any shift | Open WO — fines / blockage check |
| Hydraulic grate drive | Within 5% | 5–12% | Over 12% sustained | Open WO — drive system check |
Pressure moves first. Temperature confirms it later.
Secondary air temperature is the number everyone watches, because it is tied directly to fuel cost. But temperature is a lagging indicator — by the time it drifts, airflow through the bed has already been uneven for days. Under-grate pressure is the leading signal underneath it.
The symptom everyone sees
A red river forms in the clinker bed, discharge temperature climbs past the 65°C target, or a snowman event blocks a chamber outright. By this point the responsible plate has typically already failed and the plates around it are absorbing extra load.
The signal a compartment trend catches
A single chamber's pressure quietly drifts outside its own historical band while the whole-cooler average still looks normal. Caught here, a plate swap is a scheduled task inside a planned stop, not an emergency reaction to visible damage.
Four steps from a pressure trend to a scheduled repair
Log a per-compartment baseline, not a cooler average
Each chamber gets its own healthy-range reading recorded against the asset record, taken across a stable production run rather than a single shift.
Track drift against that chamber's own history
A CMMS rule compares each new reading to the compartment's baseline, not to a plant-wide standard, and flags a sustained move into the watch band.
Cross-check against secondary air and grate speed
A pressure drop paired with falling secondary air temperature points to plate wear; a spike alone often points to fines build-up or a partial blockage instead.
Push a scoped work order into the next planned stop
The system attaches the compartment ID, likely cause, and a pre-built plate-replacement or airflow-audit template — the planner just schedules it.
Stop averaging your cooler's pressure into blindness.
Set a baseline for every compartment, trend deviations automatically, and let escalation-band readings open the work order for you.
The fuel bill hiding inside an unwatched compartment
Under-grate pressure drift is not just a maintenance metric — it is a direct line to secondary air temperature, and secondary air temperature is a direct line to fuel cost. The figures below are drawn from a representative 5,000 tonne-per-day kiln line.
In a documented case at a single-line cement plant, worn grate plates were completely obscured by clinker buildup during routine visual inspection — a failure that a cross-correlated pressure and temperature trend inside the CMMS would very likely have flagged weeks earlier.
Cement cooler under-grate pressure — answered
How often should under-grate pressure be logged per compartment?
Continuous or hourly logging per chamber is the standard at plants tracking this properly. Manual once-a-shift readings still work if they are compared against each compartment's own baseline rather than a single plant-wide number.
What deviation from baseline actually means a plate is wearing?
A single compartment holding a deviation beyond roughly 15% for three or more consecutive shifts is the widely used signal, especially in the hot-end zones where wear runs fastest. Book a Demo to see the exact bands used for your cooler design.
Can under-grate pressure alone tell you which plate has failed?
Not on its own — it tells you which compartment is affected. Cross-correlating that pressure trend with grate drive speed and tertiary air temperature narrows it down to the specific plate row far faster than a manual walk-down.
Why does hot-end pressure drift faster than cold-end pressure?
Zone 1 plates sit in clinker exceeding 1,000°C and wear three to four times faster than the cold-end zone, so slot widening — and the airflow imbalance it causes — shows up there first and moves quickest.
How does a CMMS turn a pressure deviation into a work order?
A rule watches each compartment's live reading against its own stored baseline. Once the escalation band is held for a set number of shifts, the system opens a pre-built inspection or plate-replacement work order automatically. Start Free Trial to configure this on your cooler.
Give every compartment its own baseline — not a cooler-wide average.
Deploy compartment-level pressure tracking, deviation alerts, and automatic work orders on your grate cooler in under two weeks.
Free 14-day trial · No credit card