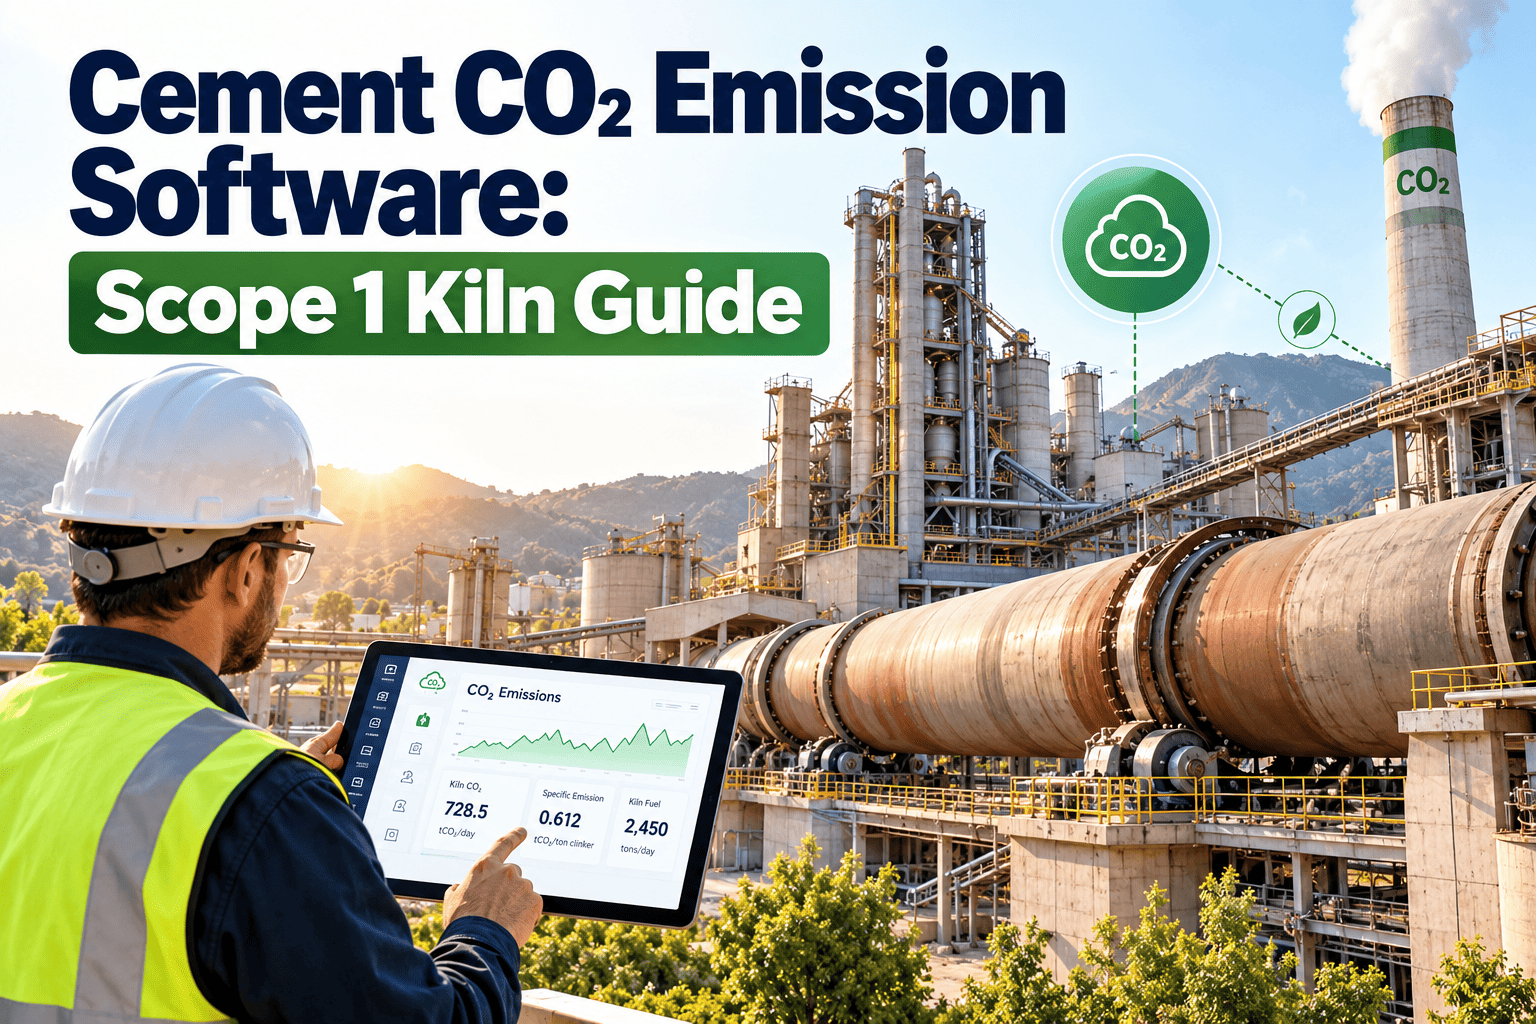
Scope 1 is the largest line in a cement producer's greenhouse gas inventory, and every tonne of it passes through equipment that maintenance teams keep running. Kiln fuel meters, raw meal feeders, preheater cyclones, and emissions monitors all shape the numbers that end up in a sustainability report. When those assets drift, the disclosure drifts with them. A connected cement plant CMMS ties reliable equipment to credible emissions data, and you can try Oxmaint free to map that link across your own kiln line.
Cement Scope 1 CO2: keep kiln data and kiln equipment in the same system
Calcination and fuel combustion create the CO2 you must disclose. Maintenance decides how accurately you measure it and how efficiently you burn.
Where Scope 1 CO2 comes from in a cement plant
Cement is unusual among industries because most of its direct CO2 comes from chemistry, not only from fuel.
Stream one: calcination
When limestone is heated in the preheater and kiln, calcium carbonate breaks down into lime and CO2. Producers generally report that this process share is the larger part of direct emissions.
Stream two: fuel combustion
Coal, petcoke, natural gas, and alternative fuels burned to reach kiln temperatures near 1,450 degrees C produce combustion CO2. Reporting separates fossil and biogenic content.
Stream three: other direct sources
Dryers, on-site power generation, and company fleet fuel also count as Scope 1 under common cement reporting approaches.
- Scope 2 covers purchased electricity and heat, and Scope 3 covers upstream and downstream activity. Neither belongs in the Scope 1 figure.
- Reports can show gross emissions, net emissions, or both. Gross removes pure biomass and biogenic carbon from mixed fuels, while net also removes the alternative fossil fuel portion under the GCCA approach.
The data chain behind every Scope 1 number
A disclosed tonnage is the end of a chain of measurements. A weak link anywhere in the chain weakens the figure.
Fuel metering
Weighfeeders, flow meters, and belt scales measure what the kiln burns.
Risk: calibration drift and worn load cellsRaw meal and clinker
Feed rates and clinker output set the calcination and intensity calculations.
Risk: feeder inaccuracy and sampling gapsLaboratory data
Fuel calorific value, carbon content, and raw meal composition feed emission factors.
Risk: instrument downtime and sample handlingStack monitoring
Continuous emissions systems and flow monitors support direct measurement where used.
Risk: analyzer faults and missed calibrationsCalculation and reporting
Data is consolidated, reviewed, and disclosed with supporting records.
Risk: manual transcription and missing audit trailMaintenance levers that change combustion CO2
Fuel burned per tonne of clinker is the part of Scope 1 that daily equipment condition can move. These are the usual suspects.
| Equipment | Typical failure mode | Effect on fuel use and CO2 | CMMS action |
|---|---|---|---|
| Preheater cyclones | Buildup, blockages, damaged flaps | Poor heat exchange and higher exit gas temperature | Inspection route, cleaning work orders, flap condition checks |
| Kiln seals and shell | Inlet and outlet seal leakage, refractory loss | False air and shell heat loss | Seal inspections, thermography tasks, refractory records |
| Clinker cooler | Worn grates, fan faults, uneven air distribution | Lower heat recovery to the kiln and secondary air | Grate wear tracking, fan vibration checks |
| Burner | Flame shape drift, worn tips, blocked channels | Unstable combustion and extra fuel | Scheduled burner inspection and replacement tasks |
| ID fan and dampers | Fouling, actuator drift | Poor draft control and false air | Condition monitoring, actuator calibration |
| Alternative fuel feeders | Plugging, dosing errors, downtime | Lower substitution rate and more conventional fuel | Feeder preventive maintenance and spares planning |
| Raw mill and fan systems | Unplanned stops that destabilize kiln feed | Kiln upsets and restarts that waste fuel | Reliability tasks and root cause analysis |
Common Scope 1 data problems on the kiln line
Most emissions data issues start as ordinary maintenance issues. Recognizing them early saves time during verification.
| Problem | What it looks like | Maintenance response |
|---|---|---|
| Weighfeeder drift | Fuel totals do not reconcile with deliveries or inventory changes | Scheduled calibration with test weights and recorded results |
| Belt scale wear | Raw meal or clinker tonnage trends away from silo measurements | Idler, belt, and load cell inspection tasks |
| Analyzer downtime | Gaps in continuous monitoring data that need substitution | Preventive service plan and spare parts for analyzers |
| Sampling inconsistency | Fuel quality results vary more than expected | Sampler maintenance and procedure checks |
| Undocumented changes | Meter replaced or relocated without a record | Work orders that update the asset record and tag history |
Calculation or direct monitoring: what each means for maintenance
Plants choose a measurement approach based on regulation, group policy, and equipment. Both depend on dependable assets.
Activity-based calculation
- Uses fuel quantities, raw meal composition, and clinker data
- Depends on weighfeeders, scales, and laboratory methods
- Needs calibration records and sampling discipline
Direct stack monitoring
- Uses continuous gas concentration and flow measurement
- Depends on analyzer, probe, and flow instrument health
- Needs frequent verification and fast repair of faults
Calcination CO2: what maintenance can and cannot change
Be honest with finance and sustainability teams about this split. It avoids promising reductions that equipment care cannot deliver.
Largely fixed by chemistry
- CO2 released per tonne of clinker from the raw meal's carbonate content
- Process emissions that persist even with cleaner fuels
- Reductions that depend on lower clinker factors, new binders, or carbon capture
Where maintenance still helps
- Accurate measurement of feed, clinker, and composition inputs
- Stable kiln operation that avoids off-spec clinker and reburns
- Availability of cement mills and silos that support blended cements
- Reliable sampling and lab equipment behind emission factors
Put kiln reliability and emissions evidence side by side
Link calibration tasks, inspections, and work orders to the assets that produce your Scope 1 data.
Reporting frameworks cement teams work with
Different audiences ask for different formats, but most rely on the same activity data. Confirm which rules apply in your jurisdiction.
| Framework | Role in cement reporting | Why maintenance records matter |
|---|---|---|
| GHG Protocol Corporate Standard | Defines Scope 1, 2, and 3 categories for corporate inventories | Supports the boundary and completeness of reported sources |
| GCCA CO2 Accounting and Reporting Standard | Sector-specific method for calcination, fuel combustion, and gross and net reporting | Requires fuel and material data with traceable quality |
| Cement CO2 Protocol | Earlier industry protocol aligned with the GHG Protocol | Reference for plants still using legacy methods |
| ISO 19694-3 | Harmonized method for greenhouse gas emissions in the cement industry | Addresses measuring instruments and uncertainty of fuel and material data |
| National and regional schemes | Mandatory reporting or emissions trading where applicable | Verifiers may ask for calibration and monitoring evidence |
An annual disclosure readiness calendar
Spread the work across the year so reporting season is a review, not a rebuild.
Close and verify
- Reconcile prior-year fuel and clinker records
- Collect calibration certificates
- Resolve open data quality findings
Calibrate measurement
- Calibrate weighfeeders and flow meters
- Service CEMS and stack flow equipment
- Audit lab sampling procedures
Improve efficiency
- Schedule seal, cooler, and cyclone work in outages
- Review alternative fuel feeder reliability
- Check thermal energy trend per tonne
Prepare the record
- Run data completeness checks
- Document estimates and gaps
- Brief the sustainability team
KPIs that connect reliability to Scope 1
These indicators help maintenance, operations, and sustainability talk about the same plant.
Thermal energy per tonne of clinker
Tracks combustion efficiency and shows the benefit of cooler, seal, and cyclone work.
Alternative fuel substitution rate
Depends on feeder availability, so maintenance gaps show up here first.
Kiln run factor and stop count
Every trip and restart consumes extra fuel and disturbs clinker quality.
Calibration compliance rate
Share of meters and analyzers calibrated on schedule, a proxy for data confidence.
CO2 per tonne of clinker or cementitious product
The headline intensity metric, interpreted with the other four for context.
Alternative fuels add reporting detail
Substituting fossil fuel with waste-derived or biomass fuels lowers reported combustion emissions only when the fuel mix is measured and classified correctly.
- Feed systems for shredded waste, biomass, and other alternative fuels must run reliably, or the kiln falls back to conventional fuel.
- Reporting separates biogenic carbon from fossil carbon, so fuel analysis and documentation need the same care as fuel dosing.
- Storage, handling, and dosing equipment should be treated as emissions-relevant assets with their own preventive maintenance plans.
- Downtime on alternative fuel lines should be coded in work orders so the substitution rate can be explained when it dips.
From work order to disclosure: a traceability path
Assurance reviewers rarely ask for opinions. They ask for evidence. This path shows how maintenance records can answer them.
Asset identified
The fuel weighfeeder is tagged as an emissions-relevant asset in the register.
Calibration scheduled
A recurring preventive task defines the interval, method, and responsible technician.
Result recorded
As-found and as-left readings are attached to the completed work order.
Deviation handled
An out-of-tolerance result opens a corrective order and a note for the data owner.
Evidence exported
The history is available by asset and period when the verifier asks.
What verifiers tend to ask maintenance for
- Calibration certificates and intervals for fuel and raw material meters
- Service history for continuous monitoring equipment
- Explanations for monitoring downtime and data substitution
- Records of equipment changes that affect measurement points
- Evidence that corrective actions followed out-of-tolerance results
- Procedures showing who is responsible for each instrument
How Oxmaint supports Scope 1 data quality
Oxmaint is maintenance management software, not an emissions calculator. Its role is to keep the underlying equipment and records dependable.
Preventive maintenance
Schedule calibration, cleaning, and inspection tasks for meters, feeders, and kiln systems.
Inspections and condition checks
Capture seal, shell, cyclone, and cooler observations on mobile, including offline.
Work orders and root cause
Link kiln stops and fuel-hungry conditions to corrective actions and failure causes.
Reports and dashboards
Export maintenance evidence by asset and period for sustainability and verification teams.
Scope 1 data checklist before sign-off
- Fuel meters and weighfeeders calibrated within their scheduled interval
- Fuel types, calorific values, and carbon factors documented per delivery or period
- Clinker production and raw meal records reconciled with plant totals
- Biomass and alternative fuel fractions documented with supporting analysis
- Monitoring downtime and substituted values recorded with reasons
- Equipment changes that affect boundaries or measurement noted for the period
- Calculation method, tier, and uncertainty documented for reviewers
Why each stakeholder cares about the same kiln data
Scope 1 numbers travel far beyond the plant. Knowing who reads them helps maintenance teams prioritize the right records.
Finance and investors
Decarbonization targets, carbon pricing exposure, and transition plans all start from a baseline that must withstand review.
Customers and regulators
Buyers increasingly ask for product-level carbon data, and regulators may require verified plant-level reporting.
Plant operations
Thermal efficiency and fuel mix are operating decisions, so reliable equipment turns reporting targets into daily practice.
A practical first 90 days
You do not need a full sustainability platform to start. Begin with the assets that touch your emissions data.
Inventory
- List every meter, feeder, analyzer, and sampler feeding the inventory
- Record current calibration status and owners
- Mark gaps in documentation
Schedule
- Create preventive tasks for calibration and service
- Add kiln line inspection routes for seals, cyclones, and cooler
- Assign work to named technicians
Review
- Check completion rates and overdue tasks
- Compare findings with fuel and clinker trends
- Share a summary with sustainability and operations
Scope 1 reporting mistakes to avoid
Treating all CO2 as a fuel problem
Fuel switching cannot erase process emissions, so set expectations early with leadership.
Mixing scopes
Purchased electricity belongs in Scope 2, and keeping the boundary clean avoids restatements.
Ignoring measurement uncertainty
Document the quality of your data instead of presenting every figure as exact.
Losing history after equipment swaps
When a meter is replaced, keep the old record linked so trends stay traceable.
Leaving maintenance out of the conversation
Sustainability teams and maintenance teams share the same assets, so they should share the same records.
Relying on year-end clean-up
Gaps found in December are difficult to explain, while gaps found in March can still be fixed.
Questions to ask your sustainability team this month
- Which meters and analyzers does the Scope 1 calculation rely on, and who maintains each one?
- Which estimates or substituted values were used last year, and could better equipment have avoided them?
- What thermal energy per tonne of clinker did we assume in our reduction targets, and what are we achieving today?
- Which planned kiln outages could also be used to calibrate or replace measurement equipment?
- Where would a verifier find our calibration and service history if they asked tomorrow?
Cement Scope 1 CO2 questions, answered
What counts as Scope 1 CO2 at a cement plant?
Direct emissions from calcination, kiln and dryer fuel combustion, on-site power, and company-owned vehicles.
Can maintenance reduce calcination emissions?
Not directly, because they follow chemistry. Maintenance helps measurement accuracy and kiln stability. Book a demo to see the workflow.
Does a CMMS calculate emissions?
No. It manages equipment, calibration, and maintenance records that support the data used in your emissions calculations.
Which assets affect Scope 1 data quality most?
Fuel weighfeeders, raw meal feeders, flow meters, laboratory instruments, and stack monitors. Sign up to schedule their calibration.
Which reporting standard should we follow?
It depends on your group and regulator. Many producers align with the GHG Protocol and GCCA standard.
Build Scope 1 disclosures on equipment you can trust
Bring calibration, kiln inspections, and corrective work into one system so every reported tonne has a maintenance trail.