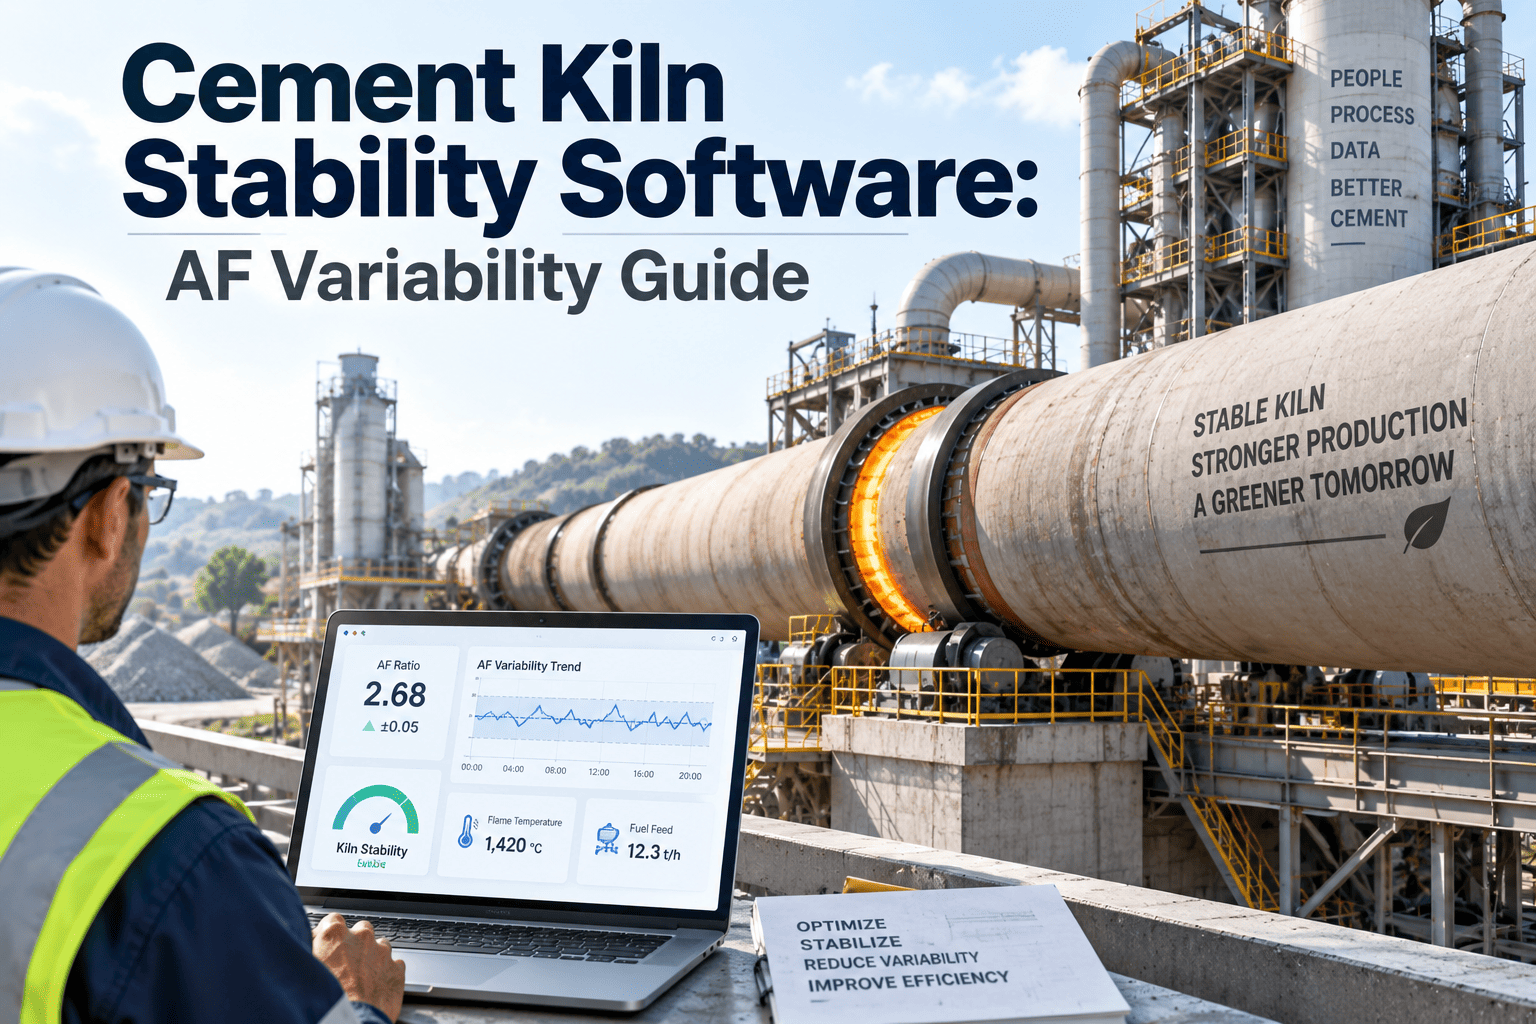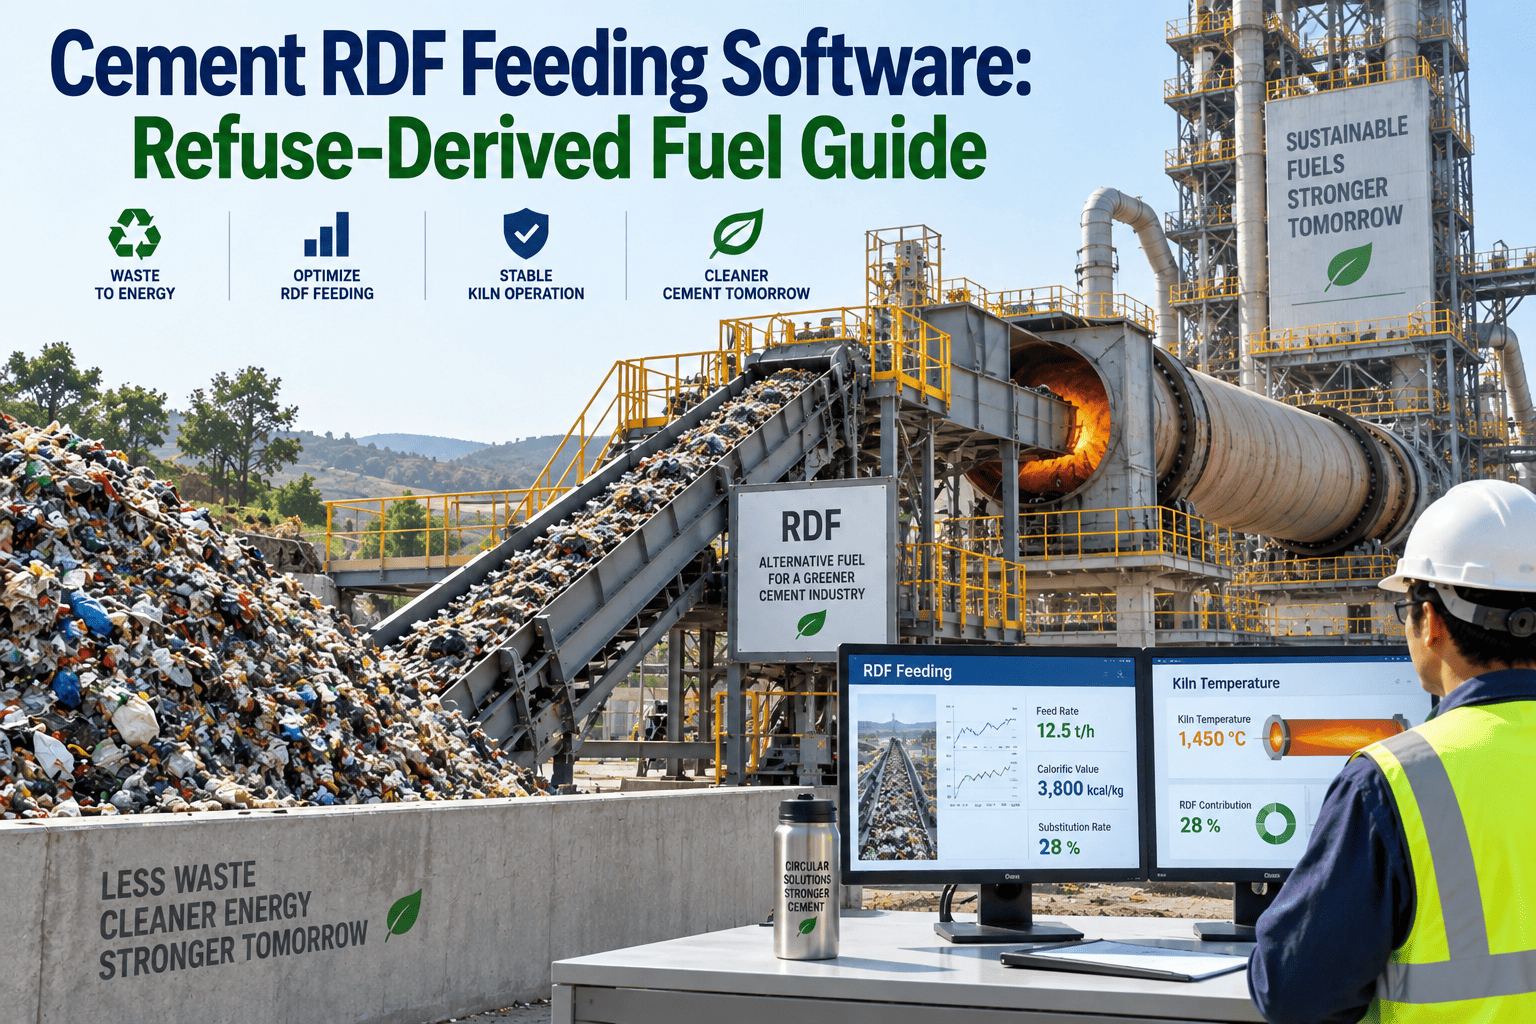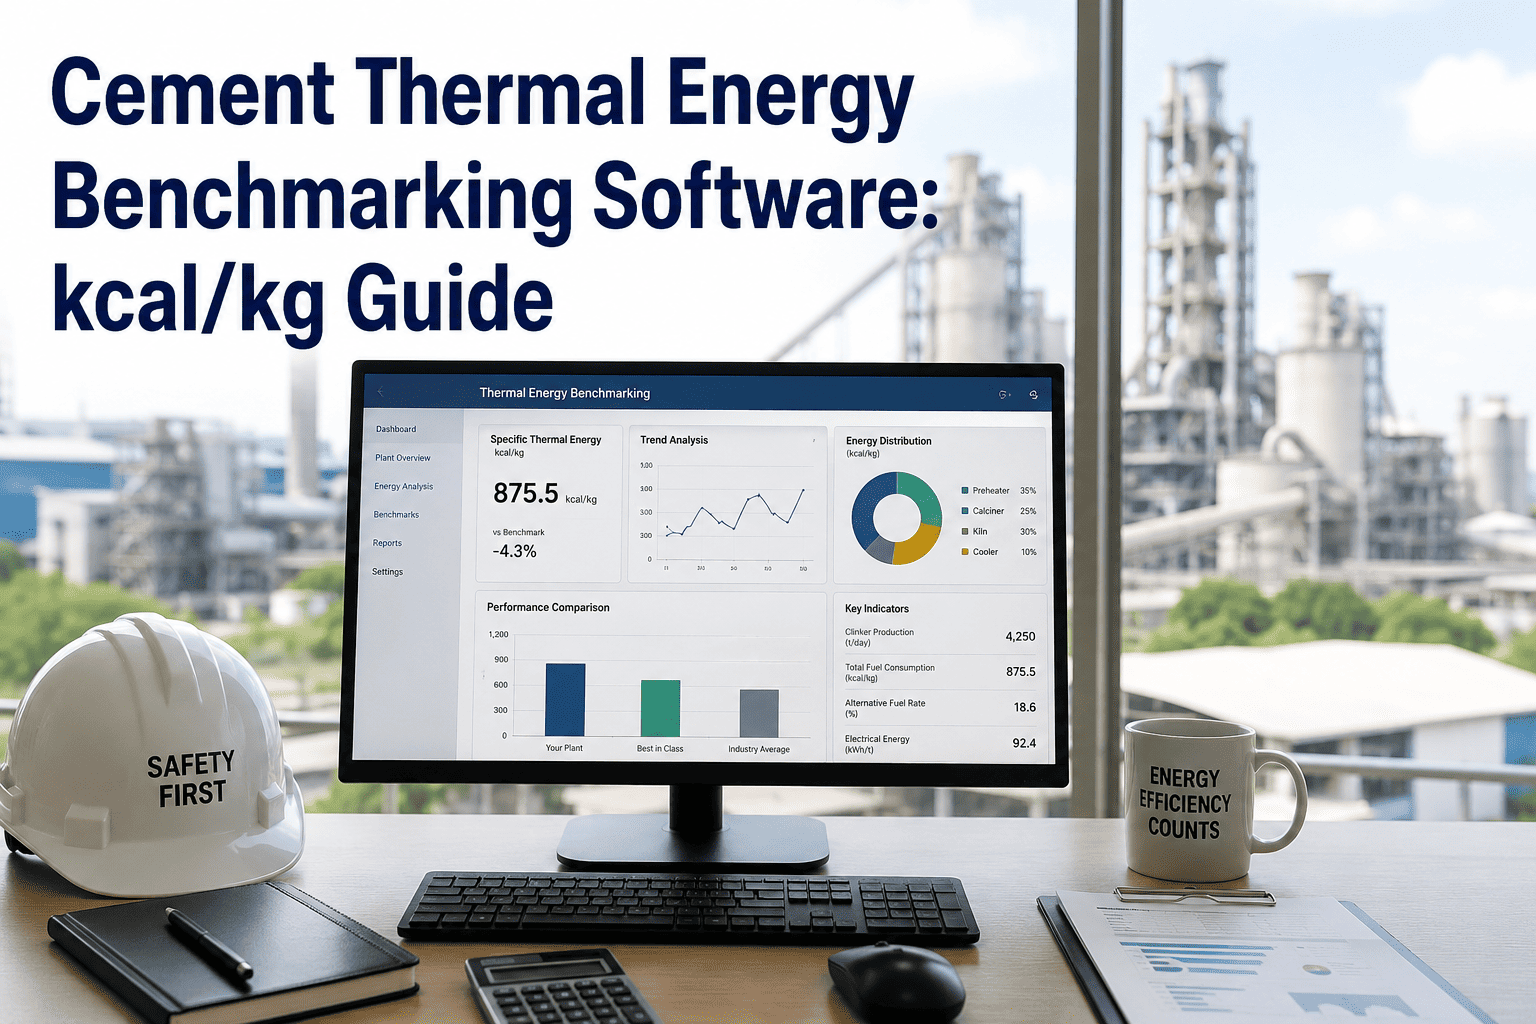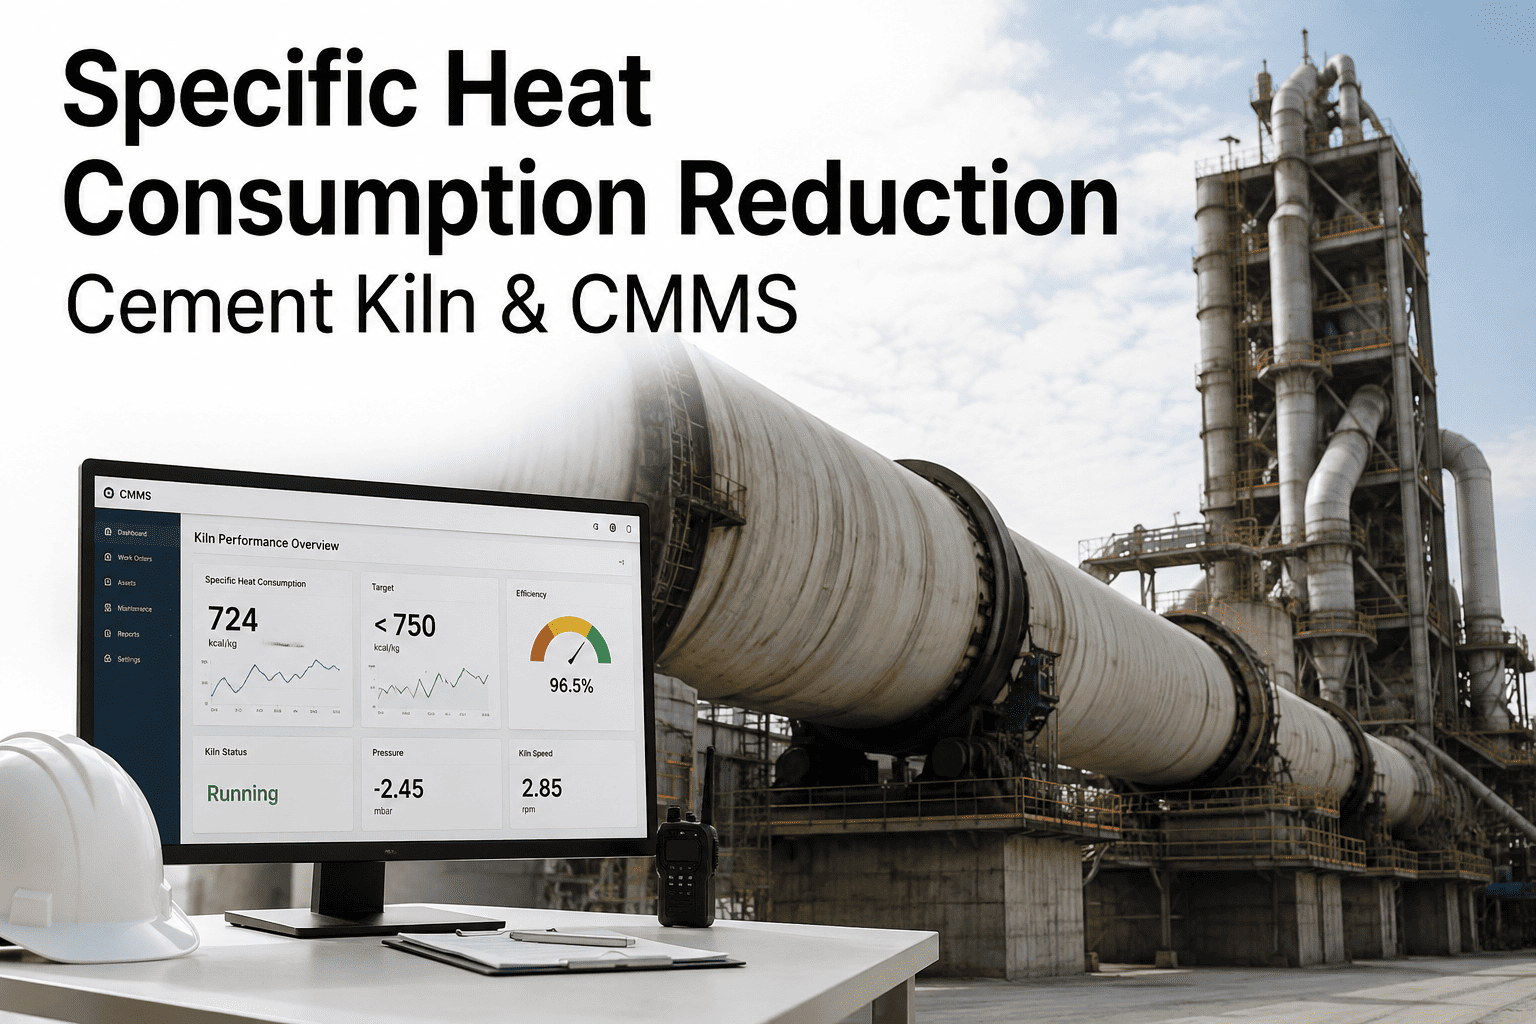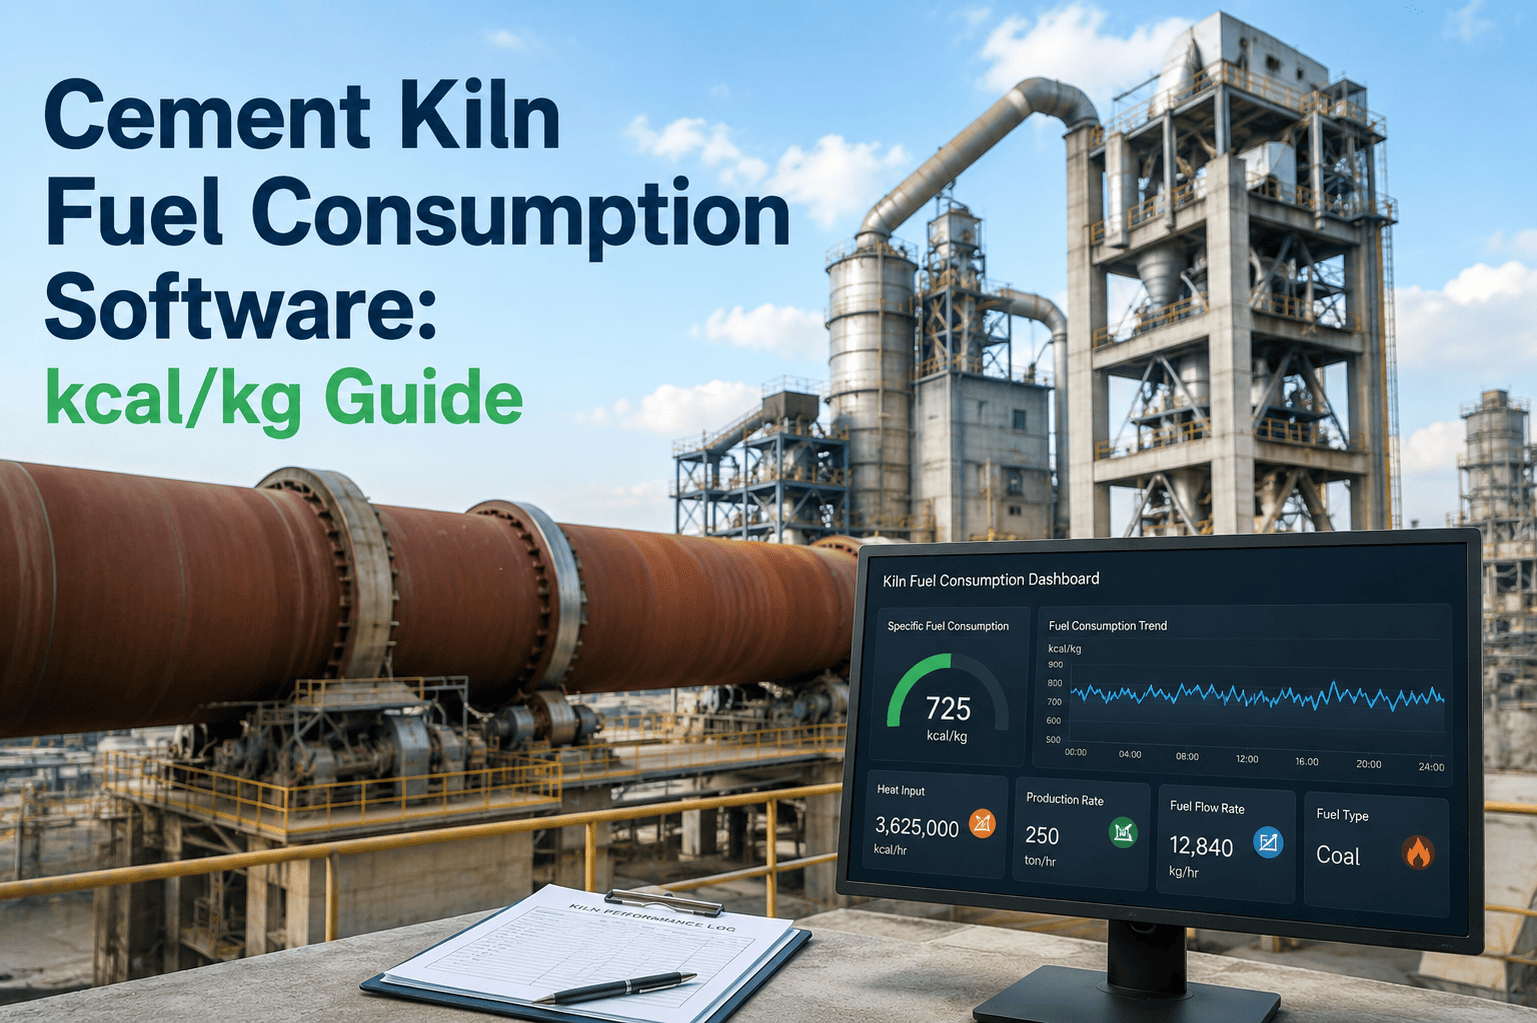
Every cement kiln has two numbers that matter more than almost anything else on the plant report: tonnes produced, and kilocalories burned to make each kilogram of clinker. A modern preheater-precalciner kiln running clean should sit around 690 to 720 kcal/kg. Most plants running the same technology sit closer to 750, and a handful drift past 800 without anyone tracing the gap back to a cause. That gap is rarely a fuel problem — it is a maintenance problem wearing a fuel bill as a disguise, and closing it is exactly what plants track inside OxMaint.
Cement Kiln Fuel Consumption Software
Track thermal SEC against the 690–720 kcal/kg benchmark, trace every kcal/kg of drift back to a maintenance condition, and close the gap before the next price review.
The kcal/kg Number Every CFO Asks About and Almost No Plant Can Break Down
Ask most plant managers what their thermal SEC is and they will give you a number to three decimal places. Ask them which loss stream is driving the gap between that number and what the heat balance says is achievable, and the answer usually stops at "the kiln." A heat balance audit does not just measure total consumption — it splits that consumption into the four streams below, and each one maps back to a specific, fixable maintenance condition rather than a fuel-quality excuse.
Productive Heat
The energy that actually does the job — decarbonation and clinkerization of the raw meal. This is the only share of the fuel bill that is not, in some sense, a loss to chase.
Exhaust Gas Loss
Hot gas leaving the preheater string carries away the largest single loss stream, and it grows fast wherever false air enters through cyclone doors, expansion joints, or meal pipes.
Shell Radiation Loss
Heat radiating directly off the kiln barrel, concentrated wherever refractory has thinned or coating has fallen away. A thermal scan turns this into a visible map of energy leaks.
Cooler & Unaccounted Loss
Sensible heat that should return to the kiln as combustion air but escapes through the vent stack via worn grate plates, plus dust carryover and minor measurement gaps.
Six Maintenance Conditions That Quietly Move the kcal/kg Number
Fuel consumption rarely jumps overnight — it creeps, degree by degree, as specific components wear past the point where they can hold the heat balance where it was designed to sit. These are the six drivers that show up on the energy bill weeks before they ever generate a work order.
Excess Combustion Air
Every 1% of excess air above the stoichiometric requirement adds roughly 0.5 to 1.0% to specific fuel consumption. Burner air-fuel ratio and O2 trim calibration is the single highest-return monthly check on the whole kiln.
False Air In-Leakage
Worn expansion joints, unsealed inspection doors, and cracked cyclone walls let ambient air into the gas stream. Each 1% of false air raises exhaust heat loss by roughly 3 kcal/kg, and plants typically accumulate 5 to 8% between shutdowns.
Refractory Shell Loss
Thinned or missing refractory coating turns sections of the kiln barrel into a continuous radiation leak. A thermal shell scan converts a visual inspection into a quantified kcal/kg figure for every hot spot found.
Secondary Air Temperature
Secondary air drawn from the cooler should stay above roughly 900°C. Every 50°C drop below that target costs approximately 5 kcal/kg clinker, usually traced back to grate plate wear or uneven bed depth.
Burner Tip Condition
A degraded burner tip distorts the flame shape and pushes excess air higher to compensate. Replacing a worn tip typically saves 5 to 8 kcal/kg immediately, visible on the very next shift's fuel log.
Cyclone Fouling
Build-up inside preheater cyclones reduces heat exchange efficiency between hot gas and incoming raw meal, forcing more fuel to reach the same calcination degree at the kiln inlet.
Where Your Kiln Sits Against the Sector — kcal/kg by Technology
Thermal efficiency is dictated first by kiln technology and only second by how well that technology is maintained. The table below is a useful reality check before chasing an unrealistic target — a well-run wet kiln will never reach preheater-kiln numbers, but every technology has a maintenance-driven range it can be held within.
| Kiln Technology | Typical Range (kcal/kg) | Thermal Efficiency | Primary Loss Driver |
|---|---|---|---|
| Modern Preheater–Precalciner | 690–800 | 52–55% | Exhaust gas and false air |
| Preheater Only (No Calciner) | 800–950 | 42–50% | Exhaust gas temperature |
| Long Dry Kiln | 1000–1300 | 35–42% | Shell radiation over kiln length |
| Wet Process Kiln | 1300–1800 | 25–35% | Slurry moisture evaporation |
Stop Explaining kcal/kg Drift as a Fuel-Quality Problem
OxMaint tracks heat balance parameters against maintenance state — burner condition, refractory thickness, seal integrity, grate plate wear — so process and maintenance teams work from the same number instead of two different stories.
Why kcal/kg Is a Cost Line, Not Just a Process Metric
Thermal energy in the kiln system and electrical energy in grinding together account for roughly 60 to 70% of total cement production cost per tonne, which makes fuel the single largest lever a plant controls between raw material cost and market price. A kiln running 40 kcal/kg above its achievable benchmark is not losing a rounding error — on a million-tonne clinker line, that gap compounds into a fuel bill line that shows up in every quarterly review, whether or not anyone has traced it back to a seal, a burner tip, or a grate plate.
The reason this gap survives so long in most plants is not a lack of data — it is that the data lives in two places that never talk to each other. Process engineers watch the fuel log. Maintenance watches the work order backlog. Neither view shows the other team the connection between a seal that has been on the deferred list for two shutdowns and the 20 kcal/kg of exhaust loss it is quietly generating every single day it stays unreplaced.
A Kiln Mid-Cycle — What Live SEC Tracking Actually Shows
The board below is what thermal SEC tracking looks like inside a CMMS on a live kiln, thirty days after a shutdown. Every loss stream is tied back to a specific asset condition instead of sitting inside one unexplained efficiency percentage on a monthly report.
Unexplained Fuel Bill vs Maintenance-Linked SEC Tracking
Almost every plant already tracks total kcal/kg on a monthly report. What separates a plant that closes the gap from one that files the same report every month unchanged is whether that number is connected to the maintenance condition that is actually driving it.
| SEC Management Element | Monthly Fuel Report | Maintenance-Linked Tracking | Typical Outcome |
|---|---|---|---|
| Loss Attribution | Total kcal/kg reported, cause unclear | Each loss stream tied to a specific asset condition | Corrective work order instead of a shrug |
| Response Time | Drift noticed after month-end close | Drift flagged within days against rolling window | Weeks of avoidable fuel loss recovered |
| Burner & Seal Maintenance | Scheduled on calendar interval regardless of condition | Scheduled against measured excess air and false air trend | Interventions timed to actual need |
| Capital Prioritisation | Refractory and seal spend competes without data | Each fix ranked by expected kcal/kg recovery | Fastest payback work funded first |
Six Practices That Hold a Kiln Near Its Best Achievable SEC
Plants that consistently run near the top of their technology's thermal efficiency range are not burning a different fuel — they are running these six checks as scheduled maintenance rather than as an occasional energy audit. None of the six is individually complicated, and none requires capital investment on its own. What makes the difference is that they run on a fixed interval regardless of production pressure, and every result feeds back into the same SEC record instead of sitting in a separate binder that nobody revisits until the next audit season.
Burner Air-Fuel Ratio Check
O2 trim controller calibrated and excess air measured against stoichiometric target — the single highest-return recurring check on the kiln.
Expansion Joint & Seal Inspection
Inlet seals, cyclone doors, and expansion joints checked and replaced before false air accumulates back toward the 5 to 8% range typical between stops.
Thermal Shell Scan
Full kiln barrel scanned for hot spots tied to refractory wear, converting a visual walk-down into a quantified radiation-loss figure.
Burner Tip Inspection
Tip condition checked every stop, replaced at minimum annually. Fuel consumption change tracked immediately after every swap.
Cooler Grate & Bed Depth Check
Uniform bed depth verified across cooler width. Uneven distribution is the earliest visible sign of secondary air temperature loss.
Rolling SEC Trend Review
kcal/kg plotted daily against a rolling window rather than reviewed only at month-end, catching drift while it is still a single-digit gap.
What Maintenance-Linked SEC Tracking Returns
These figures come from cement plants that connected their thermal SEC trend to maintenance condition instead of reviewing it as an isolated monthly number, tracked across the first year after adoption. The pattern across every one of them is the same — the biggest gains come not from a single large capital project but from closing several small, previously invisible gaps at once, each one traceable to a specific piece of kiln hardware rather than a vague reference to fuel quality or ambient conditions.
Reported reduction in cement plant energy consumption from maintenance-driven optimization of kiln and grinding systems together.
Immediate, measurable reduction visible on the very next shift's fuel log after a worn burner tip is replaced.
Exhaust heat loss added for every percentage point of false air in-leakage, now caught within days instead of at month-end.
Process and maintenance teams working from the same SEC figure, tied to the same asset conditions, instead of two separate stories.
Frequently Asked Questions
What is a good thermal SEC benchmark for a cement kiln?
How much does false air actually cost in fuel terms?
Why does a burner tip swap show up so fast on the fuel log?
How does OxMaint connect fuel consumption to maintenance data?
What is a realistic payback period for closing an SEC gap?
Close the Gap Between What You Burn and What the Heat Balance Says Is Possible
OxMaint keeps thermal SEC, loss-stream attribution, and every related work order inside one system — so the next price review comes with an answer, not an estimate.