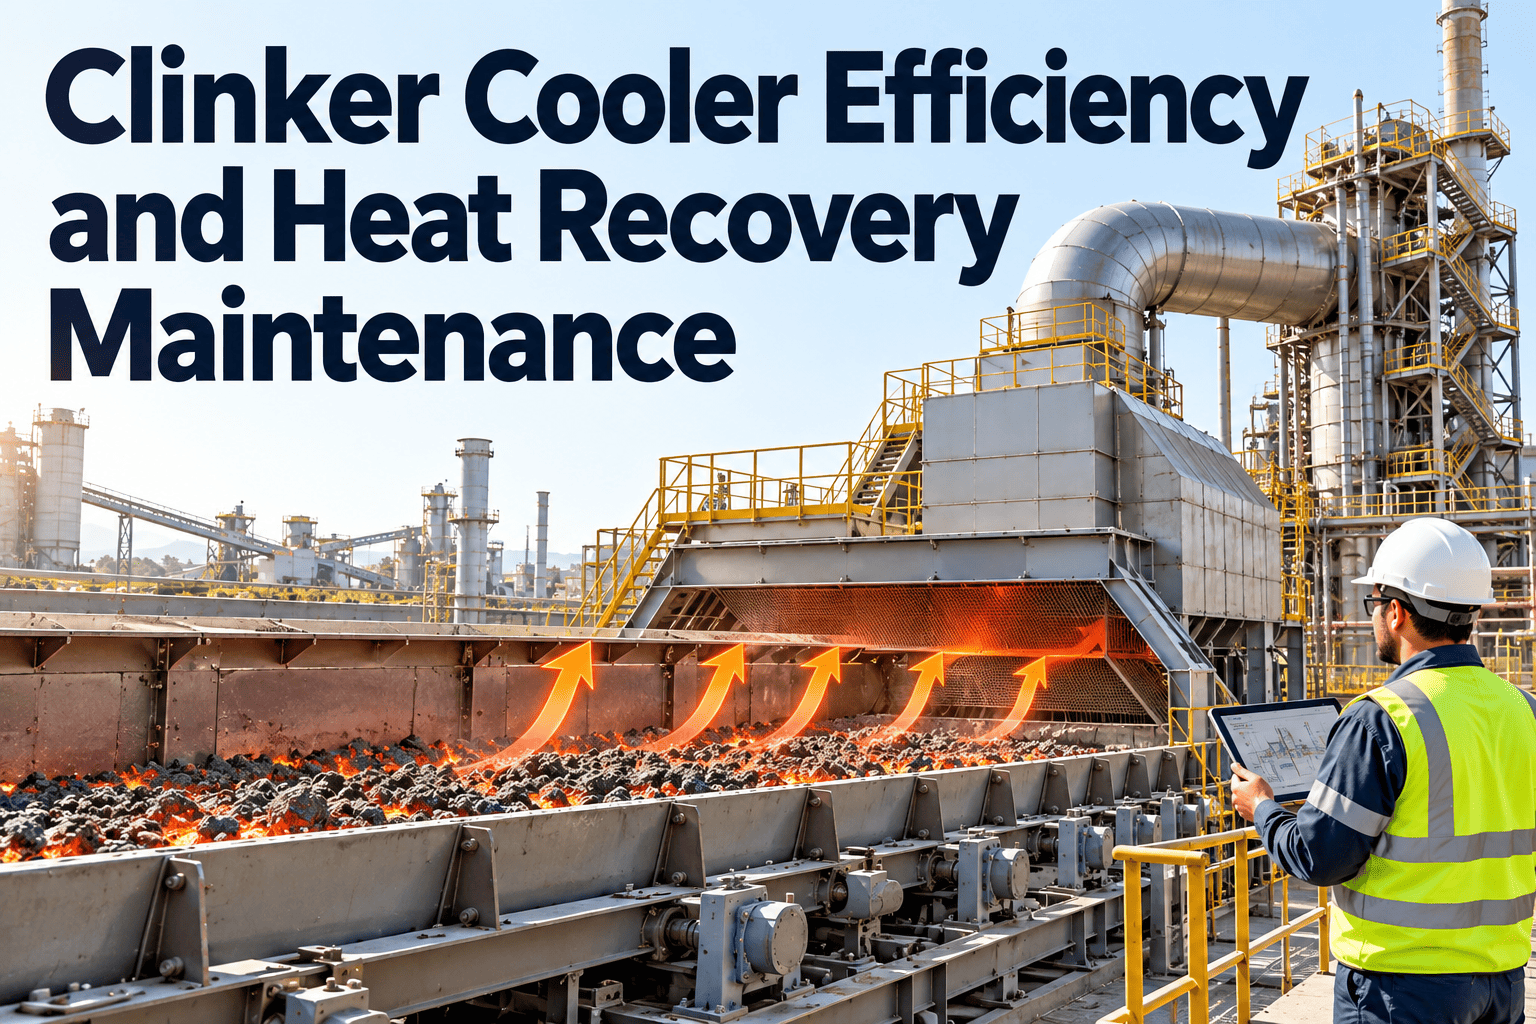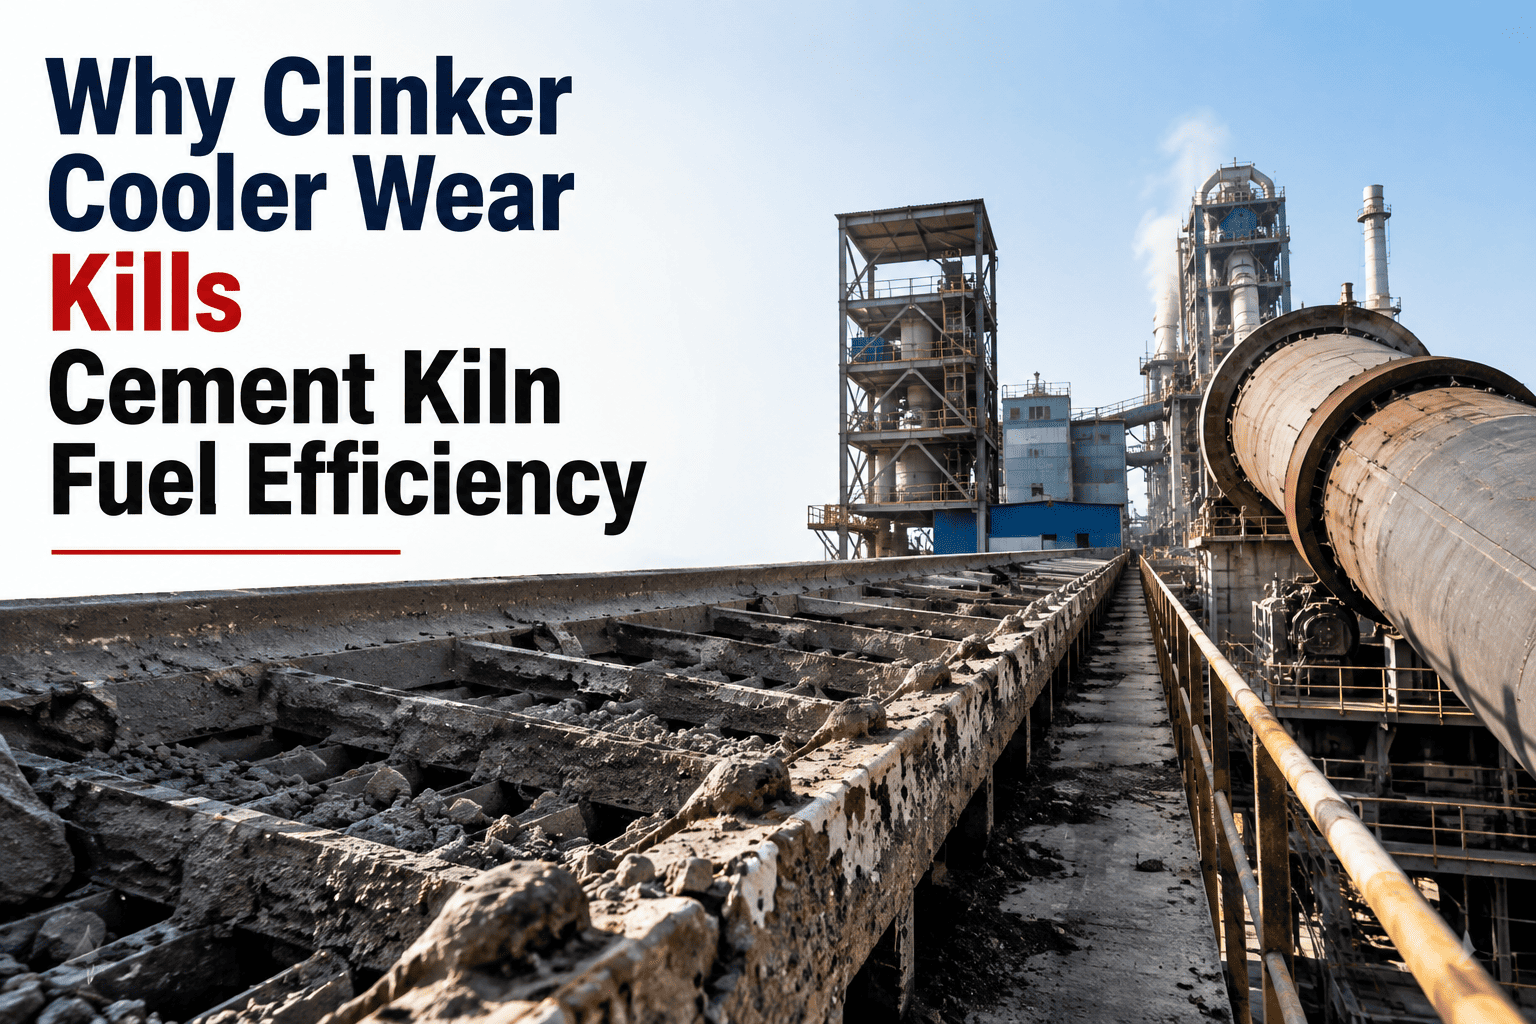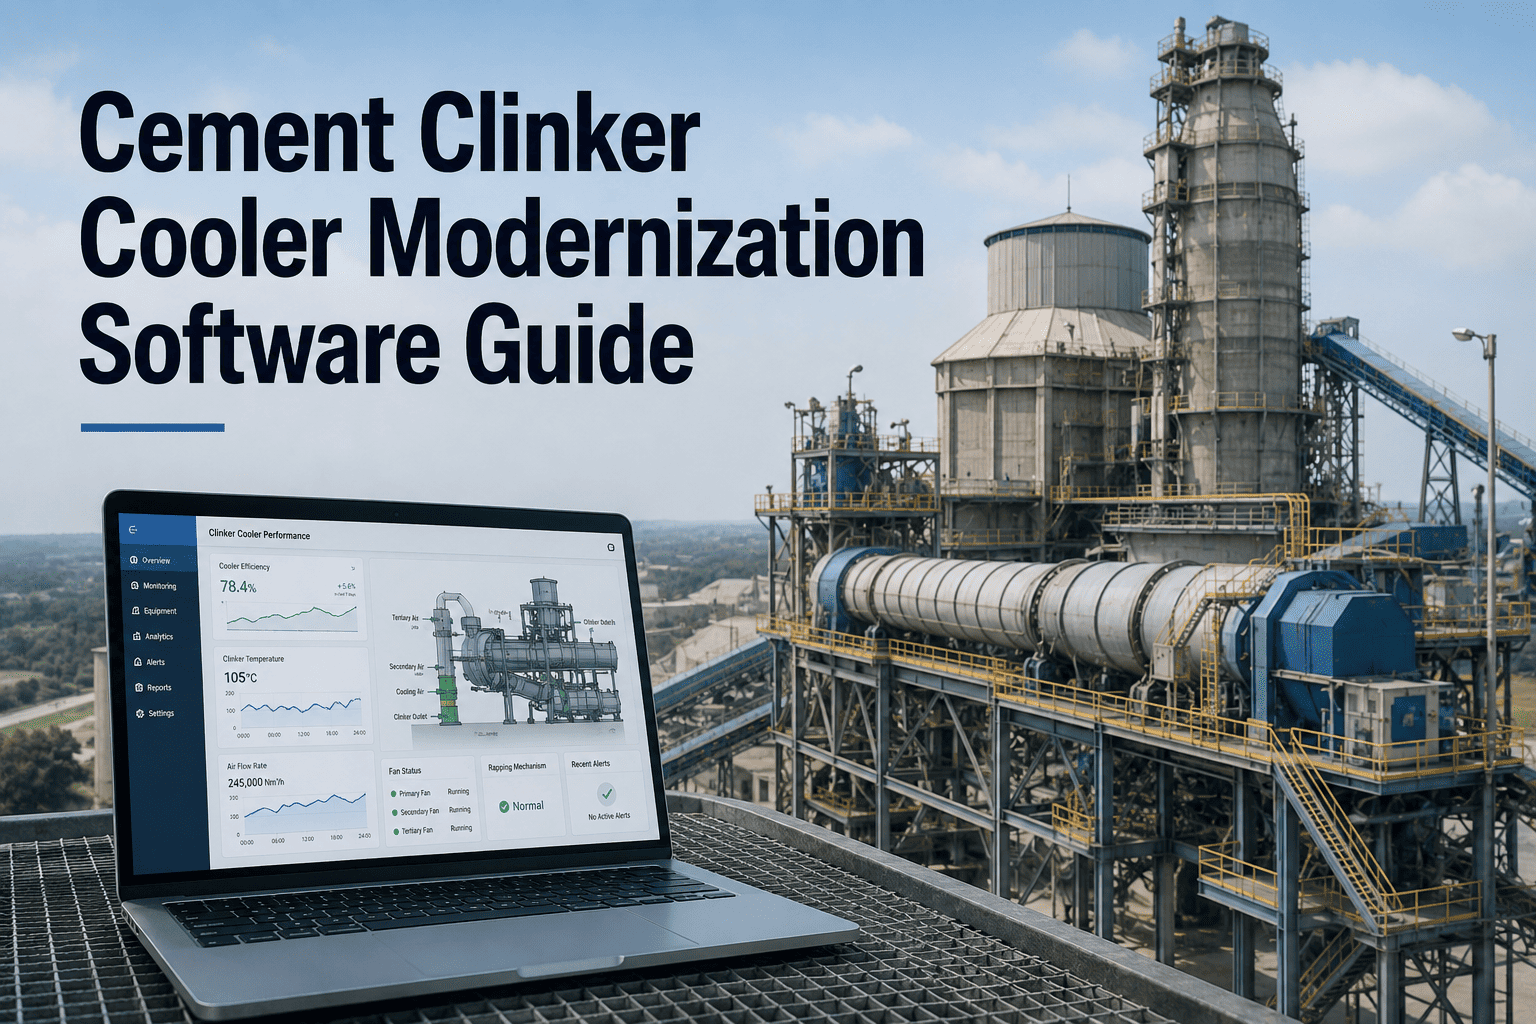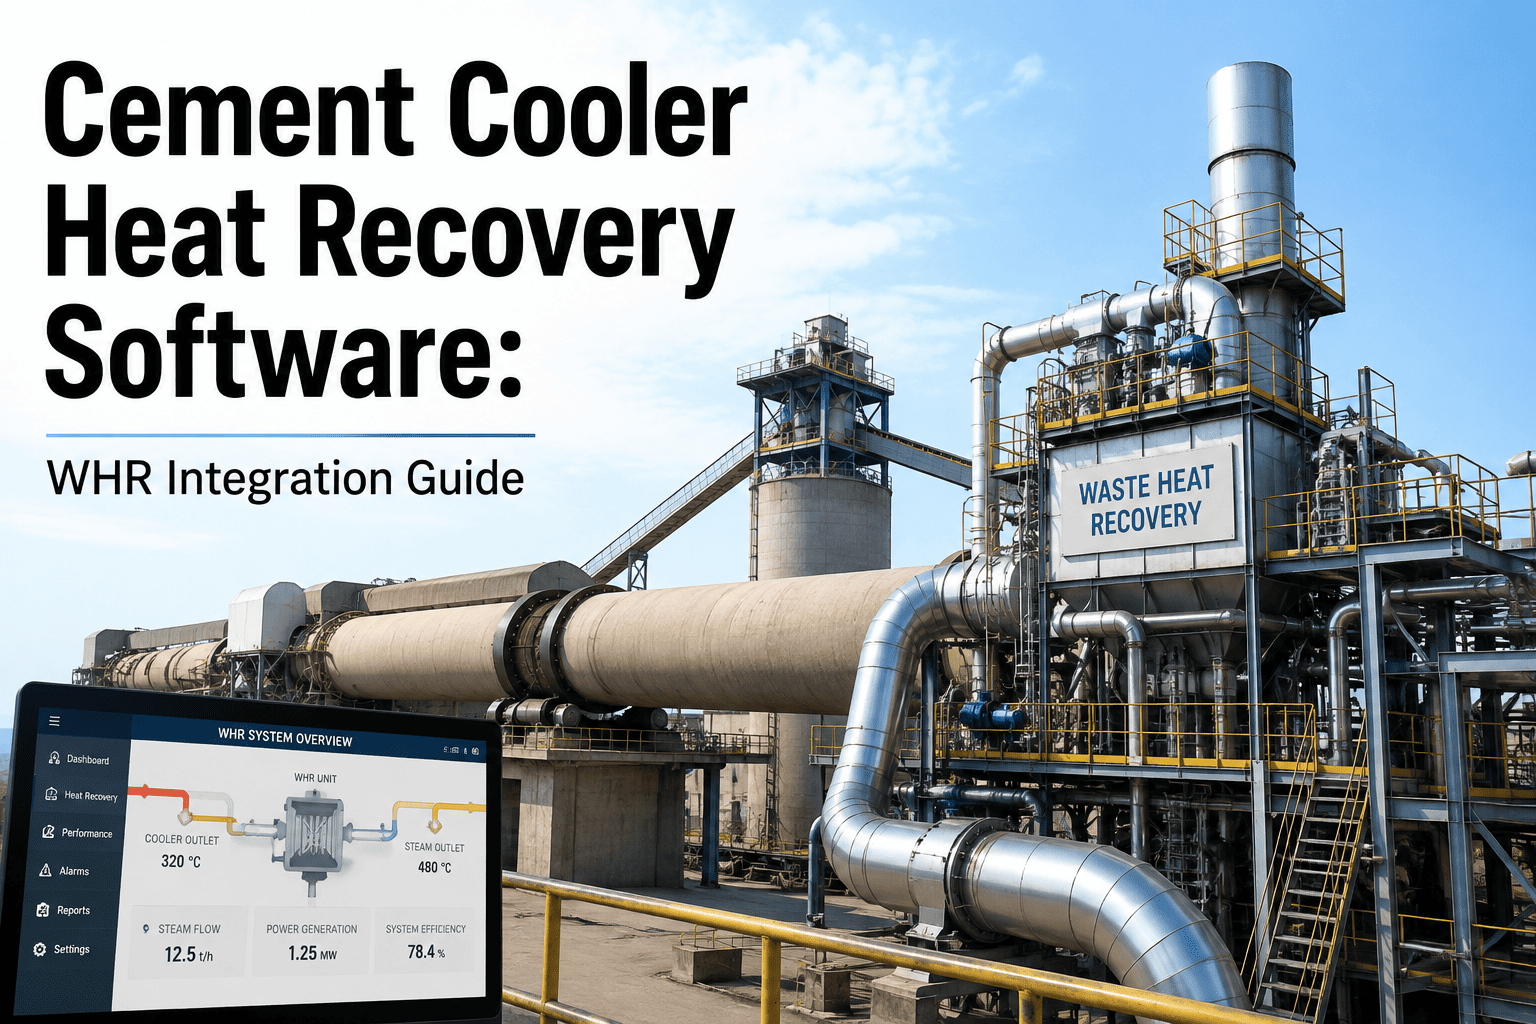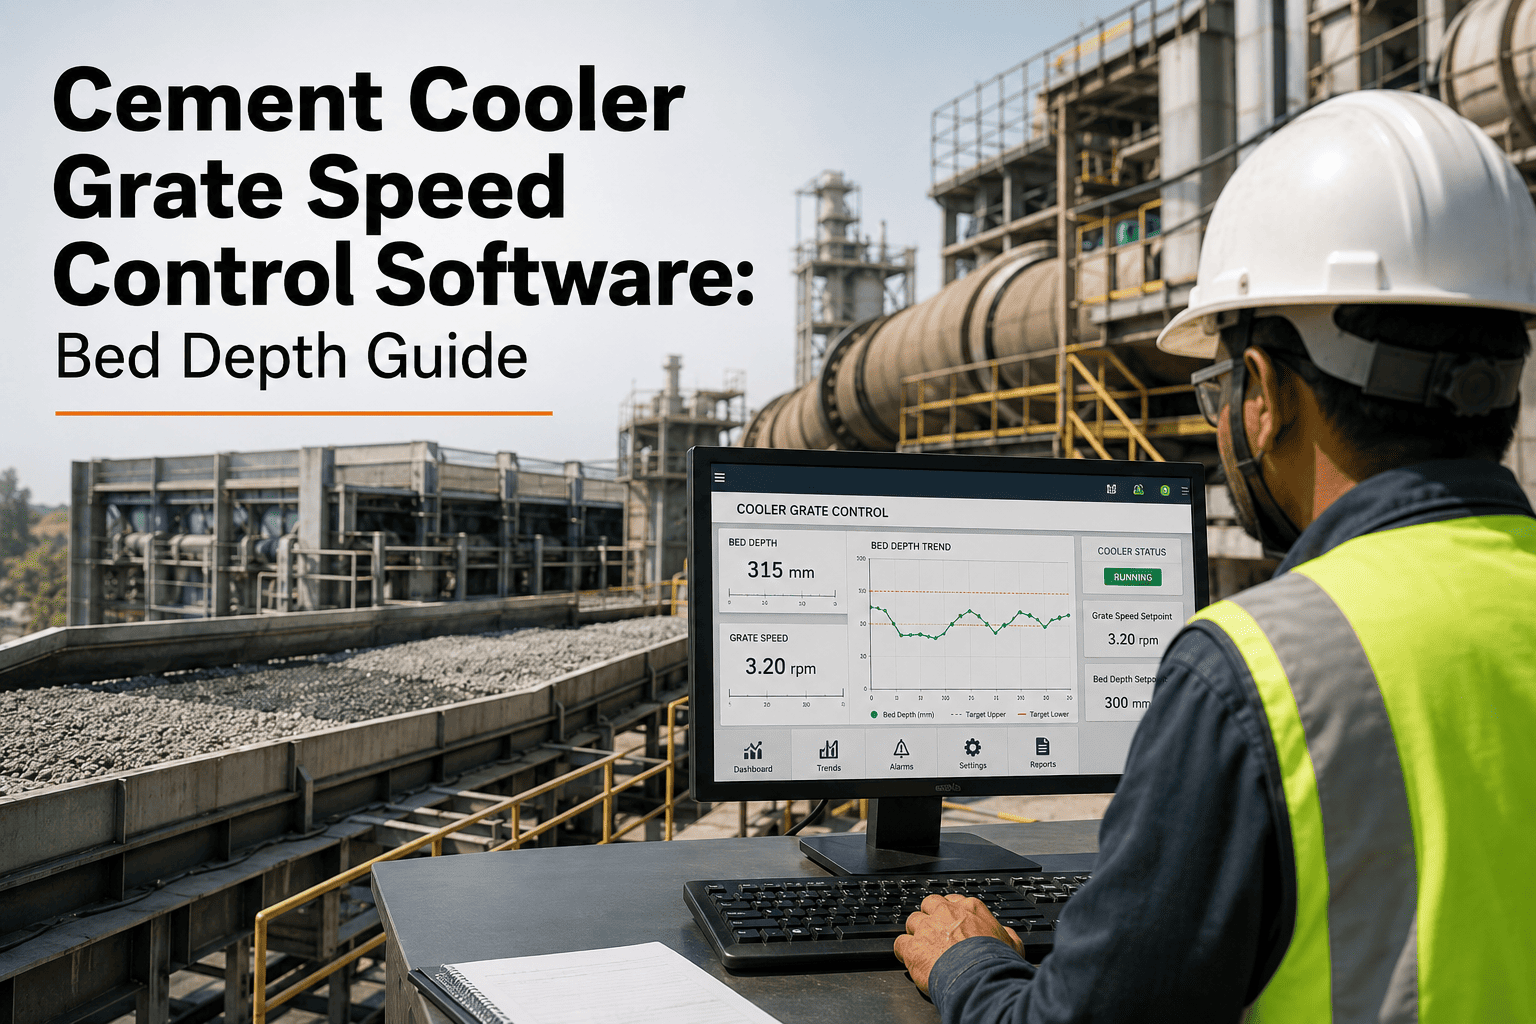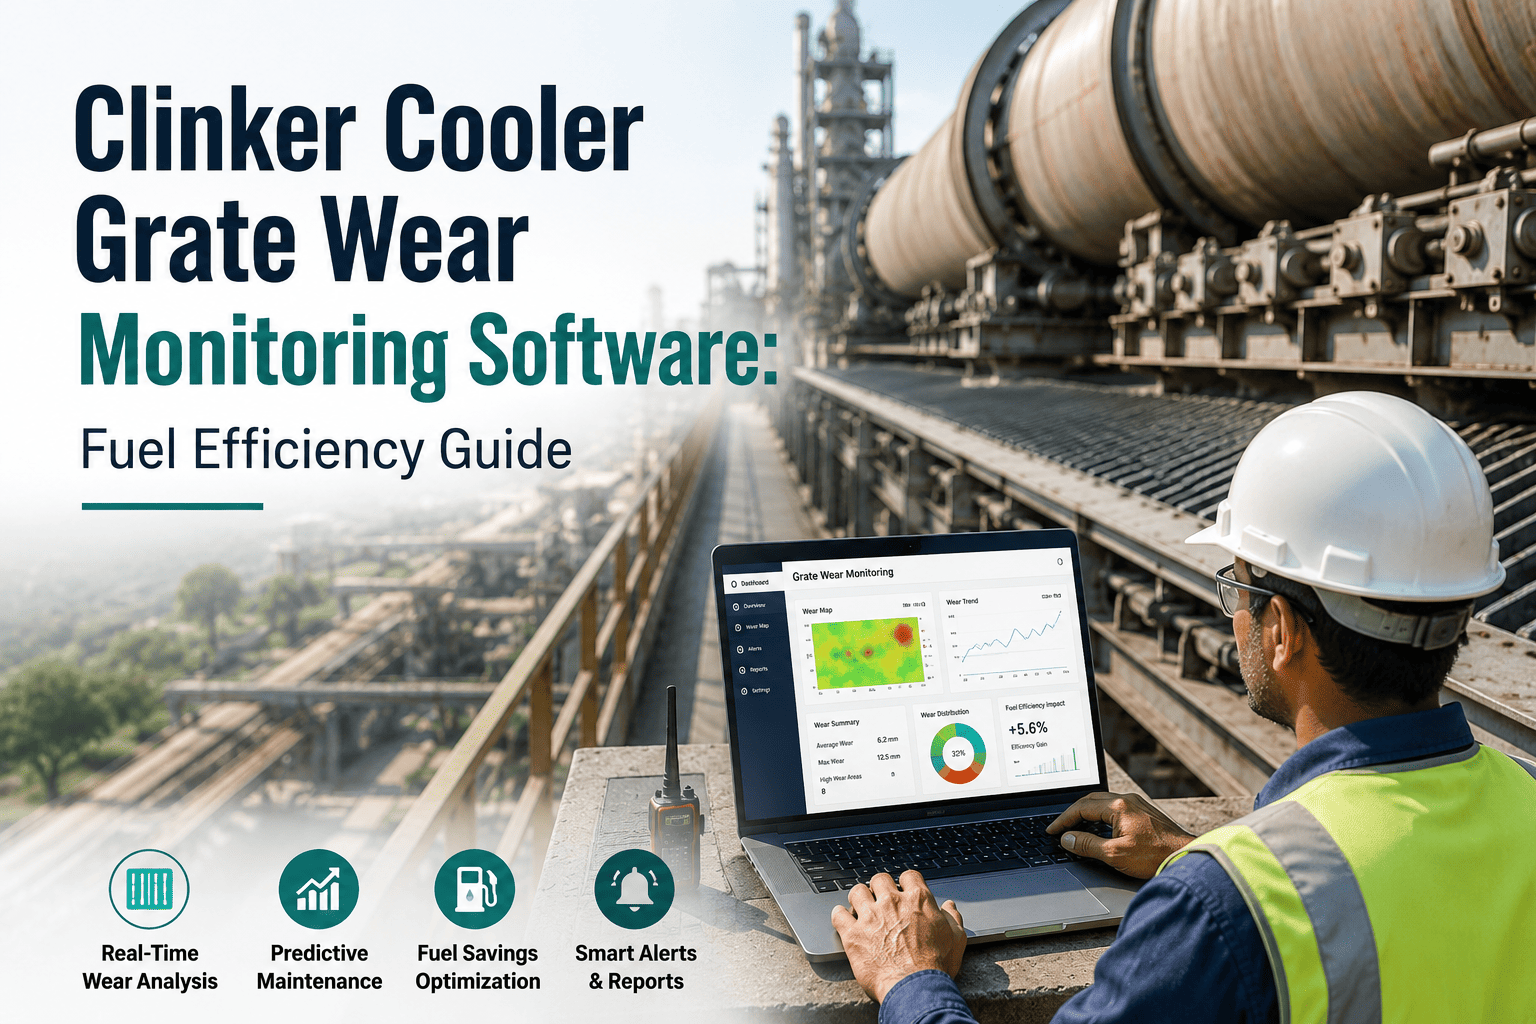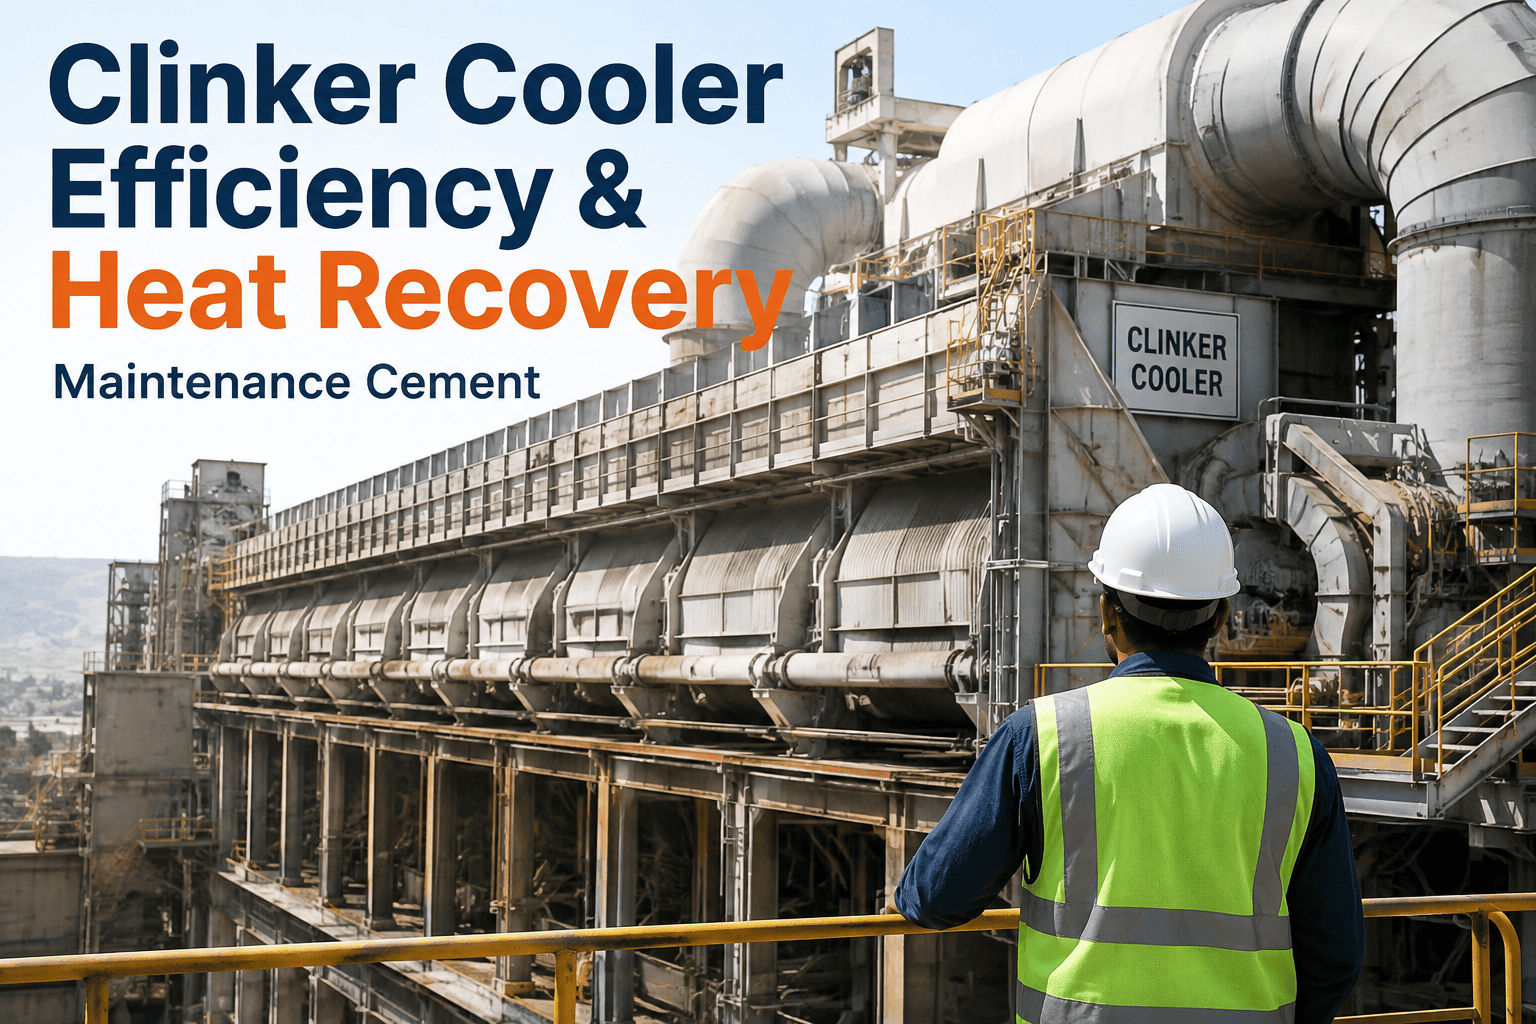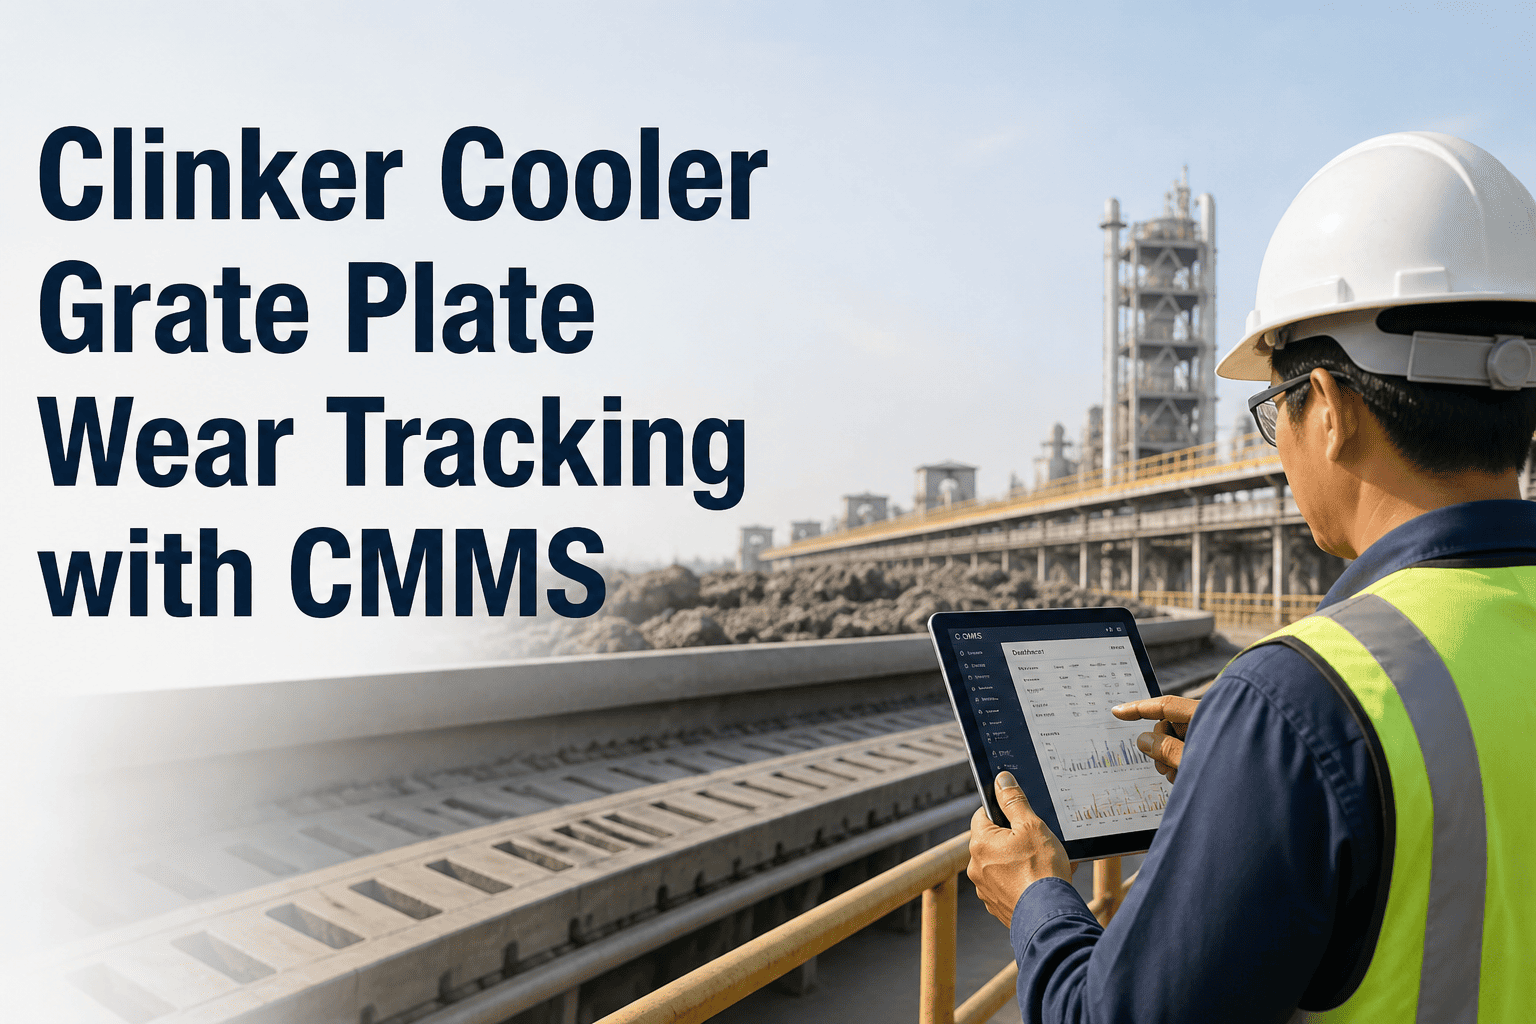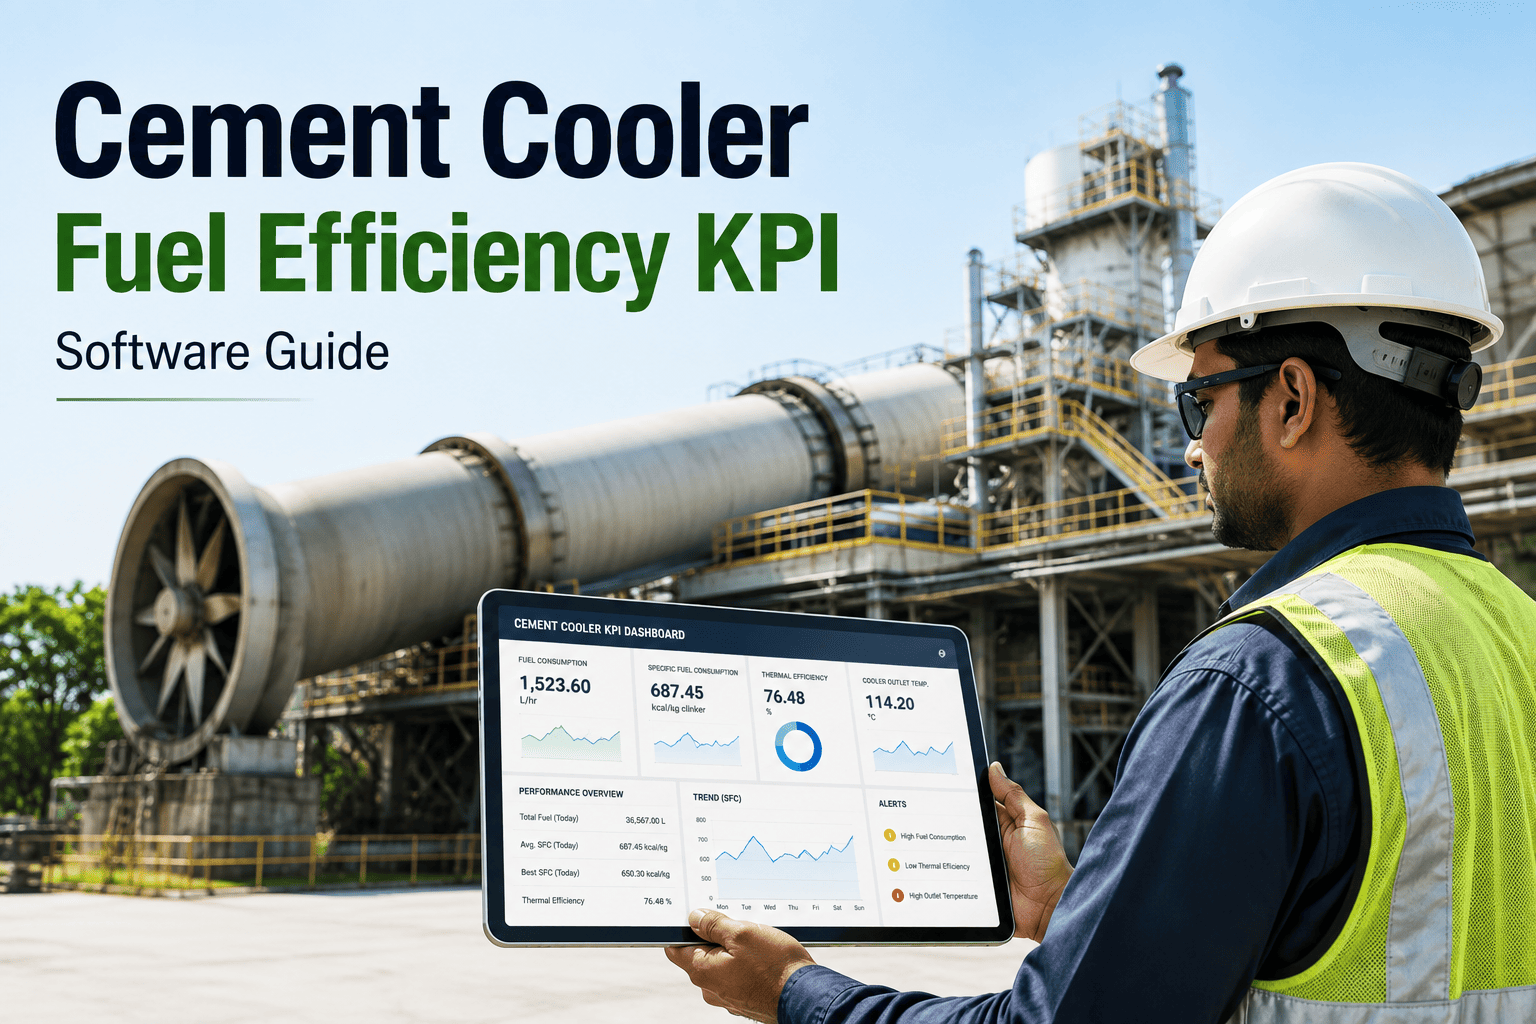
Every cement plant tracks kiln performance obsessively, but the cooler sitting right behind it quietly decides how much of that fuel budget actually survives the process. A grate cooler that is losing secondary and tertiary air recovery pushes kcal/kg clinker higher month after month, and most maintenance teams only notice once the fuel invoice lands on a director's desk. Cooler fuel efficiency KPI software turns grate speed, under-grate pressure, clinker bed depth, and air recovery temperature into numbers a plant manager can defend in a monthly fuel review instead of explaining after the fact. This guide breaks down the five KPIs that actually predict fuel consumption, the benchmark ranges reliability teams use to judge cooler health, and the mistakes that quietly inflate kcal/kg clinker across a kiln campaign, including where you can book a demo to see it running on live cooler data.
Cement Cooler Fuel Efficiency KPI Software — Turn Grate Cooler Data Into Fuel Savings
Kcal/kg clinker, secondary air recovery temperature, and grate plate wear rate are the three numbers every kiln manager gets asked about in a fuel review. Most plants track them once a month in a spreadsheet, days after the fuel was already spent. A cooler KPI platform tracks them continuously, ties them to work orders, and flags drift before it shows up on the fuel bill.
The Five KPIs That Actually Predict Cooler Fuel Loss
Cooler performance is not one number — it is five numbers that move together. Track only kcal/kg clinker and you will see the fuel loss weeks after it started. Track the four leading indicators alongside it and the same drift shows up as a threshold breach, days before it becomes a line item.
Specific Heat Consumption
Kcal/kg clinker is the lagging KPI everyone reports upward. It reflects kiln and cooler performance combined, so a rising trend needs the other four KPIs to identify whether the cause sits in the burning zone or in the cooler itself.
Secondary Air Recovery Temperature
The temperature of air recovered into the kiln hood directly offsets fuel that would otherwise be burned to heat combustion air. A falling trend here almost always shows up as rising kcal/kg clinker within one to two weeks.
Tertiary Air Recovery Temperature
Air routed to the calciner carries a similar fuel-offset value to secondary air. Grate plate leakage, uneven clinker bed depth, or a damaged static grate section can quietly erode this KPI before anyone notices a production impact.
Grate Plate Wear Rate & Cooler Grate Life
Worn grate plates allow air to bypass the clinker bed instead of passing through it, which is one of the most common root causes of falling air recovery. Tracking wear rate per campaign turns a reactive replacement into a scheduled one.
Clinker Discharge Temperature
Clinker leaving the cooler above target temperature represents heat that was never recovered as combustion air. It also raises downstream conveyor and cement mill wear, so this KPI protects more than just the fuel line.
Cooler KPI Benchmark Ranges Reliability Teams Actually Use
A KPI without a benchmark is just a number on a screen. The table below is the reference range a cooler KPI platform should let you configure as an alert threshold, so a value drifting out of range creates a work order instead of waiting for the monthly report.
| KPI | Typical Benchmark Range | Primary Data Source | Review Cadence |
|---|---|---|---|
| Specific heat consumption | 720–780 kcal/kg clinker | Fuel meter + production log | Daily / shift |
| Secondary air recovery temperature | 950–1,050°C | Kiln hood thermocouple | Continuous / hourly |
| Tertiary air recovery temperature | 850–950°C | Tertiary duct sensor | Continuous / hourly |
| Grate plate wear rate | Under 2mm loss per 1,000 operating hours | Inspection round + campaign log | Weekly inspection |
| Clinker discharge temperature | Ambient + 65°C or lower | Discharge conveyor sensor | Continuous / hourly |
Walk Through a Live Cooler KPI Dashboard Before You Build One Yourself
Reading benchmark ranges is one thing — watching a threshold breach turn into a work order in real time is another. A 30-minute walkthrough shows exactly how OxMaint pulls secondary air, tertiary air, and grate wear data into one dashboard your kiln team can trust.
Reactive Cooler Tracking vs KPI-Driven Cooler Management
Most plants do not lack cooler data — they lack a way to act on it before the month closes. The comparison below is the difference reliability leaders describe after moving from a spreadsheet log to a connected KPI dashboard.
Six Mistakes That Quietly Inflate Kcal/kg Clinker
A cooler KPI program rarely fails because the data was unavailable. It fails because of how the data was collected, reviewed, or ignored. The six patterns below show up across cement plants that struggle to hold their fuel benchmark.
Reporting kiln fuel KPIs without cooler KPIs
Kcal/kg clinker gets reported to leadership while secondary and tertiary air recovery never leave the control room log — the leading indicators that explain the number are missing from the conversation.
No baseline before a grate plate change-out
Without a documented before-and-after air recovery reading, the fuel impact of a grate plate replacement is never quantified, and future replacement timing is guessed instead of scheduled.
Monthly averages hiding daily spikes
A monthly kcal/kg average can look acceptable while individual shifts run well above benchmark. Averaging smooths out the exact events a maintenance team needs to investigate.
Treating fuel spikes and air recovery as unrelated
Fuel spikes and falling secondary air temperature are frequently the same event viewed from two departments. Without a shared dashboard, operations and maintenance investigate separately and reach different conclusions.
No work order trigger on threshold breach
A KPI that drifts out of range on a dashboard but does not generate a work order relies entirely on someone noticing. That gap is where most preventable fuel loss accumulates.
Manual spreadsheet KPI logs with built-in lag
Spreadsheet-based KPI tracking depends on someone transcribing readings on schedule. Even a disciplined process carries days of lag between a real drift and a documented one.
A 90-Day Rollout for Cooler KPI Dashboards
Standing up a cooler KPI program does not require a full shutdown or a long integration project. The rollout below reflects the pace most cement plants use to move from spreadsheet tracking to a live, threshold-driven dashboard.
Baseline & Instrumentation Audit
Confirm which cooler sensors exist, which are reliable, and which gaps need bridging. Establish current kcal/kg clinker, air recovery, and grate wear baselines from the past three campaigns.
Dashboard Configuration & Thresholds
Load benchmark ranges into the platform, configure alert thresholds per KPI, and validate readings against the manual log during a parallel-run period.
Work Order Automation & Review Cadence
Connect threshold breaches to automatic work order creation, set a weekly KPI review cadence with the reliability team, and retire the manual spreadsheet log.
What Kiln and Reliability Managers Say About Cooler KPI Tracking
We were reporting kcal/kg clinker to the plant director every month without ever explaining why it moved. Once we started trending secondary air temperature alongside it, the same spreadsheet conversation turned into a maintenance conversation — we could point at a specific grate section instead of guessing at the kiln.
Grate plate replacement used to happen on a fixed calendar regardless of actual wear. Tracking wear rate per campaign let us push one replacement back by six weeks and pull another forward before it cost us air recovery — both decisions were backed by data instead of habit.
The biggest change was not the dashboard itself, it was the work order trigger. A secondary air temperature drop used to sit unnoticed until the fuel report. Now it generates a work order the same shift, and our average response time dropped from days to hours.
Cement Cooler Fuel Efficiency KPI Software — Common Questions
Most well-maintained grate coolers hold specific heat consumption in the 720–780 kcal/kg clinker range. Plants tracking cooler KPIs continuously tend to sit at the lower end of that band and catch drift before it moves outside it.
OxMaint reads kiln hood and duct thermocouple data continuously and trends it against your configured benchmark range, flagging drift as an alert before it shows up in the monthly fuel report. Book a demo to see it against your own cooler data.
Yes. Each KPI can be configured with a threshold that generates a work order tied to the relevant cooler asset the moment it breaches, so the maintenance team is notified the same shift instead of at month-end.
Wear readings from weekly inspection rounds are logged against the plate's operating hours, building a per-campaign wear curve that flags plates approaching replacement threshold ahead of a forced outage.
Most plants complete instrumentation audit, dashboard configuration, and work order automation within a 90-day rollout. Start a free trial to begin the baseline step on your own cooler data.
Stop Explaining Kcal/kg Clinker After the Fact — Start Tracking It Before It Moves
Secondary air recovery, grate plate wear, and clinker discharge temperature are the leading indicators that explain every kcal/kg clinker number you report upward. OxMaint turns those readings into a live dashboard with threshold alerts and automatic work orders, so the next fuel review starts with an answer instead of a question.