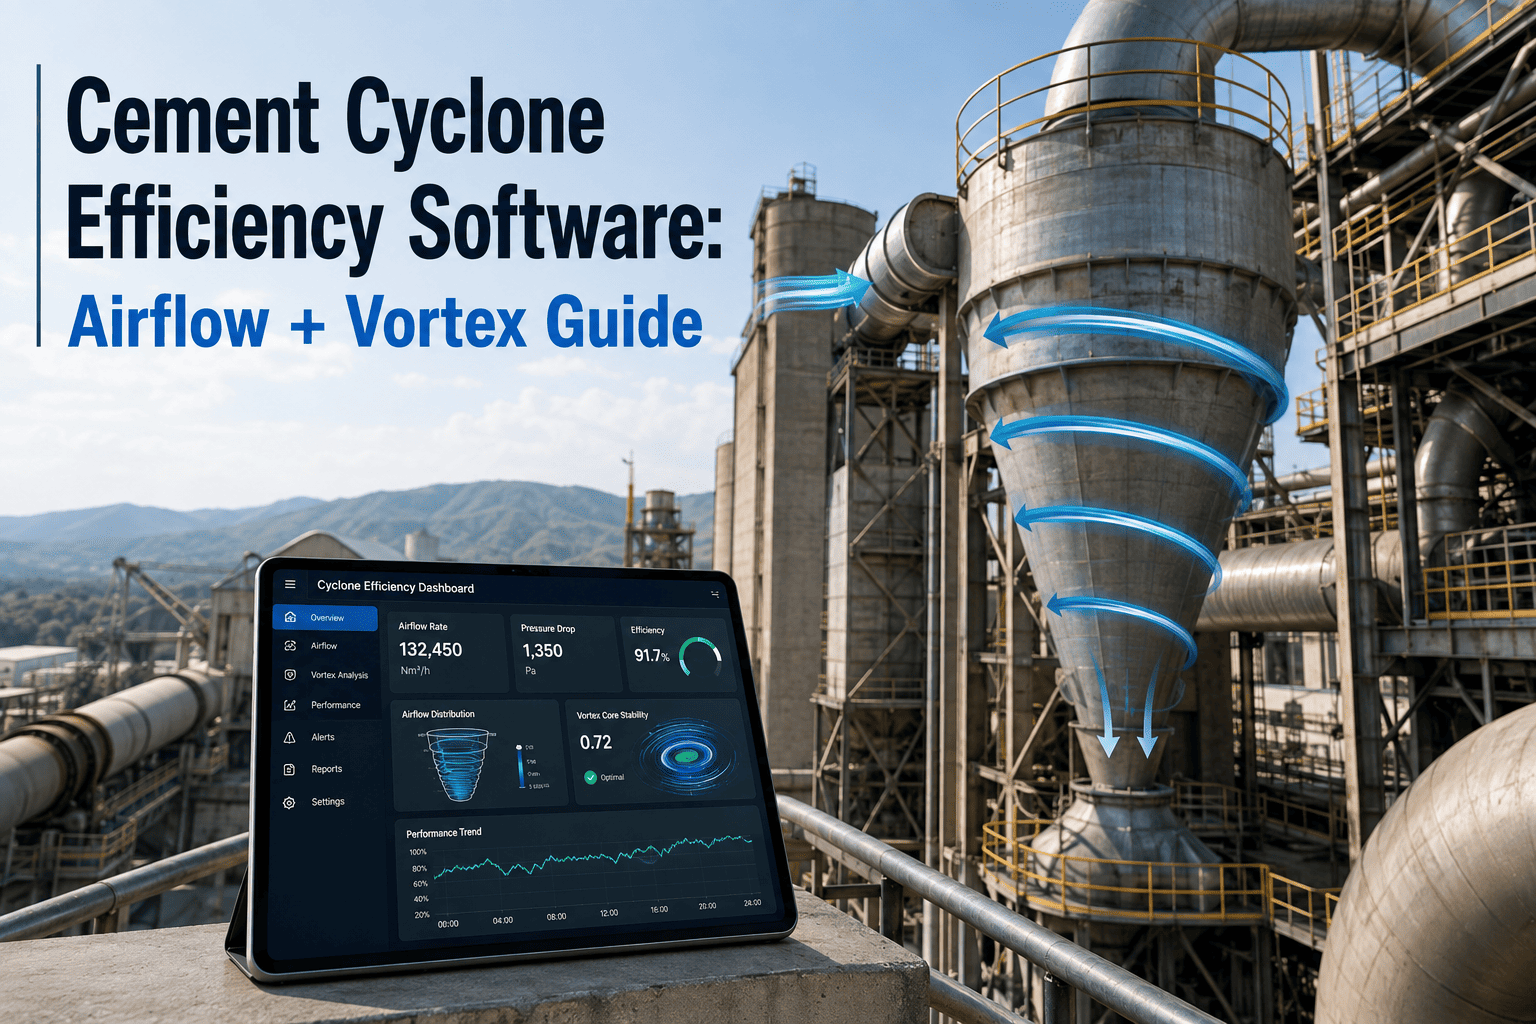
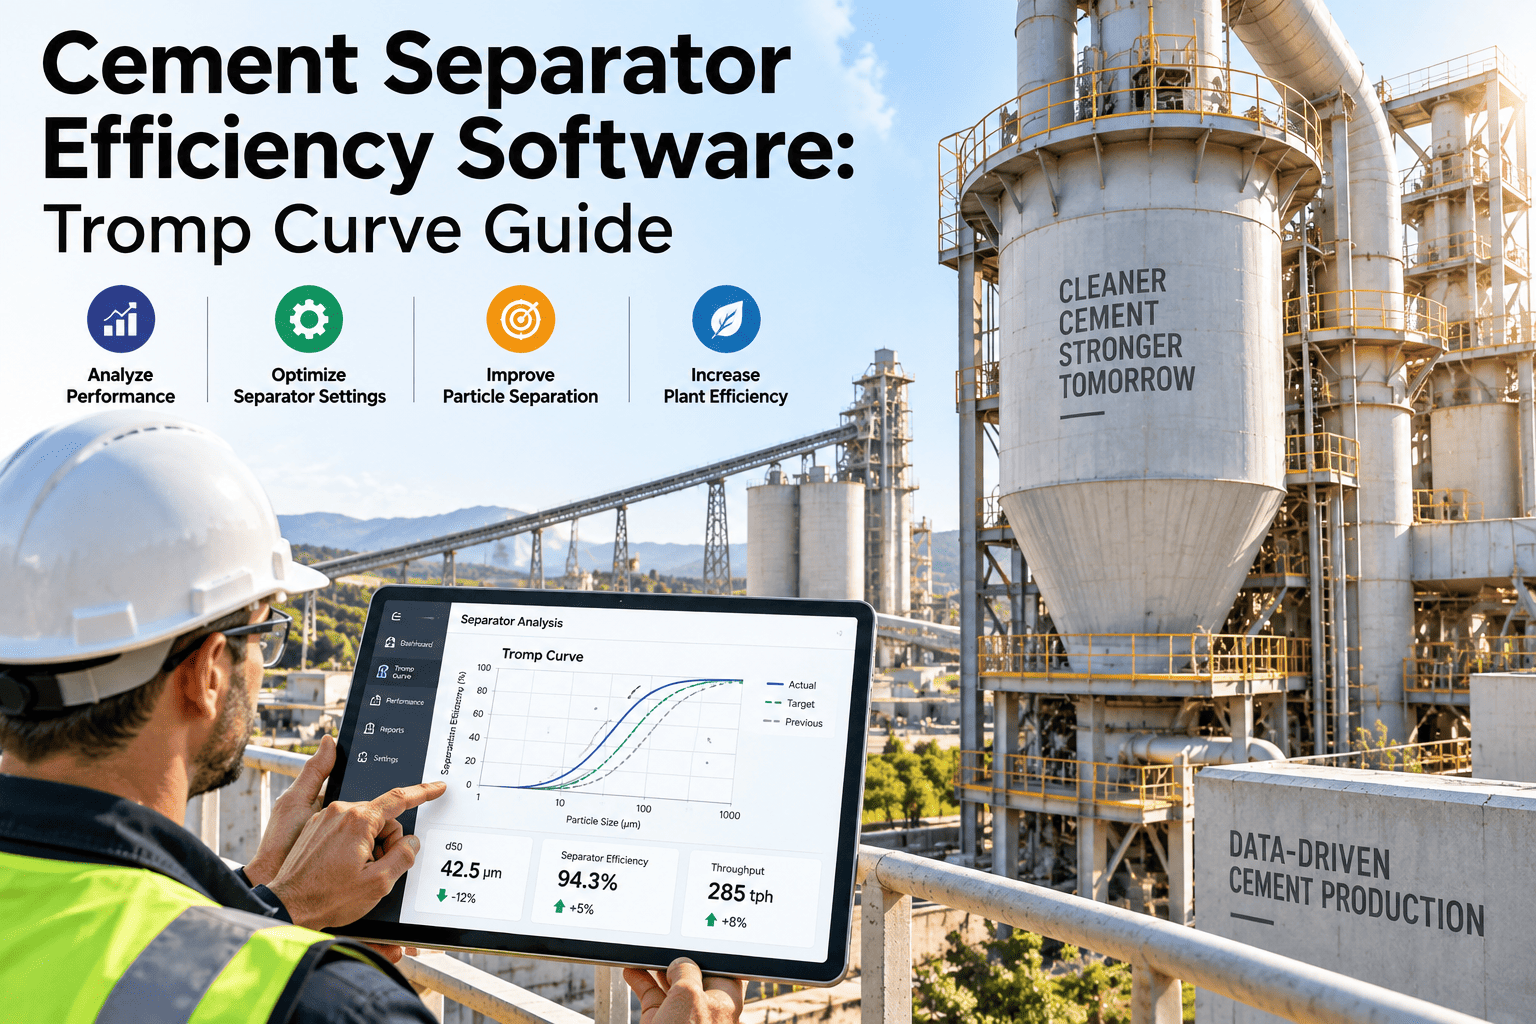
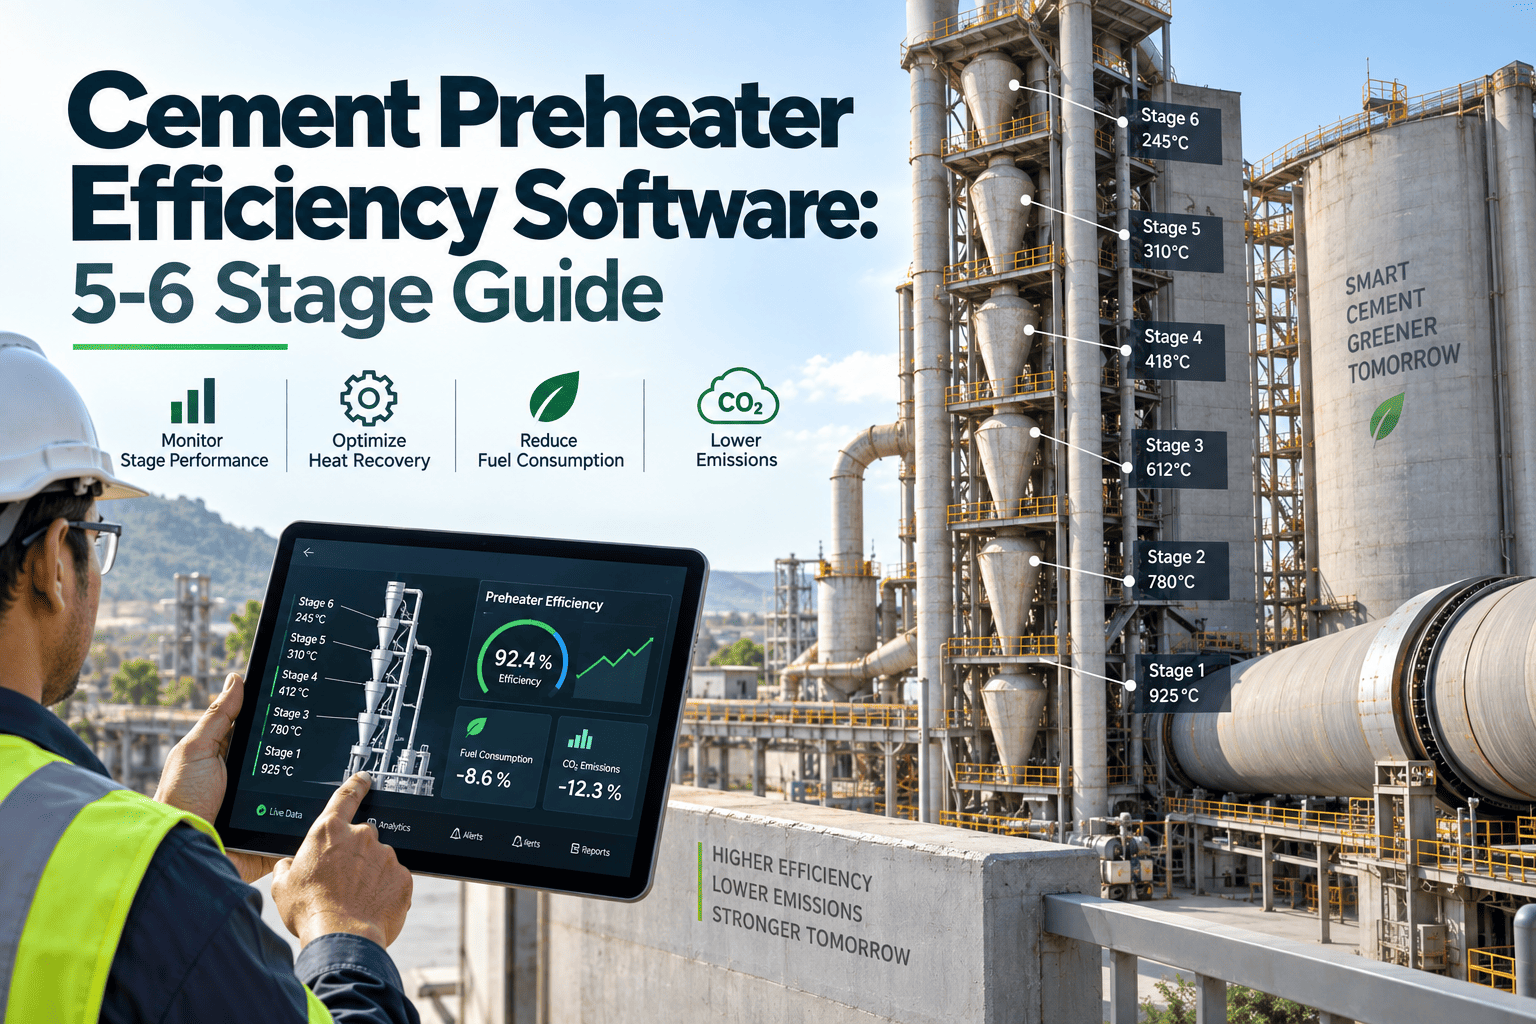
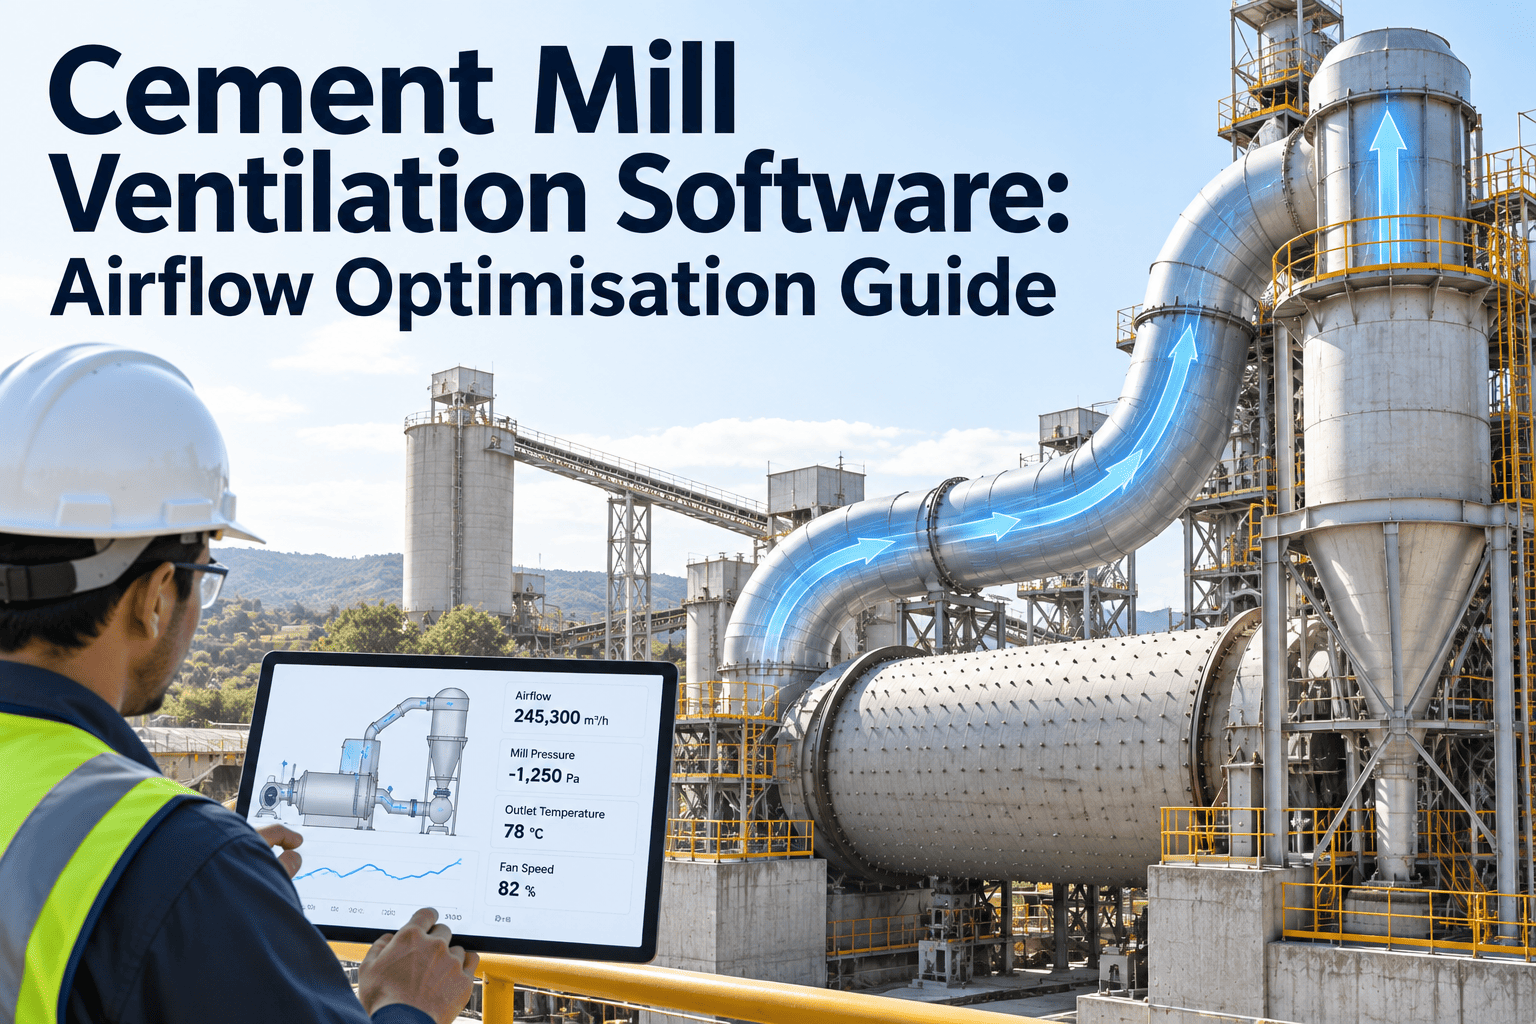
A cement kiln's fuel bill is decided long before the flame — it is decided in the preheater tower, stage by stage, inside a string of cyclones most people never think about. When a cyclone loses separation efficiency, hot meal that should be captured and sent down to the kiln escapes with the exhaust gas instead, and the plant burns more fuel to make up for heat it just threw away. Vortex finder wear, refractory buildup, and false air ingress all erode that efficiency slowly enough that nobody notices until the fuel and power numbers stop making sense. Tracking cyclone airflow, pressure drop, and dust drop rate continuously turns that invisible loss into a number a reliability team can actually manage. See how Oxmaint tracks preheater cyclone performance in one dashboard with a free trial.
Airflow & Vortex Guide · Preheater Cyclones · 2026
Cement Cyclone Efficiency Software: Airflow and Vortex Guide
Every degree of heat a cyclone fails to capture is fuel your plant already paid for and never used. Here is how airflow, pressure drop, and vortex finder condition data turn preheater efficiency from a mystery into a managed number.
5 stages
Typical preheater cyclone string in a modern kiln line
ΔP
Pressure drop is the earliest signal of a plugging cyclone
1 per stage
Vortex finder condition drives collection efficiency at each stage
The Hidden Cost
Why Cyclone Efficiency Quietly Drains Fuel and Power
Preheater cyclones exist to do one job: separate hot raw meal from the rising exhaust gas stream so the meal falls down toward the kiln while the gas continues up and out. When separation efficiency in any single stage drops, meal carries over into the gas stream, gets recirculated, or simply exits with the exhaust — and the kiln has to burn additional fuel to reheat material that should never have needed reheating in the first place.
The frustrating part is that a cyclone losing efficiency rarely announces itself. Production continues, clinker still comes out the other end, and the only clues are a slow drift in specific fuel consumption, a rising ID fan power draw compensating for changed pressure drop, or a dust loading increase at the raw mill that traces back to more bypass material than usual. By the time someone notices in the monthly energy report, the underlying cause — a worn vortex finder, a partially blocked dip tube, or a refractory buildup narrowing the gas path — has often been active for months.
Without Continuous Monitoring
Efficiency loss discovered in a monthly energy report, weeks or months after it began, with no clear record of which stage or which day it started.
With Continuous Monitoring
Pressure drop and dust drop rate trends flag the exact stage drifting out of range within days, with a work order already routed to inspect it.
Early Warning Signs
Five Signs a Cyclone Stage Is Losing Efficiency
1
Falling Pressure Drop Across a Stage
A gradual drop in differential pressure across a cyclone stage often means gas is finding an easier path than the intended vortex, usually through a worn or cracked dip tube.
2
Rising Dust Drop Rate at the Wrong Stage
Material that should separate at an upper stage showing up in lower stage drop rates instead points to carryover, the clearest sign of reduced collection efficiency.
3
ID Fan Power Drift at Constant Load
An ID fan drawing more power to move the same gas volume at the same kiln feed rate usually means the gas path has narrowed somewhere in the tower.
4
Increased False Air Readings
Cracked expansion joints or worn seals let cold ambient air into the tower, diluting gas temperature and forcing the kiln to compensate with extra fuel.
5
Specific Fuel Consumption Creeping Upward
When every other process variable looks normal but fuel per tonne of clinker keeps drifting up, a preheater efficiency loss is one of the first places to check.
Stop Guessing Which Stage Is the Problem
Track Pressure Drop and Dust Drop Rate Stage by Stage
Oxmaint connects preheater differential pressure sensors and dust drop data directly into your CMMS, so a drifting cyclone stage generates a work order automatically instead of waiting to show up in next month's fuel report.
What The Platform Tracks
What Cyclone Efficiency Software Actually Monitors
Stage-by-Stage Pressure Drop
Continuous differential pressure readings across every cyclone stage, trended against baseline ranges so a drift gets flagged before it becomes a blockage.
Dust Drop Rate by Stage
Material flow at each stage outlet compared against expected separation performance, surfacing carryover before it shows up as a raw mill dust loading problem.
Vortex Finder Condition Tracking
Inspection history, wear measurements, and replacement scheduling logged against each cyclone stage so refurbishment happens on condition, not on a fixed calendar.
False Air Ingress Points
Expansion joints, inspection doors, and seal locations tracked with inspection history, linking rising false air readings back to the specific point that needs attention.
Quick Reference
Manual Cyclone Checks vs Sensor-Based Monitoring
| Aspect |
Manual Cyclone Checks |
Sensor-Based Monitoring |
| Data frequency |
Periodic inspection rounds |
Continuous readings, every stage |
| Root cause visibility |
Inferred from downstream symptoms |
Isolated to the exact stage drifting |
| Vortex finder wear |
Assessed during shutdowns only |
Tracked continuously between shutdowns |
| Fuel impact detection |
Visible only in monthly reports |
Flagged within days of onset |
| Work order trigger |
Manual, after someone notices |
Automatic from the CMMS threshold |
Frequently Asked Questions
Cement Cyclone Efficiency Monitoring — Common Questions
Which cyclone stage usually loses efficiency first?
Lower stages closest to the kiln riser typically see the highest gas velocity and material loading, making dip tubes and vortex finders there wear faster than upper stages.
Start a free trial to trend wear by stage on your own tower.
Can pressure drop sensors retrofit onto an existing preheater tower?
Yes. Differential pressure transmitters install at existing tap points on most preheater designs without structural changes, and data feeds directly into the CMMS alongside dust drop readings.
Book a demo to review your tower's tap points.
How much fuel can better cyclone efficiency actually save?
Savings vary by baseline condition, but plants correcting a significant carryover problem at even one stage commonly recover measurable specific fuel consumption within a single quarter.
Start a free trial to model the potential on your kiln line.
Does this replace a shutdown inspection of the cyclones?
No, physical shutdown inspections remain necessary for refractory and structural condition, but continuous monitoring tells you which stage needs priority attention when the shutdown happens, instead of inspecting all stages equally.
Book a demo to plan your next shutdown scope.
How does false air ingress get linked back to a specific point?
Oxmaint logs inspection history for every expansion joint, door, and seal against the tower's false air trend, so a rising reading can be cross-referenced with known weak points before a full leak survey is needed.
Start a free trial to see the tracking view.
Put a Number on Every Stage
Manage Preheater Efficiency Like a Number, Not a Guess
Oxmaint brings pressure drop, dust drop rate, vortex finder condition, and false air tracking into one CMMS, so your reliability team catches cyclone efficiency loss in days instead of finding it in next quarter's fuel bill.