A cement mill separator that runs 8% bypass instead of a achievable 6% doesn't announce itself — it just quietly returns a few extra tonnes per hour of good product back to the mill, where it gets reground for no reason. Most plants only catch this the day someone finally pulls a Tromp curve, usually after specific power consumption has already crept up for months. Building separator efficiency tracking into your CMMS turns that reactive discovery into a routine weekly check, with the classifier's own performance sitting alongside every other asset's condition data.
Turn the Tromp curve from an annual audit exercise into a weekly maintenance habit
Track bypass percentage, cut size, and sharpness of separation inside your CMMS, and route classifier drift straight into a work order before it shows up as a grinding energy overrun.
What a Tromp curve actually measures
A Tromp curve plots the probability that a particle of a given size ends up in the separator's fine (finished product) stream versus its coarse (reject) stream. A perfect separator would send every particle finer than the cut size to product and every particle coarser to reject — a vertical line at the cut point.
Illustrative recovery curve for a 3,500 Blaine finish-mill product. A sharper curve — steeper rise, lower bypass at the finest sizes — means less wasted regrinding.
Bypass isn't a lab curiosity — it's a power bill
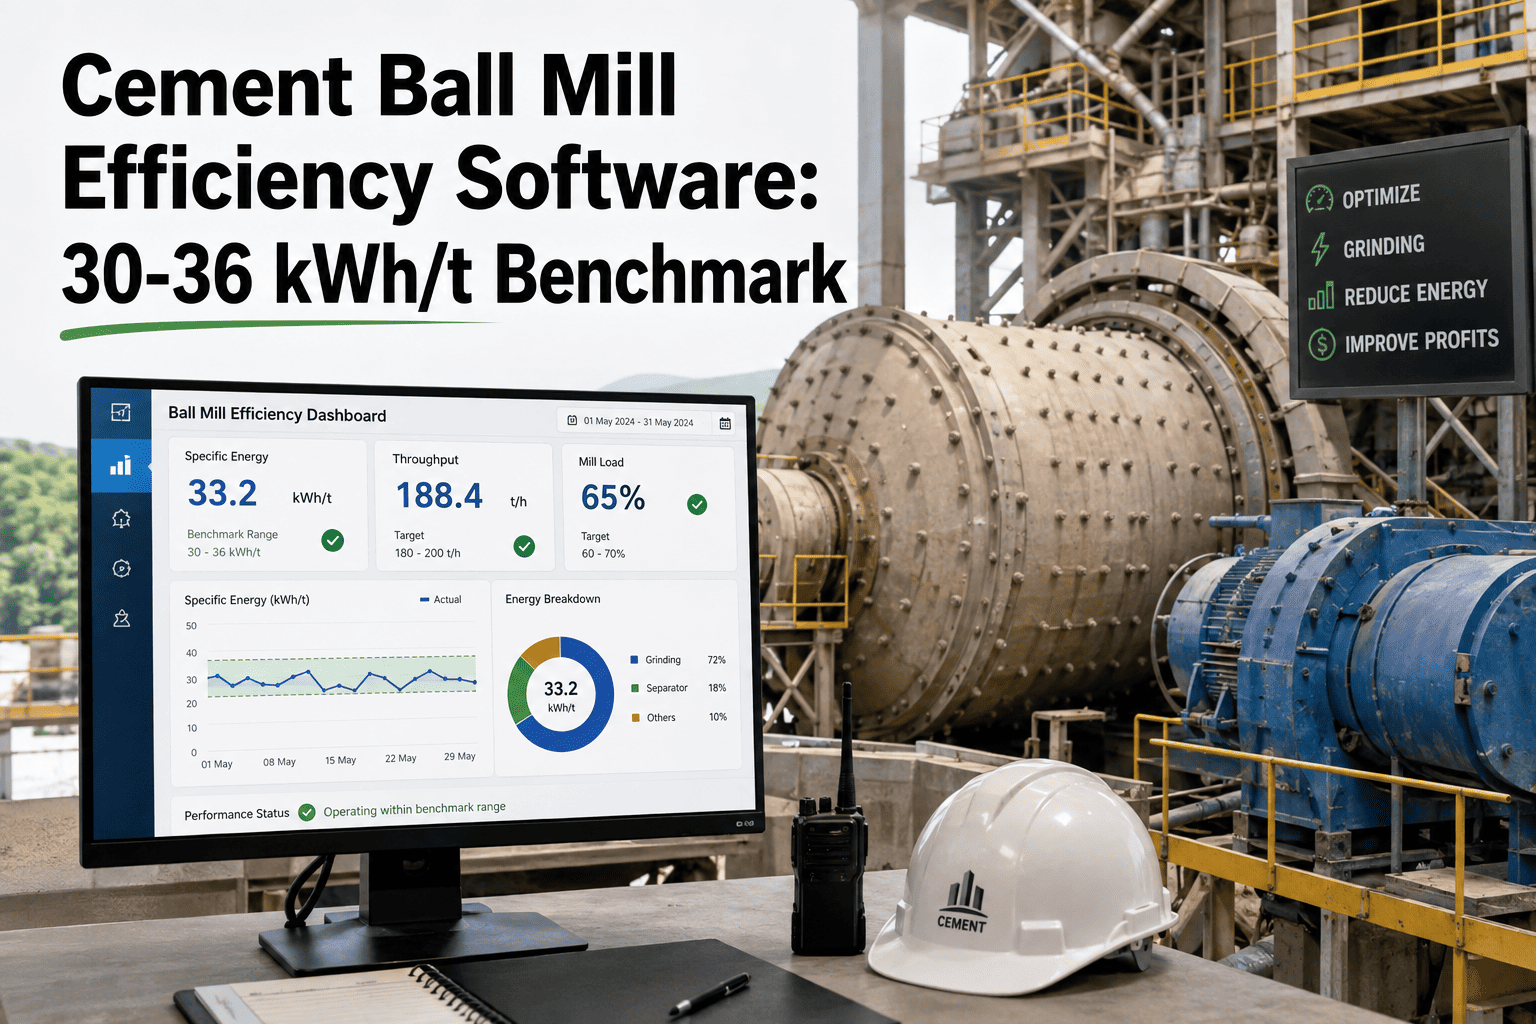
Every tonne of already-finished material that a separator sends back to the mill because of bypass is a tonne that gets ground twice. Grinding is the single largest electrical load in a finish-mill circuit, so bypass translates almost directly into wasted kWh per tonne of cement produced.
The imperfection value — a measure of how gradual or sharp the cut is — tells a related but distinct story. A high imperfection number means the separator can't cleanly tell a 38-micron particle from a 42-micron one, which shows up as inconsistent Blaine fineness in the finished product even when bypass itself looks acceptable.
Where your separator sits — and what efficiency is realistic
Not every separator can hit the same bypass target. The classification technology installed sets the ceiling on what a well-maintained unit can achieve.
| Generation | Design | Typical bypass | Specific power |
|---|---|---|---|
| 1st — static | No moving classification element; gravity and airflow only | 30-40% | Not applicable |
| 2nd — dynamic cage | Rotating cage with fixed or manually adjustable vanes | 15-25% | 28-34 kWh/t |
| 3rd — high efficiency | High-speed cage rotor, adjustable guide vanes, sharp cut | 5-10% | 32-37 kWh/t |
A third-generation separator running at 18% bypass isn't performing to its design class — it is a maintenance problem, not a technology limit, and that distinction is exactly what a Tromp curve trend reveals over time.
Three things to check every time you review a Tromp curve
A single bypass number is useful, but the shape of the curve tells you more about what's actually wrong inside the separator housing.
Cut size (d50)
The particle size at which recovery to fines crosses 50%. Read it from the main slope of the curve, not from any fish-hook distortion at the fine end.
Bypass level
The percentage of fine particles that still end up in the coarse reject stream, read where the curve should approach zero but doesn't.
Sharpness / imperfection
How steep the transition is around the cut point. A shallow slope means overlapping fine and coarse fractions and inconsistent product quality.
Find out what your current bypass is costing in grinding energy
Connect your mill and separator meters and see the classifier's efficiency trend alongside every other asset on the circuit.
Five reasons a Tromp curve flattens over time
Bypass rarely jumps overnight. It drifts, driven by wear and operating changes that each show up differently on the curve. Knowing which signature belongs to which cause is what lets a reliability engineer narrow the problem before scheduling a housing entry, rather than opening the separator to find out.
Rotor cage blade wear
Worn blade profiles blur the classification edge, shifting the d50 cut size coarser and softening the curve's slope.
High circulating load
Overloading the separator with too much material relative to its rated throughput raises bypass across the whole fine end of the curve.
Guide vane misadjustment
Vanes set for a different product fineness than what's currently being ground produce a visible "fish-hook" distortion at the fine end.
Seal ring wear
A worn seal lets fine, already-classified material leak back into the coarse stream regardless of rotor condition.
Distributor plate buildup
Uneven feed distribution across the rotor creates inconsistent classification zones that a single-point sample won't reveal.
Tromp curve tracking isn't the same job on every circuit
A raw mill separator and a finish mill separator classify different material, chase different targets, and drift for different reasons — a single generic bypass target across both circuits misses this.
| Circuit | Material classified | What drift usually signals |
|---|---|---|
| Raw mill | Limestone, clay, and corrective raw meal | Kiln feed chemistry variance — LSF and silica modulus drift, not just power waste |
| Finish mill (cement) | Clinker, gypsum, and supplementary cementitious materials | Blaine fineness inconsistency and grinding energy overrun |
| Slag / pozzolan mill | Ground granulated blast furnace slag or fly ash | Fineness-driven strength development variance in blended cement |
A raw mill separator drifting off target shows up first as kiln feed chemistry variance, which the plant chemist may chase for weeks before anyone connects it back to the separator's Tromp curve. Tracking bypass on the raw circuit alongside the finish circuit closes that blind spot.
Building a weekly Tromp curve check into your CMMS
Full laser particle-size analysis for every mill every week isn't realistic for most plants. A lighter, CMMS-driven routine captures most of the value without the lab overhead.
Log residue sieve data as a standing inspection point
Feed, fines, and reject residues at 32, 45, 63, 90, and 212 microns get logged as a recurring inspection checklist item, not a one-off lab request. Three sample points are the minimum — a curve cannot be reconstructed from product data alone, which is the most common reason plants abandon the effort after one attempt.
Calculate bypass and cut size automatically
The CMMS runs the standard Tromp calculation on each submitted reading, so operators log sieve residues and the bypass trend updates itself.
Flag drift against the separator's baseline
A bypass reading more than roughly 3-4 percentage points above the commissioning or last-overhaul baseline triggers a review task automatically.
Link the flag to rotor, vane, and seal inspection records
The reliability engineer checks the last recorded wear inspection on the rotor cage, guide vanes, and seal ring before dispatching a technician — narrowing the root cause before anyone opens the housing.
Close the loop with a post-repair Tromp check
After any rotor, vane, or seal replacement, a follow-up sieve reading confirms the curve sharpened and resets the baseline for the next campaign. Without this closing step, the plant never learns which repairs actually recovered efficiency and which were replacements made on assumption.
Trend bypass against mill specific power
Plotting the bypass trend alongside kWh per tonne on the same dashboard makes the relationship visible to operations and finance alike, which is usually what unlocks funding for a rotor overhaul before the next planned stop.
A drift caught before it became a mill overhaul
A 1.8 Mt/yr finish mill with a third-generation separator had run a stable bypass of 8% for over a year after its last rotor overhaul. A weekly sieve check began showing bypass creeping toward 12% over five consecutive weeks — still within a range that would likely have gone unremarked at an annual audit.
The detail worth noting is that no single weekly reading would have justified action on its own. Sieve residues carry natural sampling scatter, and any one week's figure could plausibly have been noise. It was the direction of five consecutive readings, held against a known post-overhaul baseline, that made the case — which is precisely the pattern an annual snapshot cannot produce.
Who reviews the curve, and how often
Separator tracking sustains best when it rides alongside existing shift and reliability routines rather than becoming a separate report.
Mill operator — daily residue log
Logs sieve residues as part of the standard shift checklist; no interpretation required at this stage, just consistent data capture.
Process engineer — weekly bypass review
Reviews the calculated Tromp curve and bypass trend, confirms flagged drift, and requests a mechanical inspection when the threshold is crossed.
Reliability team — quarterly rotor inspection
Conducts a scheduled physical inspection of rotor blades, vanes, and seals regardless of curve trend, feeding measured wear data back into the baseline.
Reasonable bypass and power targets by separator type
These are representative operating targets, not guarantees — actual achievable numbers depend on product fineness, feed rate, and mill circuit design.
| Metric | 2nd-gen dynamic | 3rd-gen high-efficiency |
|---|---|---|
| Target bypass | 15-20% | 5-10% |
| Sharpness of separation | Moderate — wider imperfection band | Sharp — tight imperfection band |
| Circulating load | 2.0-3.0 | 1.5-2.5 |
| Review frequency | Weekly sieve check | Weekly sieve check |
| Typical overhaul interval | Rotor and vane inspection annually | Rotor and seal inspection every 6-12 months |
The number that matters most is not the industry benchmark but your own separator's baseline after its last overhaul. A unit that commissioned at 7% bypass and now reads 11% has lost efficiency regardless of whether 11% would be acceptable elsewhere, and that self-referential comparison is what a CMMS trend does well and a one-off audit does poorly.
Frequently asked questions
Do we need a laser particle-size analyzer to track this weekly?
No. A standard sieve residue check at a handful of size fractions is enough to calculate a workable Tromp curve and bypass estimate for routine tracking; save the full laser particle-size analysis for quarterly deep-dive audits or when a flagged drift needs closer diagnosis than the weekly sieve data can provide.
What bypass level actually justifies opening the separator?
There's no universal number, but a sustained rise of 3-4 percentage points above your own commissioning or last-overhaul baseline, held across two or more consecutive weekly checks, is a reasonable trigger for inspection.
Can a high circulating load look like a separator problem when it isn't?
Yes. Feeding a separator beyond its rated throughput raises bypass even on a mechanically sound unit, which is why circulating load should always be checked alongside the curve, not diagnosed from it alone — a mechanically perfect classifier fed beyond its design point will still show a flattened curve.
How does this connect to overall grinding energy tracking?
Separator bypass and mill specific power consumption move together — a rising bypass trend is usually the earliest maintenance-controllable signal of an energy overrun before the kWh/t number itself moves. You can Book a Demo to see both tracked side by side.
How long does it take to set up separator tracking in a CMMS?
Most plants build the sieve-check inspection template and automated bypass calculation within a week, then spend two to three weeks establishing a stable baseline before variance alerts go live. Start Free Trial to configure your first checklist.
Stop waiting for the annual audit to find out your separator is bypassing
Turn a weekly sieve check into an automated bypass trend, tied to the exact work order that fixes it.
Free 14-day trial · No credit card