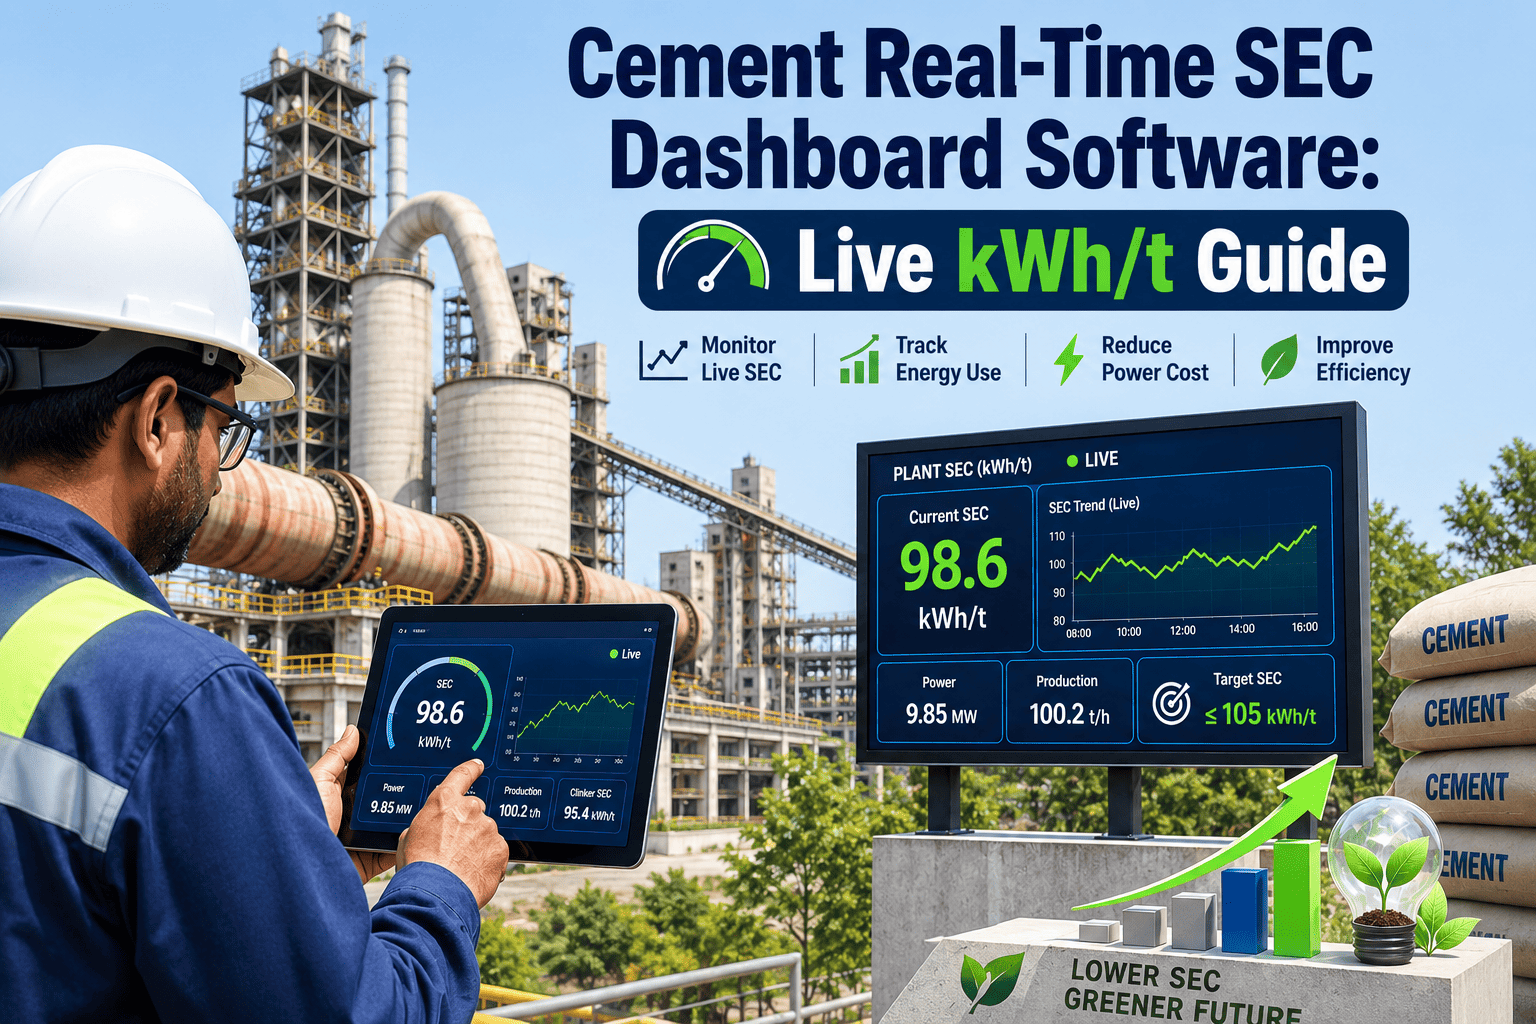
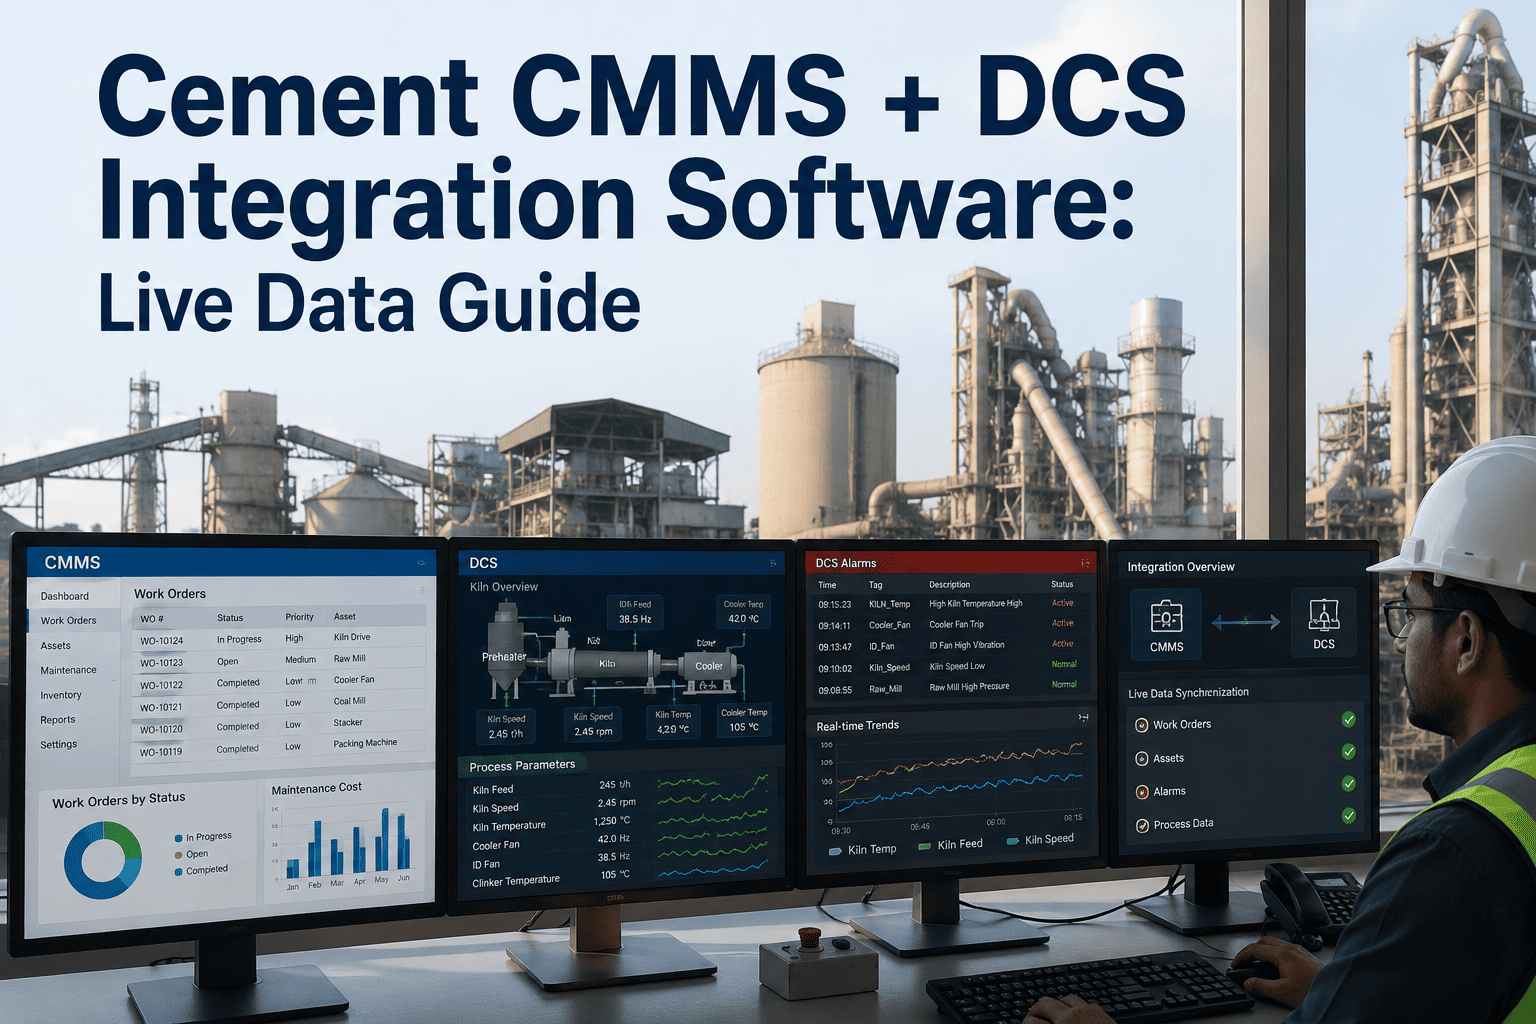
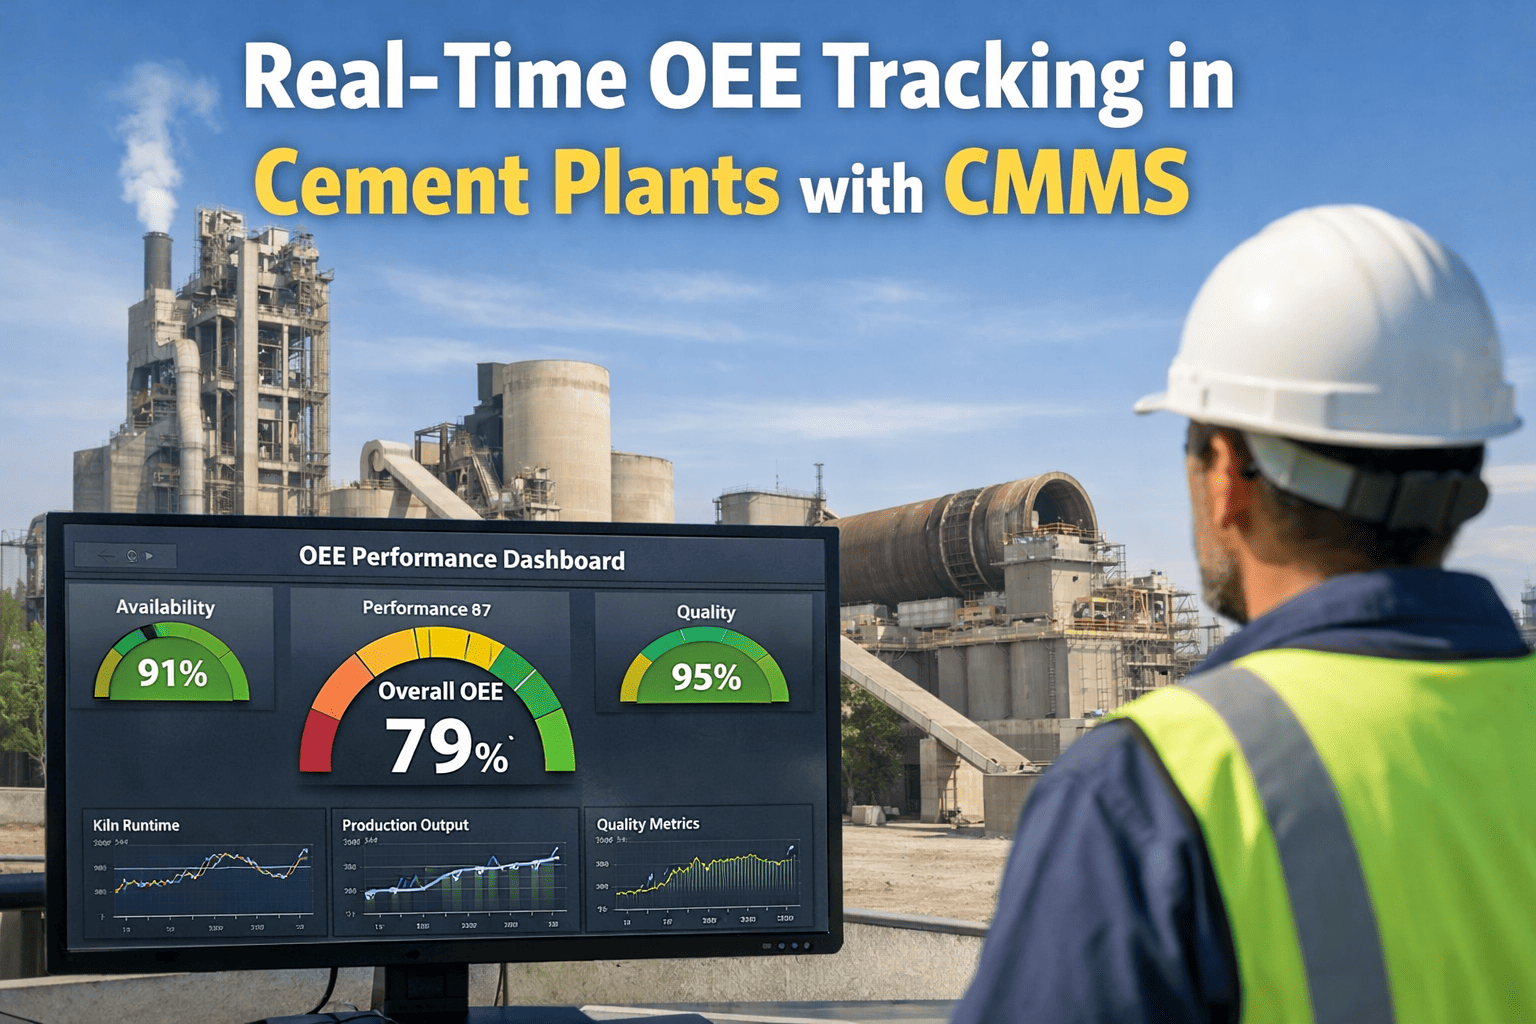
Most cement plants know their specific energy consumption for last month. Very few know it for the last hour. By the time a monthly SEC report lands on a director's desk, the kiln has already run three days above its best-achievable kWh per tonne, and that gap cannot be won back, only avoided next time. A real-time SEC dashboard closes that gap while it is still happening, which is why more control rooms are pairing it with OxMaint CMMS.
Real-Time SEC Dashboard Software For Cement Plants
Live kWh/t by subsystem, benchmarked against best-available-technology, visible in the control room the moment it moves.
Energy loss in a cement plant rarely announces itself. It shows up as a slightly high mill amp draw, a fan running a touch harder than it should, a kiln that needed ten more minutes of burn — small enough to ignore, constant enough to matter.
Live
kWh/t Refresh
Recalculated continuously instead of once a month from SCADA exports
4
Subsystems Tracked
Raw grinding, pyroprocessing, cement grinding, and utilities measured independently
BAT
Benchmark Overlay
Every subsystem measured against its own best-achievable-technology target
24/7
Control Room Visibility
Deviations visible the same shift they happen, not the following week
The Core Problem: Plant-wide SEC averages hide which specific mill or fan is dragging the number up, and a monthly report arrives thirty days after the drift began.
A real-time dashboard breaks total kWh/t into the subsystems actually driving it, each measured against its own benchmark range.
14–18 kWh/t clinker equivalent, tracked against a 14 kWh/t BAT benchmark for raw grinding.
22–28 kWh/t clinker, with fan and fuel trim changes tied to kWh/t movement in real time.
28–36 kWh/t cement, showing separator and mill efficiency shift by shift.
6–9 kWh/t cement, surfacing idle-running conveyors that drain power unnoticed.
Thirty days of drift is thirty days you can't win back. OxMaint streams subsystem-level SEC straight to your control room, with BAT benchmarks built in.
The same live SEC feed serves two very different audiences without either one drowning in the other's detail.
C
Control Room View
Minute-by-minute kWh/t: per subsystem, current versus target, refreshed continuously
Instant threshold alerts: the moment a fan, mill, or kiln drifts past its set limit
M
Management View
Shift, daily & monthly trends: against BAT and historical best for cost reporting
Plant and line rollups: for sustainability and multi-site comparison
Best-available-technology benchmarks give every subsystem a real target instead of a vague "lower is better."
A benchmark only matters if you can see where you stand against it today. Get BAT overlays on your live SEC feed.
The Challenge
The energy manager built SEC reports by hand from SCADA exports once a week, always a few days behind actual kiln performance, with no subsystem-level breakdown.
Solution Implemented
OxMaint's real-time SEC dashboard streamed subsystem data to both the control room and the energy manager's desk, with BAT benchmarks overlaid on every subsystem.
Results (12 Months)
Overall SEC Reduction:
-6.8%
Deviation Correction Time:
Same Shift
Annual Energy Saved:
2.1M kWh
What does "real-time" actually mean for an SEC dashboard?
It means kWh/t is recalculated continuously from live meter and production data rather than compiled after the fact, so a deviation is visible within the same shift it occurs.
Which subsystems does OxMaint track for SEC?
Raw grinding, pyroprocessing, cement grinding, and utilities are tracked independently against their own BAT targets.
Explore the dashboard to see live breakdowns.
Do we need new energy meters for a live SEC dashboard?
Most plants can start with existing SCADA and energy meter feeds, since OxMaint ingests that data directly without requiring a full meter overhaul.
How does a live dashboard help sustainability reporting?
Continuous SEC data rolls up automatically into daily, monthly, and annual energy intensity figures, giving audit-ready numbers without manual compilation.
Can managers compare SEC across multiple lines or sites?
Yes, subsystem SEC rolls up by line and by plant for side-by-side comparison.
Book a demo to see a multi-plant view.
Every energy audit reaches the same conclusion: the loss was visible, just not in time to act on it. Monthly reports don't move as fast as a drifting mill. A live SEC dashboard does — turning kilowatts back into numbers a control room can actually respond to.
Give Your Control Room Live kWh/t Visibility
Stop waiting for month-end to find out where the energy went. See live subsystem SEC against BAT with OxMaint.