Cement plants generate more condition signals than any maintenance team can read by hand: vibration, bearing temperature, motor current, shell temperature, photos and operator notes. The gap is rarely detection. It is what happens after a reading drifts, when someone must decide whether it is noise, a process change or a developing failure. This guide sets out a triage path for kilns, mills, fans, crushers and conveyors. It also shows how Oxmaint connects condition data to work orders, and you can schedule a demo to see it.
Cement Plant Condition Monitoring
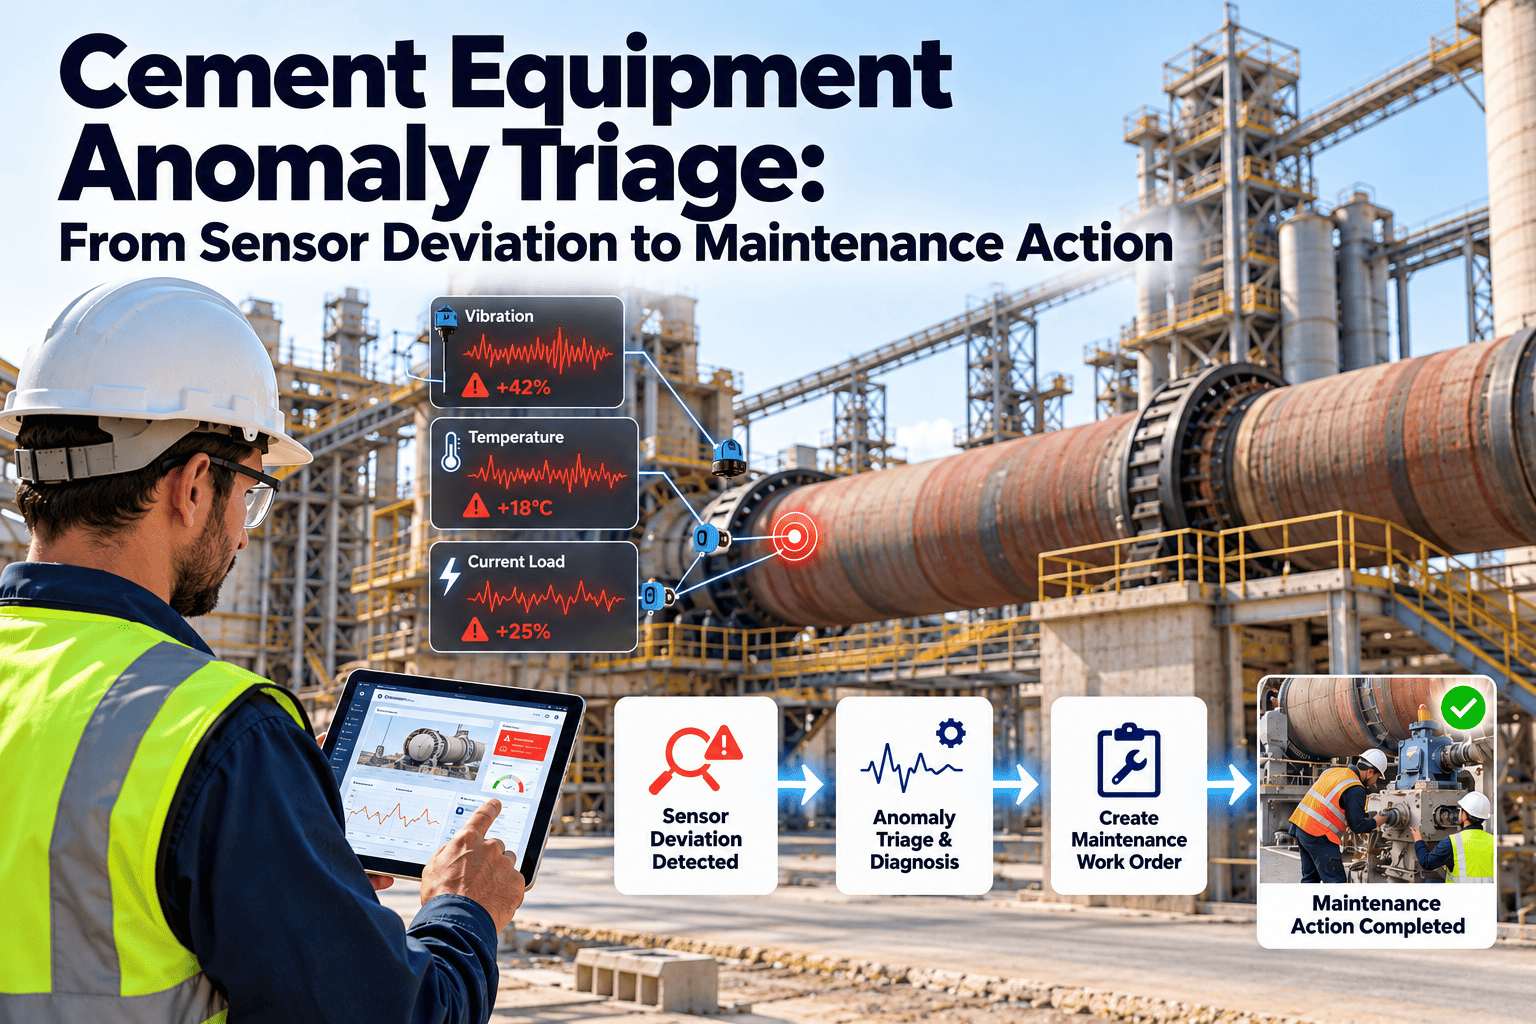
Cement Equipment Anomaly Triage: From Sensor Deviation to Maintenance Action
Score deviations against each asset's own baseline, add context from history and criticality, and turn the ones that matter into work orders with an owner, a priority and a response window.
1. DeviationA reading drifts from the asset's own baseline
2. ContextLoad, history and a second signal are checked
3. SeverityRate of change and criticality set the tier
4. ActionWork order with owner, window and checklist
A Deviation Is Not a Decision
Fixed alarm limits answer one question: has a value crossed a line? Triage answers the harder one: should someone act, how soon, and on what?
Three Tiers: Watch, Warning, Action
One loud alarm trains people to ignore it. Three tiers with different owners and response windows keep attention where it is needed.
Watch
A mild deviation on one signal. No work order yet. The asset is flagged on the dashboard and reviewed at the next planning meeting or round.
Owner: reliability engineer or planner
Warning
A sustained deviation, or two related signals moving together. An inspection work order is raised with a response window set by criticality.
Owner: area maintenance supervisor
Action
A fast-rising trend on a critical asset, or a signal near a hard limit. The work order is high priority, the shift is notified and operations is involved in the decision.
Owner: maintenance manager with the control room
Triage in Six Questions
The same short sequence applies to a kiln support roller or a conveyor drive. It keeps decisions consistent across shifts.
1Is the signal real? Check sensor health, cabling and recent calibration before blaming the machine.
2Is the process explaining it? Feed rate, load, ambient temperature and start-up transients can all move a reading legitimately.
3Does a second signal agree? Vibration with rising temperature, or current with rising vibration, is far more credible than either alone.
4What does history say? A repeat of a previous failure pattern on the same component raises priority immediately.
5What is the consequence? Criticality, available spares, repair lead time and whether a standby exists decide how urgent the fix is.
6How fast is it moving? A slow drift over weeks permits planning. A steep climb over days demands a decision this shift.
Why Signals Stall Between Detection and Action
Most cement plants already own sensors, a control system and a historian. The delay sits in the handoffs between them and the maintenance team.
Signals live in the control roomProcess screens belong to operations. Maintenance sees them only when someone phones, so slow drift is easy to miss across shifts.
No shared view of the assetThe vibration trend, the last repair and the spare part status sit in different places, and nobody assembles them before the decision.
Alarms without ownersAn alert that reaches a screen but not a named person is acknowledged, silenced and forgotten.
Manual translationSomeone must retype a reading into a request, which adds delay and loses detail. Delays of weeks between anomaly and intervention are common when data stays outside the maintenance system.
What to Watch on Each Asset Class
Score Severity With a Likelihood and Consequence Matrix
Crossing the trend with criticality gives a simple, defensible priority. The matrix below shows how the same deviation lands differently on different assets.
High consequence
Inspect soon
Act now
Act now
Medium consequence
Plan the fix
Inspect soon
Act now
Low consequence
Monitor
Plan the fix
Inspect soon
An Illustrative Scenario: A Cooler Fan Drifts
The sequence below is a hypothetical walk-through, not a customer result. It shows how the tiers and questions work together on one fan.
Week 1: WatchDrive-end vibration on a cooler fan sits modestly above its rolling baseline. Load has not changed. The fan is flagged and added to the weekly review.
Week 3: WarningBearing temperature now climbs with vibration. Two related signals agree, so an inspection work order is raised with the asset history attached.
Week 4: VerifyA technician checks grease condition, mounting and fan buildup on a running inspection and records photos and readings on mobile.
Week 5: PlanThe fan is critical to cooling air, so the planner reserves a bearing set, books a short stop window with operations and schedules the repair.
Week 6: CloseThe bearing is replaced in the planned window. The finding, cause code and baseline reset are recorded for the next cycle.
Give Every Deviation an Owner
Connect condition data to work orders in Oxmaint, so a drifting bearing becomes a planned inspection instead of a surprise.
Baseline scoringCondition work ordersAsset history in context
Anatomy of a Good Anomaly Work Order
The work order is where detection becomes action. If it arrives half-empty, the technician starts by investigating the alert instead of the equipment.
Asset and componentExact position in the hierarchy, such as Cooler Fan 2 drive-end bearing
Anomaly descriptionWhat deviated, by how much, and over what period
Readings and trendRecent values against the rolling baseline, with related signals
Suspected failure modeBearing wear, misalignment, lubrication loss, buildup or imbalance
Recommended inspectionThe first checks and measurements, in order
Priority and windowTier, due date and whether a stop or a running inspection is needed
Parts and safetySpares availability, isolation steps and permits required
Closure fieldsFinding confirmed or not, action taken, cause code, baseline reset
The Response Clock
Each plant should set its own targets, but every tier needs a clock. The example below shows the shape of a workable one.
AcknowledgeThe owner accepts the work order and confirms the signal is genuine. Action tier: within the shift.
VerifyA technician or operator confirms on site with a handheld reading, a visual check or a thermal scan.
PlanParts, labour and a stop window are secured. Warning tier: scheduled into the next planning cycle.
ExecuteThe repair is done in a planned window, with the checklist and findings captured on mobile.
Close and learnThe finding, cause and any baseline reset are recorded so the next score is smarter.
Managing False Alerts Without Losing Real Ones
Alert fatigue ends monitoring programmes faster than missed faults do. Every false alert should teach the system something.
Common causes
Sensor drift or loose mounting
Start-up, shutdown and load transients
Seasonal ambient temperature swings
A new baseline after a repair or replacement
Process changes such as fuel or feed mix
Practical handling
Record a no fault found closure with a reason
Reset the baseline after planned component work
Exclude known transient states from scoring
Require a second signal before raising a work order
Review false alerts monthly with the reliability team
From Reactive Alarms to Closed-Loop Triage
Reactive routine
Bearing alarm sounds near the trip limit
Control room phones the shift fitter
Parts are searched for after the fault is confirmed
Repair happens during an unplanned stop
Findings stay in someone's notebook
Closed-loop routine
Drift flagged weeks before limits are near
Work order created with context and owner
Parts checked and reserved during planning
Repair done in a scheduled window
Cause and outcome recorded against the asset
Common Triage Mistakes
Most triage programmes fail through process gaps rather than analytics. These mistakes appear again and again.
What goes wrong
Alerts go to a shared inbox with no named owner
Every deviation becomes a work order, flooding planners
Baselines are never reset after repairs
Closed jobs carry no finding, so nothing is learned
What works
Each tier has an owner, a backup and a response window
Watch items stay on a dashboard until they corroborate
Baseline resets are part of the repair closure checklist
Every closure records a finding and cause code
KPIs That Show Whether Triage Works
Time to acknowledgeAlert raised to owner response
Anomaly to work orderDetection to a planned job
Confirmed-find rateShare of inspections that found a real fault
False alert rateNo fault found closures over total alerts
Repeat failure rateSame component failing again
Planned share of corrective workRepairs scheduled rather than forced
The Maintenance Workflow Behind the Triage
Triage only pays off when the next steps are already built. These Oxmaint capabilities carry a flagged deviation through to a closed job.
Asset records and historyEvery reading, repair and part sits on the asset, so context arrives with the alert.
Condition-based work ordersThreshold and anomaly triggers raise inspection jobs with owner and priority.
Mobile inspectionsTechnicians verify and record findings, photos and readings at the equipment.
Scheduling and inventoryJobs fit planned windows and spares are checked against stock and reorder points.
Dashboards and reportsOpen alerts, response times and repeat failures stay visible to supervisors and managers.
Combine Vibration, Thermal and Oil Evidence
No single technique sees every failure mode. Triage is strongest when different evidence types support or contradict one another.
Vibration
Reveals bearing defects, imbalance and misalignment on fans, mills and drives, and is usually the earliest mechanical signal.
Thermal
Shows lubrication breakdown, overload and hot spots on bearings, motors and shells, and often drifts well before a hard limit.
Oil and electrical
Gearbox oil condition and motor current patterns add context on wear, contamination and load that surface readings cannot give.
Check the Data Before You Trust the Score
A triage model is only as good as the signals feeding it. These checks prevent confident decisions built on bad inputs.
Each sensor mapped to the correct asset and component, not just a tag
Calibration dates visible so drift in the sensor is separated from drift in the machine
Operating state recorded, so running, idle and start-up readings are not mixed
A baseline period long enough to include normal load and seasonal variation
Failure codes and repair dates on the asset, so history can inform severity
A named owner for every tier, with a backup for leave and shift changes
Governance: Who Can Change the Rules
Triage rules drift if anyone can edit them. A light governance routine keeps thresholds, tiers and baselines defensible during audits and incident reviews.
Roll It Out in Four Steps
Step 1Pick five to ten critical assets and clean their records, criticality and spares links.
Step 2Capture baselines during normal running and define the three tiers with owners.
Step 3Switch on condition-triggered work orders and run the six-question check on every alert.
Step 4Review outcomes monthly, tune rules, and extend to the next asset group.
Frequently Asked Questions
What is anomaly triage in a cement plant?
It is the structured decision path from a sensor deviation to a prioritised maintenance action with an owner.
Why use baselines instead of fixed limits?
Each machine behaves differently, so drift from its own normal shows faults earlier.
Book a demo to see baselines in action.
How do we stop alert fatigue?
Use tiers, require a second signal for work orders, and review false alerts monthly.
Which assets should we start with?
Kiln drives, mills and large fans, where failure is costly.
Start free and add more assets over time.
Do we need new sensors first?
Not always. Begin with existing instrumentation and add sensors where coverage gaps appear.
Turn Sensor Drift Into Planned Work
Start with your kiln drives, mills and fans, and see how triage, work orders and asset history work together in one workflow.
Watch, Warning, Action tiersContext-rich work ordersClosed-loop learning