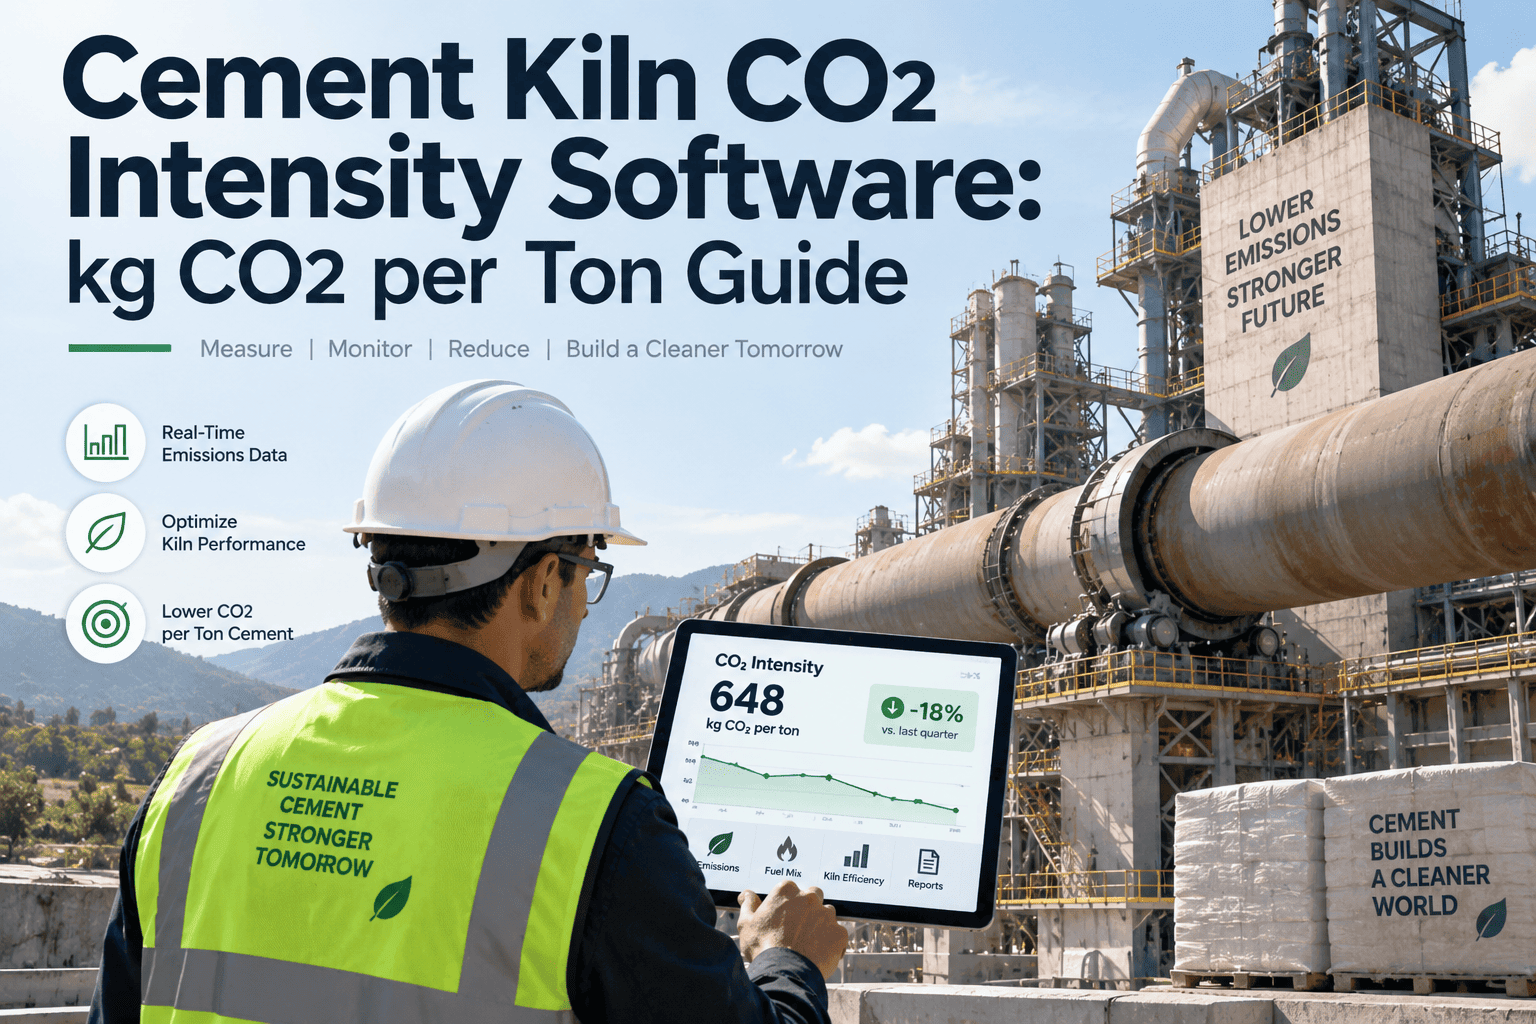
Every tonne of cement carries a number now, whether a plant chooses to track it or not. Calcining limestone releases roughly 0.50 tonnes of CO₂ per tonne of clinker before a single kilogram of fuel is burned, and that reaction is chemically fixed — no kiln efficiency project can touch it. What a plant can control is everything layered on top: fuel mix, thermal efficiency, clinker factor, and electricity source, and those are exactly the levers CDP, TCFD, and the EU's Carbon Border Adjustment Mechanism now expect a plant to report at batch level, not as a once-a-year estimate. Most cement groups still calculate kg CO₂ per tonne in a quarterly spreadsheet reconciliation pulled together from fuel delivery notes, lab results, and meter readings, which is already too slow and too fragile for CBAM's shipment-level reporting requirement. See how OxMaint tracks kg CO₂ per tonne continuously across every kiln, fuel type, and shipment.
OxMaint pulls fuel consumption, calcination data, and electricity draw straight from your process systems and calculates kg CO₂ per tonne of cement automatically, ready for CBAM, CDP, and TCFD reporting.
Where a Tonne of Cement's CO₂ Actually Comes From
Before any reduction program makes sense, a plant needs to see the split — because the three sources behave completely differently and respond to different levers. Calcination is fixed chemistry, fuel combustion responds to thermal substitution and kiln stability, and electricity responds to grinding efficiency and grid mix. Treating all three as one number hides which lever is actually worth pulling, and it is the single most common reason a reduction program spends a year of budget on the wrong intervention.
Clinker Factor Is the Single Biggest Lever You Control
Because calcination emissions are fixed per tonne of clinker, the fastest way to lower kg CO₂ per tonne of finished cement is to put less clinker in every tonne shipped — substituting slag, fly ash, or limestone filler without compromising strength. This is also the lever with the fastest measurable payback, since a substitution change shows up in the very next batch's carbon calculation rather than requiring a multi-year kiln retrofit. The comparison below shows why cement type selection is as much a carbon strategy as a product strategy, and why sales and sustainability teams increasingly need to look at the same grade mix data together.
OxMaint's monitoring, reporting, and verification workflow eliminates the manual spreadsheet reconciliation that CBAM's quarterly reporting cycle no longer tolerates.
Four Levers Cement Plants Are Actually Pulling Right Now
Clinker factor gets most of the attention because the math is easy to explain, but plants that move fastest on kg CO₂ per tonne are usually running several levers at once rather than betting everything on substitution rates alone. A coordinated program that combines fuel substitution, thermal efficiency, grinding optimization, and electricity sourcing typically targets a combined reduction in the range of 20 to 30 percent against baseline over several years, though the achievable figure depends heavily on a plant's starting clinker factor and local access to supplementary cementitious materials.
The MRV Cycle — From Kiln Data to a CBAM-Ready Report
CBAM now expects embedded emissions calculated from actual plant data, not a default industry benchmark, once a facility has completed a full reporting cycle. That means every fuel delivery, every clinker batch, and every electricity draw has to trace back to a verifiable source, and that source has to hold up when a third-party verifier asks to see it. OxMaint structures that trace so a quarterly report becomes an export, not a reconciliation project assembled under deadline pressure by whoever has time that week.
CBAM Benchmark vs Your Plant — Where Do You Sit?
CBAM's default benchmark for cement is 0.83 tCO₂e per tonne, based on the EU production average. Plants reporting below benchmark reduce their compliance certificate cost; plants above it pay more per tonne exported. Because CEM I sits near the top of the benchmark range and CEM III sits well below it, product mix decisions now carry a direct compliance cost consequence, not just a market positioning one. The table below lines up the benchmark against typical performance bands so a plant can see where its own reporting is likely to land, and where a modest clinker factor or thermal substitution improvement would move it relative to the benchmark.
| Metric | Lower-Performing Range | CBAM Benchmark | Top-Performing Range |
|---|---|---|---|
| CO₂ per Tonne Clinker | 0.90+ t | 0.83 t | 0.78 t or lower |
| CO₂ per Tonne Cement | 0.80+ t | 0.72–0.76 t | 0.55 t or lower |
| Clinker Factor | 0.90+ | 0.75–0.80 | 0.65 or lower |
| Thermal Substitution Rate | Under 10% | 20–30% | 40% or higher |
Moving even one row of that table from the lower-performing range into the top-performing range compounds across every tonne shipped for the rest of the reporting year, which is why plants tracking these four figures monthly rather than annually tend to close the gap to benchmark noticeably faster than those reviewing it once at year-end.
Why Spreadsheet Tracking Breaks Under CBAM's Reporting Cadence
A quarterly spreadsheet reconciliation was workable when carbon reporting meant filing one annual disclosure built from plant-wide averages. CBAM changed the math by requiring embedded emissions per shipment, calculated from actual plant data rather than a default benchmark, once a facility has reported for a full cycle. That level of granularity means every fuel delivery note, every clinker batch's CaCO₃ content, and every electricity meter reading needs to be individually traceable, not folded into a single quarterly total. Manual reconciliation at that resolution is not just slow — it is where verification queries and compliance risk actually originate, because a spreadsheet built from five different source files rarely survives an auditor asking where one specific number came from. Plants that automate this correlation stop treating each reporting cycle as a fire drill and start treating it as a byproduct of data they were already collecting for kiln operations.
What Getting This Right Is Worth
Carbon intensity tracking is a compliance requirement first, but it is also one of the clearest cost-avoidance levers a cement plant has left, because certificate prices and clinker factor discipline move directly to the bottom line. The three areas below are where plants running an automated MRV workflow typically see the return show up fastest, usually within the first one or two reporting cycles.
Frequently Asked Questions
Does OxMaint calculate CBAM embedded emissions automatically?
Can this replace our existing CDP or TCFD disclosure process?
Do we need new metering hardware to track kg CO₂ per tonne this way?
How does clinker factor tracking actually reduce cost, not just emissions?
Is per-shipment reporting really necessary, or is a plant-wide average enough?
None of this requires a separate sustainability system running alongside your maintenance and production tools. The same process data a plant already collects for kiln performance and fuel management is what carbon intensity reporting needs — the difference is whether that data gets correlated automatically or reconstructed manually every quarter under a compliance deadline. Plants that make the shift usually describe the same before-and-after: a reporting cycle that used to consume two weeks of an analyst's time now takes an afternoon, and the clinker factor conversation that used to happen once a year in a sustainability review now happens continuously between production planning and the sales team quoting the next contract.
Carbon intensity is not a side metric anymore for a cement business selling into the EU or reporting to CDP and TCFD-aligned investors. It is a number that shows up in procurement scorecards, contract renewals, and compliance certificate invoices with the same regularity as a tonnage report. Building the tracking infrastructure once, correctly, against real plant data is considerably cheaper than rebuilding it under pressure every time a reporting requirement tightens.
Connect your fuel, clinker, and electricity data once and let CBAM, CDP, and TCFD reporting pull from the same live source.