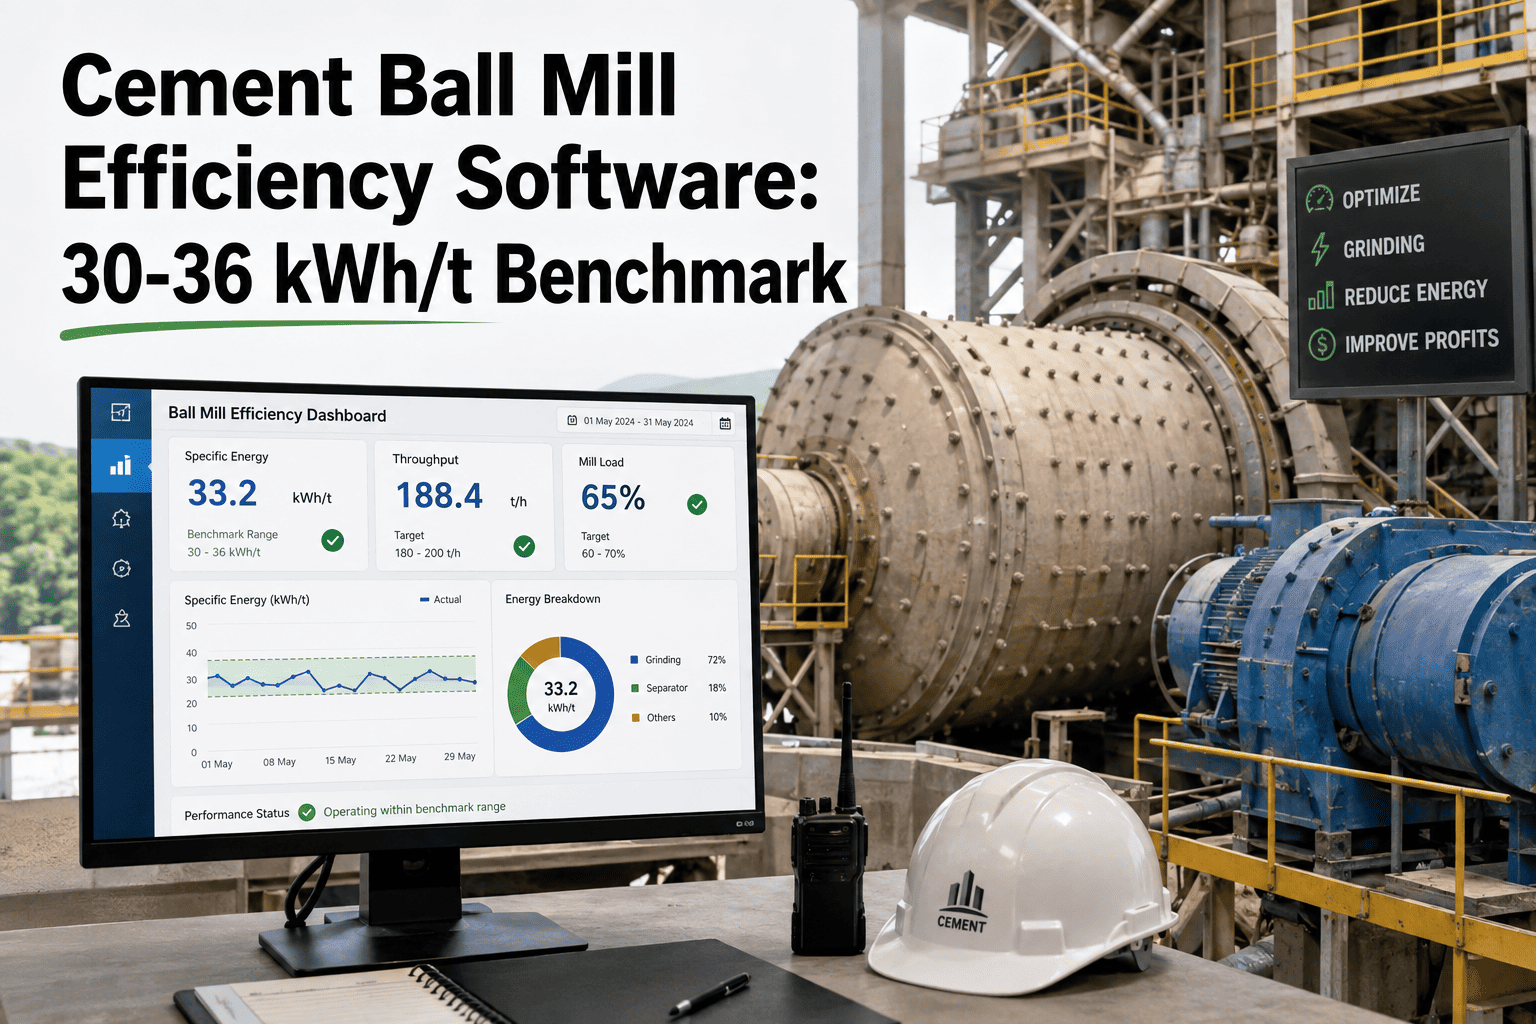
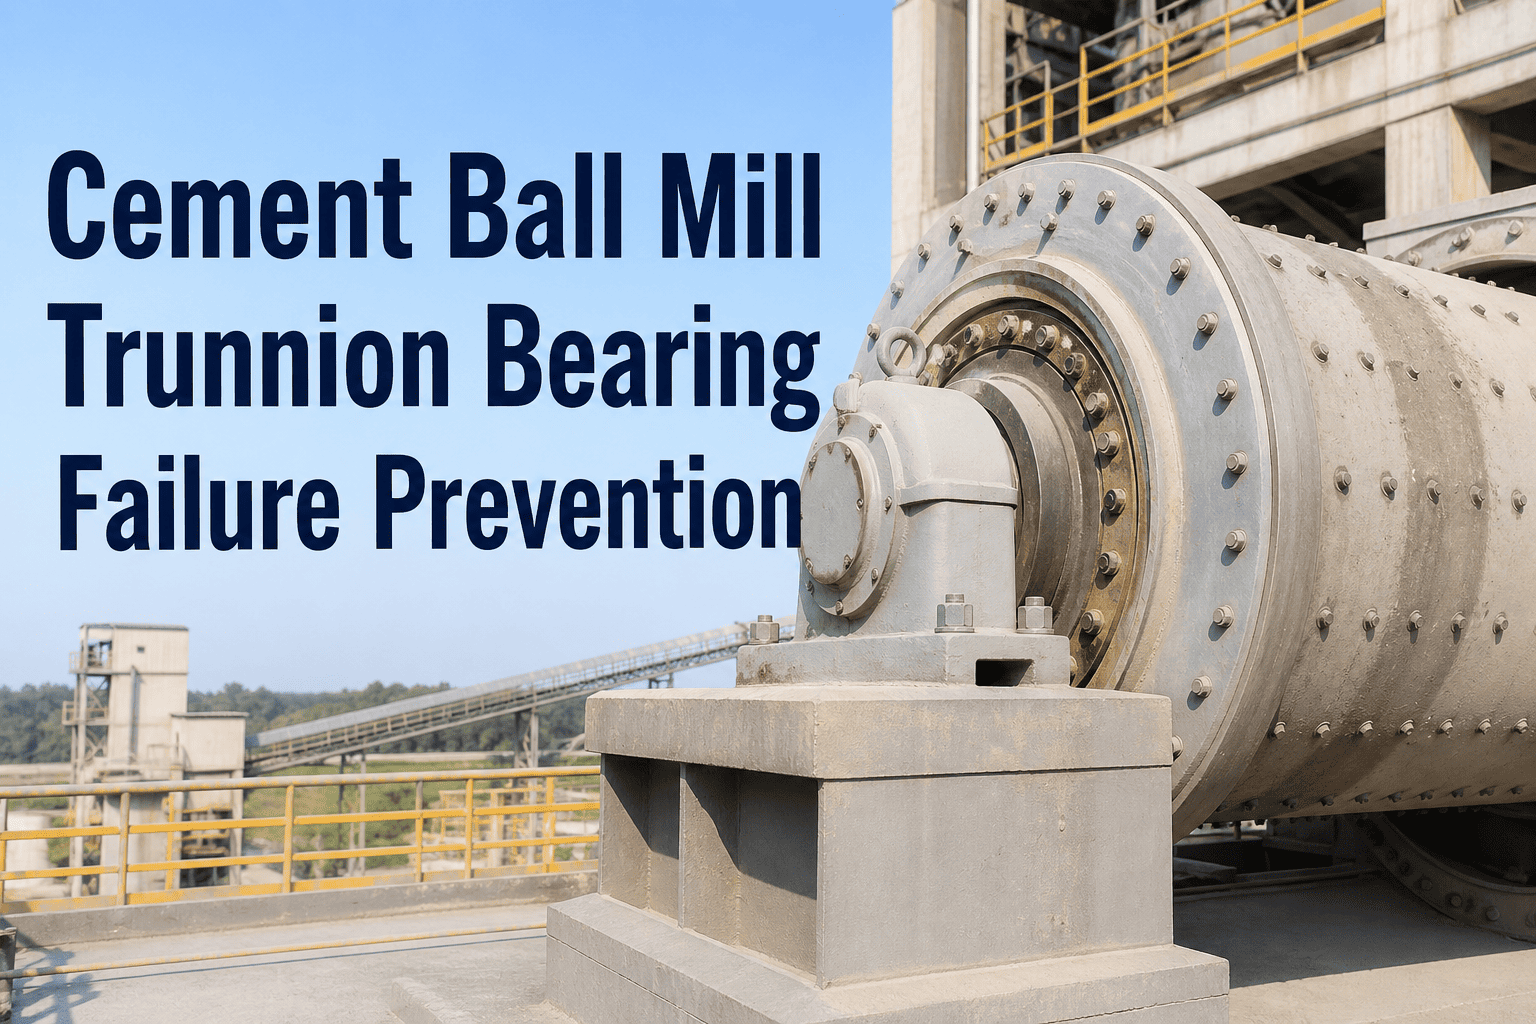
A cement mill running an unmanaged ball charge is quietly burning money every single shift — grinding media that is too coarse leaves clinker under-ground, media that is too fine over-grinds and wastes power, and nobody notices until the specific energy consumption report lands on a manager's desk three weeks late. Ball charge optimisation is the discipline of matching ball size distribution, filling degree, and top-up timing to the mill's actual grinding duty, and it is one of the few reliability levers that can cut specific energy consumption by roughly 4 to 6 kWh per tonne without a single capital rupee spent on new equipment. The problem for most plants is not knowing that optimisation works — it is tracking sieve analysis, media consumption, and top-up schedules across two or three chambers per mill without losing the thread in spreadsheets. That is precisely the discipline a connected maintenance platform like Oxmaint is built to hold together.
Grinding Reliability Guide · Cement Mill Operations
Cement Mill Ball Charge Optimisation, Made a Repeatable System
Ball size distribution, filling degree, top-up strategy, and SEC tracking — turned into a workflow your mill team actually follows every shift, not just during the annual audit.
Why Ball Charge Discipline Pays Off
4-6
kWh/t Potential SEC Reduction
A properly graded ball charge lowers specific power consumption meaningfully across most two-chamber closed-circuit mills without any hardware change.
2
Chambers to Balance Separately
Coarse-grinding and fine-grinding chambers need independent ball size curves, independent filling targets, and independent top-up schedules.
90
Days Between Sieve Audits
Most reliability teams run a quarterly longitudinal sieve analysis to catch size-distribution drift before it shows up in mill output quality.
30-60
g/t Typical Media Wear Range
Grinding media consumption varies widely with liner design and ball chemistry — tracking it per tonne is what turns wear data into a top-up plan.
What Ball Charge Optimisation Actually Means
A two-chamber cement ball mill does two different jobs with two different tools. Chamber one takes clinker and gypsum straight from the feed and needs heavy, large-diameter balls to fracture coarse material through impact. Chamber two takes that partially ground material and needs a much finer, lighter charge that grinds by attrition to hit the target Blaine fineness. Optimisation means designing — and then holding — the correct ball size distribution, percentage filling degree, and total charge weight for each chamber, then defending that design against the natural drift caused by wear.
Chamber 1 — Coarse Grinding
Handles feed material straight out of the clinker silo. Ball diameters typically range from roughly 90mm down to 60mm, selected to deliver enough impact energy to fracture large clinker nodules without over-crushing. Filling degree is generally kept in a moderate band that balances impact force against unnecessary power draw from an overfilled charge. This chamber is where the bulk of the size-reduction work happens, so uneven wear here shows up fastest in mill throughput.
Chamber 2 — Fine Grinding
Refines the pre-ground material to final cement fineness. Ball diameters step down through a graded curve, often from around 50mm to 15mm, sometimes supplemented with cylpebs to improve packing density and surface contact area. A well-graded fine-grinding charge is what actually controls Blaine fineness and residue targets — a charge that has drifted coarse here is one of the most common causes of an unexplained fineness shortfall.
The Five-Step Optimisation Workflow
01
Baseline Mill Audit
Measure current filling degree, run a longitudinal sieve analysis per chamber, and record power draw against throughput to establish the starting specific energy consumption figure you are trying to improve.
02
Design the Target Charge Curve
Set the target ball size distribution and filling percentage for each chamber based on feed characteristics, mill diameter, and the fineness target the product needs to hit consistently.
03
Plan the Top-Up Schedule
Convert media wear rate, expressed in grams consumed per tonne of cement produced, into a top-up interval and order quantity per size class so replenishment happens before the curve drifts out of tolerance.
04
Execute and Log Every Charging Event
Record each top-up as a work order against the mill asset — quantity, size class, and date — so the maintenance history shows exactly what charge state the mill was in at any point in time.
05
Monitor SEC and Re-Audit Quarterly
Track specific energy consumption on a rolling basis against the baseline, and repeat the sieve analysis on a fixed quarterly cadence to catch drift before it costs throughput or fineness quality.
Sieve results, top-up work orders, and media inventory living in three different places is how optimisation programs quietly die after month two. Oxmaint keeps the whole cycle — audit, plan, charge, monitor — on one asset record your whole team can see.
Warning Signs Your Mill Charge Needs Attention
SEC Creeping Up Month Over Month
A steady rise in kWh per tonne with no change in feed rate or product spec usually points to a charge that has drifted coarse or lost total weight to wear.
Fineness Missing Target Intermittently
Inconsistent Blaine or residue results, especially ones that correlate with time since the last top-up, are a classic sign of an under-charged fine-grinding chamber.
Media Consumption Rising Without Explanation
A jump in wear rate per tonne that is not tied to a liner change or feed chemistry shift often signals balls operating outside their designed size range.
Top-Up Orders Placed by Memory, Not Data
If the last sieve analysis on file is more than two quarters old, the current top-up plan is almost certainly working off outdated assumptions.
How a CMMS Holds the Program Together
Ball charge optimisation fails in most plants not because the engineering is hard, but because the paperwork discipline collapses after the first audit. A CMMS built for grinding operations closes that gap by giving every part of the cycle a permanent, searchable home tied directly to the mill asset.
Sieve Analysis Logging
Record each chamber's size distribution result against the mill asset so drift trends are visible at a glance instead of buried in old audit PDFs.
Media Inventory by SKU
Track stock levels for every ball size class separately, so top-up orders trigger automatically before a size class runs out mid-campaign.
Top-Up Work Orders
Every charging event becomes a timestamped work order with quantity and size class, building an audit-ready history of exactly what went into the mill and when.
SEC Trend Dashboards
Plot specific energy consumption against charging events so the team can see, in one view, whether the last top-up actually moved the needle.
Before vs After: A Typical Optimisation Cycle
| Metric |
Unmanaged Charge |
Optimised Charge |
| Specific Energy Consumption |
Baseline, drifting upward |
Reduced by roughly 4-6 kWh/t |
| Fineness Consistency |
Variable, reactive adjustments |
Stable against target Blaine |
| Top-Up Timing |
Ad hoc, based on memory |
Scheduled from wear-rate data |
| Sieve Analysis Records |
Scattered files, easily lost |
Logged against the mill asset |
| Media Spend Visibility |
Reviewed only at year-end |
Tracked per tonne, ongoing |
Frequently Asked Questions
How often should we run a sieve analysis on the ball charge?
Most plants run a full longitudinal sieve analysis every quarter, with a lighter check after any major top-up. Logging results consistently in
Oxmaint makes the drift trend visible instead of relying on memory between audits.
What causes ball charge to drift out of its designed size distribution?
Normal wear removes mass fastest from the size classes doing the most grinding work, so the curve gradually shifts coarse or thin over time. Top-up additions that don't match the depleting size class accelerate the drift further.
Does ball charge optimisation require stopping the mill for a long period?
A baseline audit and sieve sampling can typically be scheduled around a routine maintenance window. Top-up charging itself is a short, planned stoppage — the ongoing work of tracking wear and scheduling top-ups happens between stoppages, not during them.
How much can specific energy consumption realistically improve?
Plants correcting a genuinely drifted charge commonly see reductions in the range of 4 to 6 kWh per tonne. The exact gain depends on how far the current charge has drifted from its designed curve and how consistently top-ups are executed afterward.
How does a CMMS actually help with a mechanical process like ball charge?
It gives the audit data, top-up history, and media inventory a single permanent record tied to the mill asset, so decisions are made from trend data instead of guesswork.
Book a demo to see how this looks for a real mill.
Stop Losing kWh to an Unmanaged Ball Charge
Sieve analysis, top-up scheduling, media inventory, and SEC tracking belong on one asset record — not scattered across spreadsheets your team has to hunt down before every audit. Oxmaint gives your grinding team that single source of truth from day one.