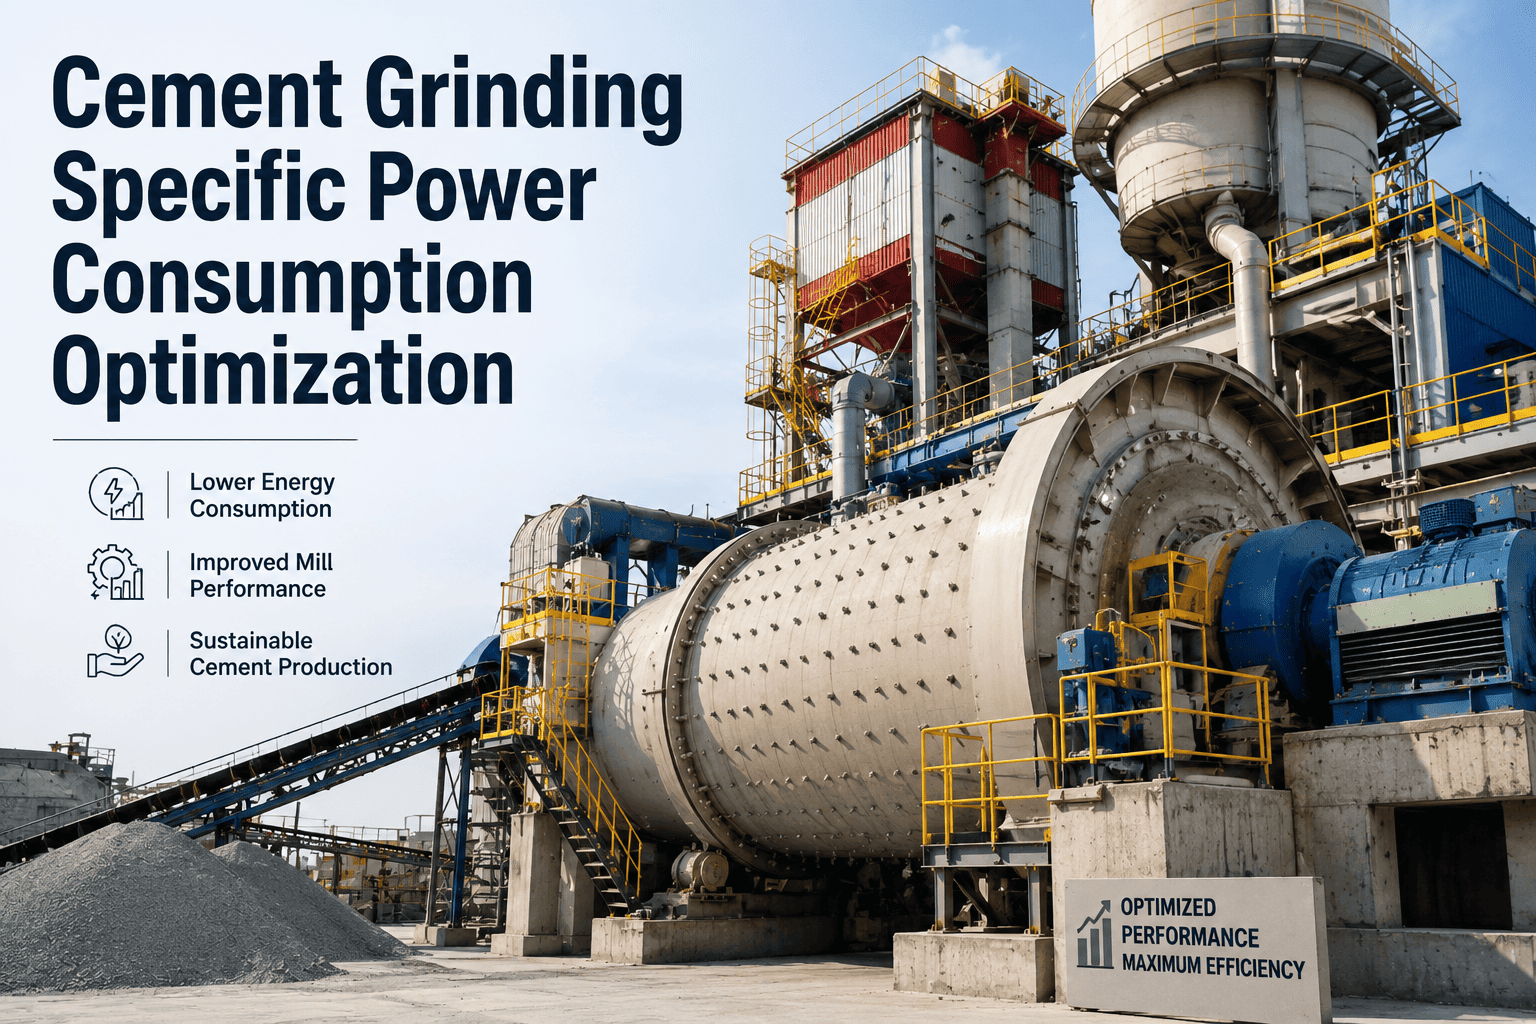
A cement mill that drifts from 32 kWh/t to 36 kWh/t rarely announces itself with an alarm — throughput holds, Blaine looks fine, and the only trace is a slightly higher number on next month's power bill. Multiply that drift across a 1.5 million tonne finish-grind circuit and the plant is quietly paying for hundreds of thousands of dollars in electricity that never needed to be spent. Specific power consumption, or SPC, is the single number that captures whether a grinding circuit is doing its job efficiently, and most of what moves it traces back to conditions a maintenance team could have caught weeks earlier. The guide below walks through how to measure SPC correctly, what actually drives it up, and how a system like Oxmaint keeps the maintenance side of that number under control.
Cement Mill Specific Power Consumption Optimization Guide
Grinding consumes roughly a third of a cement plant's total electricity draw, and most of that power is spent fighting inefficiency rather than breaking clinker. This guide breaks specific power consumption down into its measurable parts, maps the maintenance conditions that push it up, and lays out the checklist a reliability team can run this month to bring it back down.
What Specific Power Consumption Actually Measures
Specific power consumption is the electrical energy required to produce one tonne of finished cement at a target fineness, usually expressed in kWh per tonne. It is not a single meter reading — it is the sum of the mill motor, the separator, and the circuit fans, divided by finished tonnage over a stable measurement window, and it only means something when fineness and feed condition are held constant across the comparison.
| Grinding technology | Typical SPC (kWh/t) | Best-in-class range |
|---|---|---|
| Ball mill, open circuit | 36–42 | 32–34 |
| Ball mill, closed circuit with separator | 32–38 | 28–31 |
| Vertical roller mill | 20–25 | 18–20 |
| High-pressure grinding rolls | 12–16 | 10–12 |
Where the Kilowatt-Hours Actually Go
A finish mill's power draw splits into four categories, and only one of them does useful work. Understanding the split is what turns a general energy complaint into a specific, assignable maintenance target rather than a vague call to "run the mill more efficiently."
The Five Maintenance Conditions That Push SPC Up
Operational tuning gets most of the attention, but on most mills the largest single-digit-kWh recoveries come from conditions that are fundamentally maintenance issues, not process ones.
Every One of These Causes Is a Maintenance Record, Not a Mystery
Oxmaint ties liner wear inspections, media gradation sampling, and separator condition checks to the same asset record that tracks the mill's daily power draw — so a rising kWh/t trend points straight back to the inspection that was overdue.
A Diagnostic Checklist Before You Change Anything
Before adjusting separator setpoints or ordering new liners, confirm the baseline is real. A surprising share of apparent SPC problems trace back to how — and when — the number was measured.
The Optimization Workflow: From Baseline to Sustained Gain
Cutting SPC and keeping it down are two different disciplines. The first is a project; the second is a maintenance habit that has to survive staff turnover and production pressure.
That last step is where most optimization projects lose their gains. A liner replaced today and inspected on a fixed calendar interval will still wear unevenly under a hard clinker campaign — the inspection schedule needs to reflect actual duty, not a generic twelve-month default, or the SPC number quietly climbs back to where it started within a year.
Reactive vs. Condition-Based Maintenance: The SPC Difference
The gap between plants holding a steady low SPC and plants that drift upward every year is rarely the grinding technology — it is whether liner and media condition are tracked proactively or discovered when throughput finally drops.
| What happens | Reactive maintenance | Condition-based, tracked in Oxmaint |
|---|---|---|
| Liner wear detection | Found when throughput visibly drops | Flagged on a wear-rate inspection schedule |
| Media gradation | Top-loaded on a rough schedule | Sampled and logged against SPC trend |
| Separator condition | Checked only after a fineness complaint | Inspected on a defined interval, logged to the asset |
| SPC trend visibility | Reviewed monthly from a utility bill | Tracked daily against maintenance events |
| Typical SPC trajectory | Drifts upward 3–6% per year | Held within 1–2% of baseline |
What a Grinding Dashboard Should Actually Show
Once SPC is tied to maintenance records instead of a standalone utility number, the dashboard view a reliability manager needs looks different from a simple energy report.
Feed Moisture and Grinding Aid: The Variables That Mask a Real Problem
Two process variables can move SPC by several kWh/t without any change in mechanical condition, and both need to be ruled out before blaming liners or media. Raw feed moisture above roughly one percent starts to pack on grinding media and diaphragm slots, effectively reducing the mill's active grinding volume without any wear having occurred.
Grinding aid dosage works the opposite direction — an underdosed circuit loses the electrostatic dispersion effect that prevents fine particle agglomeration, so material re-coats the media and the mill quietly does the same grinding work twice. Because both variables are cheap to check and can swing SPC by two to four kWh/t on their own, they belong at the top of any diagnostic sequence, ahead of a liner inspection or separator teardown, since correcting either one takes hours rather than the days a mechanical repair usually requires.
Symptom-to-Cause Quick Reference
When SPC rises, the pattern of what else changed alongside it usually points to the cause faster than a full teardown inspection would.
| What you observe | Most likely cause | Where to check first |
|---|---|---|
| SPC rises, fineness unchanged | Mechanical loss (liner, bearing) | Liner wear log, motor amperage trend |
| SPC rises, fineness coarsens | Media gradation drift | Last gradation sample date |
| SPC rises, mill temperature climbs | Diaphragm blockage or ventilation loss | Diaphragm inspection, fan damper position |
| SPC rises after wet weather | Feed moisture | Raw material moisture log |
| SPC rises, dosing pump flagged | Grinding aid dosage | Dosing pump calibration record |
Why Monthly Tracking Isn't Fast Enough
A utility bill reviewed once a month tells a plant that SPC drifted — it does not say when the drift started, which shift it appeared on, or which maintenance event preceded it. By the time the monthly number is visible, the underlying cause has usually had three or four weeks to compound.
Daily tracking against a fixed baseline turns the same data into an early-warning signal instead of a retrospective. A two percent daily deviation is easy to trace back to a single inspection or dosing change; the same two percent averaged into a monthly figure is nearly impossible to attribute to anything specific. Book a demo to see daily SPC tracking against maintenance events on your own mills.
Maintenance Gains vs. Technology Upgrades: Knowing Which One You Need
Not every high-SPC mill needs a capital project. The benchmark table earlier in this guide shows a wide range within each technology category, and most plants running a ball mill at the high end of that range have more to gain from closing the maintenance gap than from switching to a vertical roller mill.
A useful rule of thumb: if a mill has been running more than 18 months without a documented liner wear survey or media gradation sample, assume several kWh/t are recoverable through maintenance alone before any technology comparison is worth funding. Only after that gap is closed does it make sense to evaluate whether the remaining distance to best-in-class justifies a capital case for HPGR pre-grinding or a VRM replacement.
Frequently Asked Questions
Turn Every kWh/t Drift Into a Traceable Maintenance Signal
Liner inspections, media gradation, and separator condition — tracked against the same SPC trend line, so the next drift gets caught before it costs a full production month.