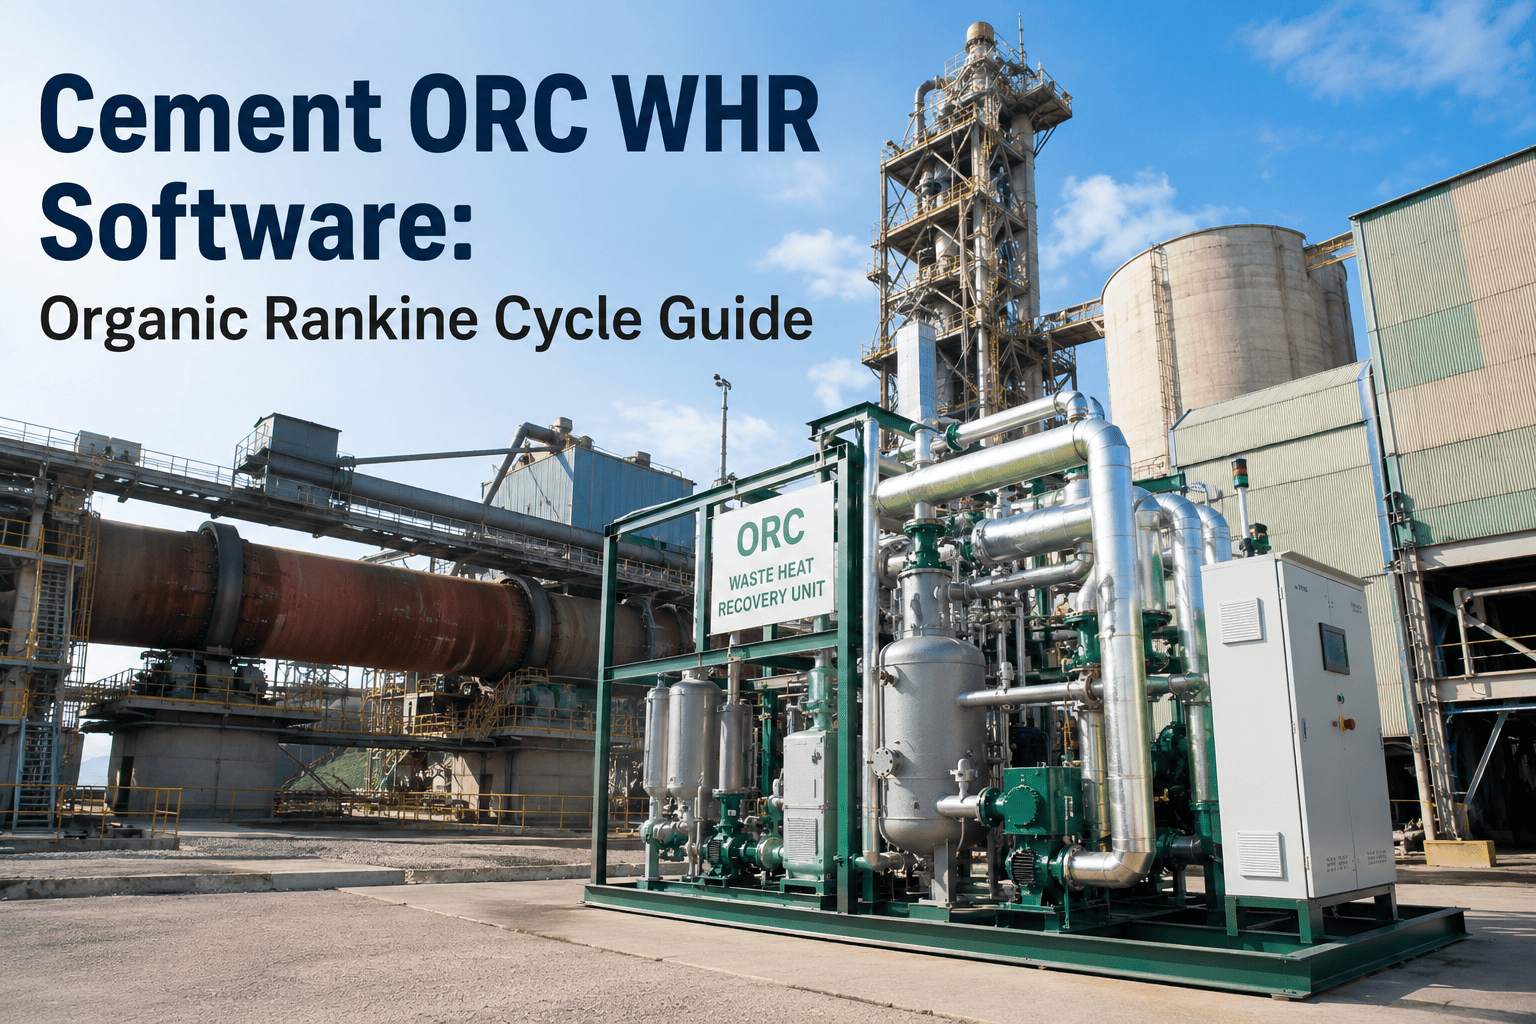
Roughly 35 to 40% of the total heat a cement kiln burns leaves the process without ever making clinker, mostly through preheater exhaust and clinker cooler vent air sitting in the 150 to 350°C band that organic Rankine cycle systems were built to catch. A well-run ORC unit on a mid-size line converts a meaningful slice of that stream into 7 to 13 MW of electricity, enough to cover a quarter or more of total plant demand, and pays back the investment in two to three years on fuel and grid savings alone. The catch is that ORC output degrades quietly. Working fluid loses purity, evaporator tubes foul with kiln dust, and condenser performance drifts with ambient conditions, and none of it trips an alarm the way a stopped conveyor does. Plants that log ORC unit efficiency against baseline every week catch that decay while it is still a tuning problem. Plants that only check the annual generation report catch it as a multi-year revenue loss. Book a demo to see how Oxmaint tracks working fluid condition and ORC unit efficiency against your original design baseline.
Cement ORC WHR software is a CMMS-based tracking system for organic Rankine cycle waste heat recovery units that logs working fluid quality, evaporator and condenser performance, and net electrical output against the plant's original design baseline. Because ORC efficiency decays gradually through fouling, fluid degradation, and dust erosion rather than through a single failure event, structured tracking catches the loss while it is still a maintenance fix instead of a multi-year revenue gap.
Where the ORC's Heat Actually Comes From
An ORC unit is only as good as the heat stream feeding it, and a cement plant has two very different streams worth capturing. Knowing which one is driving today's output tells you where to look when generation slips.
A 4-stage preheater exhausts at roughly 300 to 380°C; a 5 or 6-stage tower runs cooler, closer to 200 to 300°C, because more heat is already being reused inside the tower. This stream carries the highest thermal quality but also the heaviest dust load.
Excess cooling air not needed for combustion carries clinker's sensible heat out as vent air in this range. It runs cleaner than preheater gas but at lower and less stable volume, so ORC output from this stream tracks clinker rate closely.
Know Which Heat Source Is Actually Driving Today's Output
Oxmaint separates preheater and cooler contribution so a generation drop points to the right stream, not a guess.
Why ORC Output Slips Below Design
Organic working fluid can lose thermodynamic performance through contamination, moisture ingress, or thermal breakdown over years of cycling, and the loss shows up only as a slow, hard-to-explain generation decline.
Heavy dust loading in preheater exhaust fouls evaporator surfaces faster than most plants expect, reducing heat transfer and net output well before anyone schedules a cleaning shutdown.
Ambient temperature swings shift condenser back-pressure and output day to day. Without separating weather effect from equipment condition, a real efficiency loss hides inside normal seasonal noise.
Most plants review ORC output monthly or quarterly against a budget number, not weekly against a design efficiency curve, so gradual decay accumulates for months before it triggers a maintenance response.
How Oxmaint Manages the ORC Unit
Heat exchanger inlet and outlet gas temperature, pressure drop, and dust load indicators are logged against the original design curve, with cleaning work orders generated when fouling reduces heat transfer beyond a set threshold.
Fluid pressure, superheat, and periodic quality sampling are tracked over the unit's operating life, flagging the slow degradation pattern that standard operator rounds are not built to catch.
Rotational speed, vibration, and isentropic efficiency are trended against commissioning baseline, separating mechanical wear from upstream heat source variation.
Condensing pressure is normalized against ambient temperature so a genuine fouling or cooling water issue is visible instead of being absorbed into normal weather-driven variation. Book a demo to see component-level tracking for your ORC unit.
From Efficiency Drop to Maintenance Action
Net output is compared against the design efficiency curve for the current heat source temperature and volume, not a flat generation target.
Evaporator, working fluid, turbine, and condenser readings are checked in sequence to isolate which component is driving the gap.
A cleaning, sampling, or inspection work order is created for the specific component, with the estimated MW impact attached for prioritization.
Output is re-checked against baseline after the work order closes, confirming the fix actually restored efficiency rather than just closing a ticket.
Turn a Slow Generation Decline Into a Fixable Work Order
Component-level tracking, weather-normalized condenser monitoring, and design-curve comparison built from your commissioning data.
Structured ORC Tracking vs Annual Review
| Metric | CMMS-Tracked ORC Program | Annual Generation Review Only |
|---|---|---|
| Time to Detect Efficiency Loss | 1 to 2 weeks via weekly baseline comparison | 3 to 9 months, discovered at annual review |
| Root Cause Isolation | Component-level, evaporator vs fluid vs condenser | Bulk "output below budget" with no component breakdown |
| Working Fluid Life | Tracked and sampled against a degradation curve | Replaced reactively after visible output collapse |
| Weather-Adjusted Condenser Reporting | Ambient-normalized, so real fouling is visible | Seasonal swings mask genuine equipment decline |
| Annual Generation vs Design | 92 to 96% of design output sustained | 70 to 82% of design output, undiagnosed |
What the Platform Tracks
Net electrical output plotted against the original commissioning efficiency curve for the current heat source condition, not a single flat generation target.
Evaporator, working fluid, turbine, and condenser each carry their own trend and threshold, so a generation gap points to a component instead of the whole unit.
Periodic fluid quality checks are scheduled and logged against the unit's operating hours, catching degradation long before output visibly drops.
Condensing pressure is adjusted for ambient temperature so seasonal effects do not hide a genuine fouling or cooling water problem.
Evaporator cleaning is scheduled against measured heat transfer loss rather than a fixed calendar, timing outages to when they are actually needed.
Every ORC stop or derate is logged with cause, duration, and estimated lost generation, feeding capital and spares planning with real numbers.
Where Most ORC Units Stand Today
Outcomes After Oxmaint Deployment
Investment vs Return
| Component | Cost | Annual Savings | Payback |
|---|---|---|---|
| Design Curve and Component Baseline Setup | $12K one-time configuration | $210K from recovered generation | Under 4 weeks |
| Working Fluid Sampling Program | $7K per year | $95K from delayed fluid replacement and avoided output loss | Under 5 weeks |
| Weather-Normalized Condenser Monitoring | $9K per year | $80K from earlier fouling detection | Under 6 weeks |
| Full ORC Tracking Program | $28K per year | $385K+ combined avoidance | Under 4 weeks |
Frequently Asked Questions
Your ORC Unit Is Losing Output Right Now. Start Measuring Which Component.
Design curve tracking, component health breakdown, working fluid sampling, and weather-normalized condenser monitoring, live in under four weeks.