Ask ten people in a cement plant which equipment matters most and you will hear ten different answers, usually shaped by the last breakdown. Without a shared method, maintenance effort drifts toward noisy, visible problems instead of the assets that actually threaten clinker output, safety and compliance. A criticality ranking turns opinion into a repeatable score that guides inspection frequency, spares and budget. Teams that record those scores and the resulting plans in cement plant CMMS software can keep the ranking alive instead of leaving it in a forgotten workshop file.
Maintenance Management / Planning / Asset Criticality
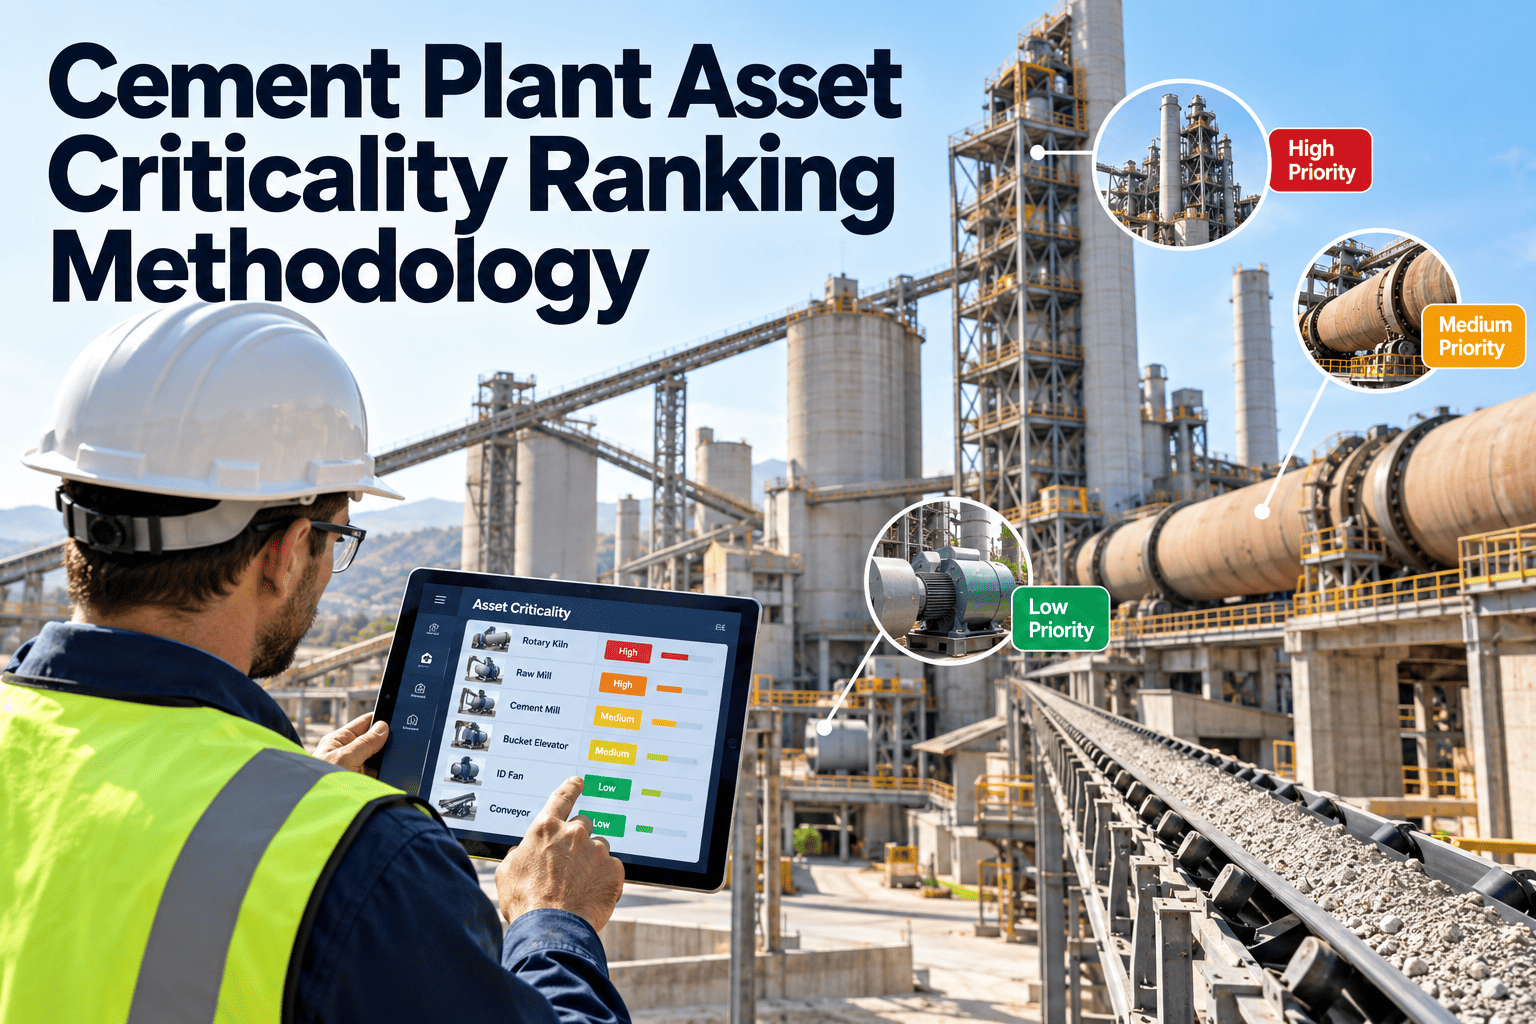
Cement Plant Asset Criticality Ranking Methodology
A practical scoring method for ranking kilns, mills, fans, conveyors and auxiliaries, so maintenance plans, monitoring and spares go where failure would hurt most.
Quarry and CrusherFeed continuity
Raw MillQuality and output
PreheaterProcess stability
KilnSingle point of stoppage
CoolerClinker handling
Cement MillProduct output
Packing and DispatchCustomer delivery
Why Cement Plants Need a Formal Criticality Ranking
- Cement production is a continuous, serial process, so one stopped asset can halt everything behind it.
- Maintenance budgets and people are limited, and equal attention for every asset wastes both.
- Spare parts, condition monitoring and inspection routes all need priorities to be rational.
- Safety, emissions and quality obligations make some assets important regardless of output impact.
- Audits and insurers increasingly expect a documented basis for maintenance decisions.
The Scoring Model in One Line
Consequence
multiplied by
Likelihood
adjusted by
Detectability
Consequence is scored across several criteria and the highest or weighted value is used. Detectability is optional but useful where condition monitoring can warn of failure.
Consequence Criteria for Cement Manufacturing
| Criterion | Question to Ask | Score 1 Means | Score 5 Means |
|---|---|---|---|
| Safety | Could failure injure people? | No credible harm | Potential serious injury or fatality |
| Environment and compliance | Could failure breach emission or permit limits? | No effect | Reportable release or limit exceedance |
| Production | How much output is lost and for how long? | Negligible, easy bypass | Full kiln or plant stoppage |
| Quality | Will product quality be affected? | No effect | Off-specification clinker or cement |
| Repair cost and lead time | How costly and slow is recovery? | Low cost, parts on site | High cost, long lead time |
| Redundancy | Is there a standby or alternative route? | Full standby available | No backup of any kind |
Eight Steps to Build the Ranking
1
Define the hierarchy
Organize plant, area, system and equipment levels so scoring happens at a consistent level.
2
Agree the criteria
Choose consequence criteria and describe each score in plain language that operators understand.
3
Gather failure history
Collect work orders, downtime logs and incident records to inform likelihood.
4
Hold scoring workshops
Bring operations, maintenance, safety and quality together to score area by area.
5
Calculate and tier
Compute scores and group assets into tiers with clear thresholds.
6
Calibrate
Compare rankings against experience. Challenge results that feel wrong and record why.
7
Assign strategies
Attach maintenance, monitoring and spares policies to each tier.
8
Review on a cycle
Re-score after major changes, failures or process modifications.
Turn Your Ranking Into Living Maintenance Plans
Store criticality on each asset and let it drive schedules, inspections and spares in one system.
The Risk Matrix: From Scores to Tiers
C5
5
10
15
20
25
C4
4
8
12
16
20
C3
3
6
9
12
15
C2
2
4
6
8
10
C1
1
2
3
4
5
L1
L2
L3
L4
L5
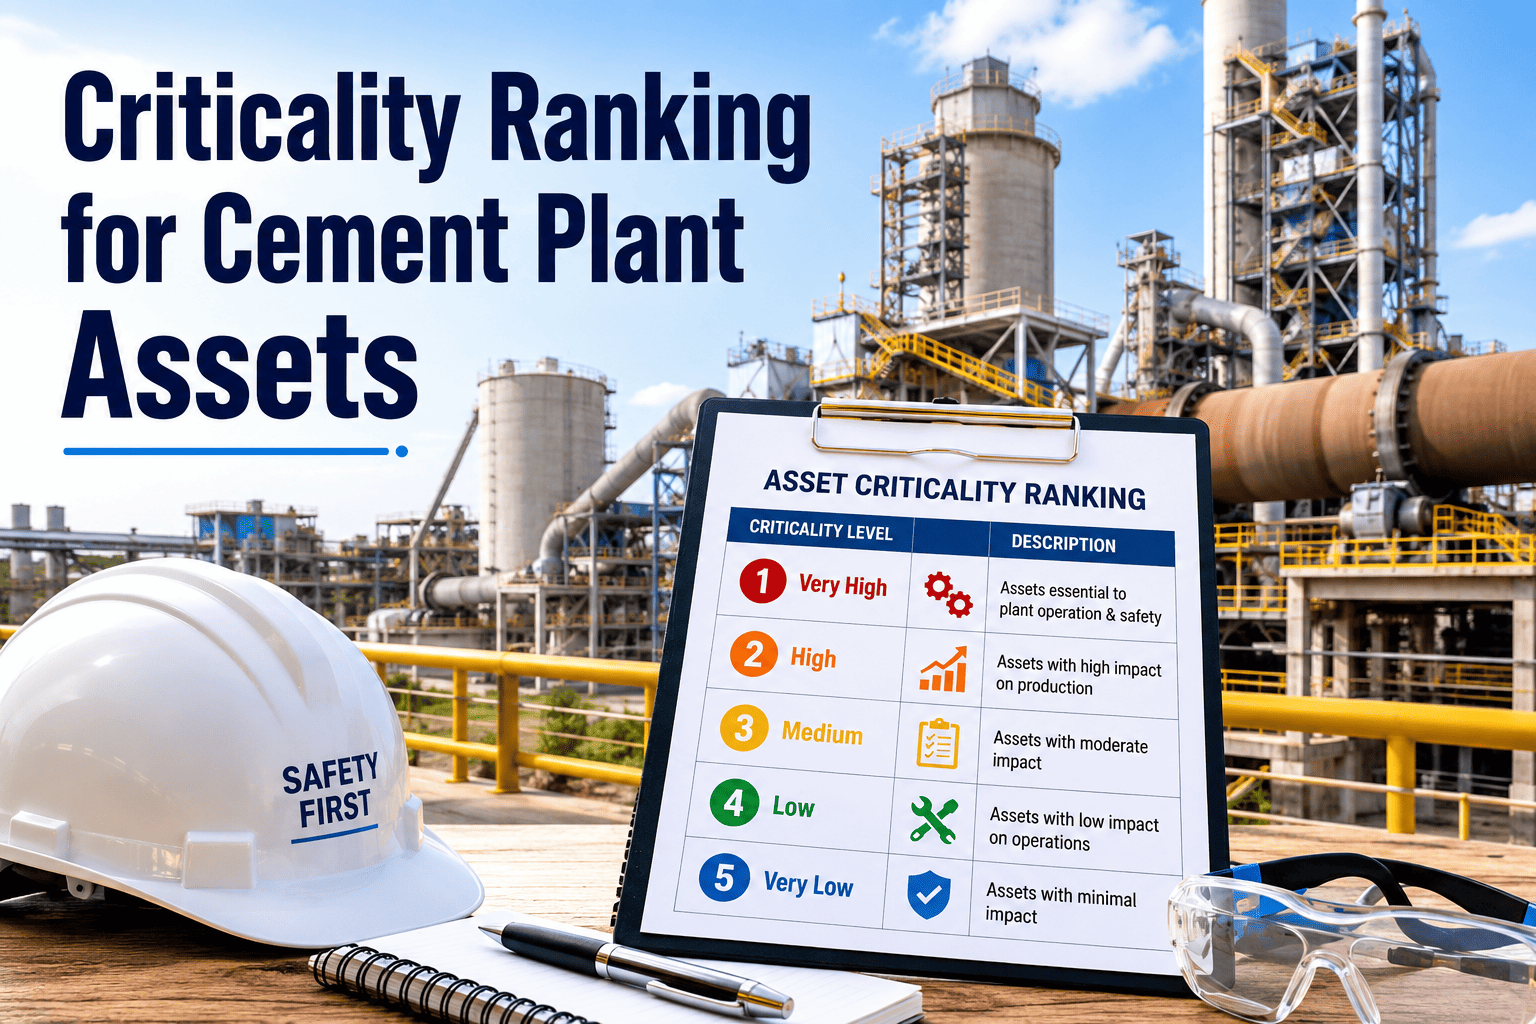
Tier A: score above 12. Highest priority.
Tier B: score 6 to 12. Managed preventive plan.
Tier C: score 5 or less. Efficient, low-cost approach.
C stands for consequence and L for likelihood, each scored 1 to 5. Thresholds are an example and should be set by your own team.
Illustrative Ranking Example for a Cement Line
The scores below are examples to show the method. Each plant must score its own assets using its own history and process.
| Asset | Consequence | Likelihood | Score | Tier |
|---|---|---|---|---|
| Kiln main drive | 5 | 3 | 15 | A |
| Raw mill main gearbox | 5 | 3 | 15 | A |
| Preheater ID fan | 5 | 2 | 10 | B |
| Clinker cooler drive | 4 | 3 | 12 | B |
| Bucket elevator, kiln feed | 4 | 3 | 12 | B |
| Baghouse fan, main stack | 4 | 2 | 8 | B |
| Packing machine, single unit of several | 2 | 3 | 6 | B |
| Plant air compressor, standby available | 1 | 3 | 3 | C |
What Each Tier Should Trigger
Tier A
Critical assets
Condition monitoring, detailed inspections, root cause analysis on failure, defined insurance spares and shutdown-focused overhauls.
Tier B
Important assets
Preventive maintenance by time or running hours, periodic inspections, min and max spares for common wear parts.
Tier C
Supporting assets
Basic care, operator checks and run-to-failure where safe and economic, with parts bought on demand.
Likelihood Inputs Worth Using
Evidence from the plant
- Number of failures in recent years.
- Repeat failure modes from work orders.
- Condition monitoring trends.
- Age and operating hours.
Context that changes likelihood
- Operating environment such as heat, dust and abrasion.
- Load and duty compared with design.
- Quality of past maintenance.
- Known design weaknesses or obsolete parts.
Component-Level Criticality Inside a Critical Asset
- A kiln is a critical system, but not every part of it carries the same risk, so break it down into drive, support rollers, shell, seals and burner.
- Score components that have distinct failure modes, lead times and monitoring options.
- Use the component rank to select inspections, spares and detailed task lists.
- Avoid scoring too deep, because thousands of tiny scores become unmanageable and rarely change decisions.
Ranking Pitfalls and How to Avoid Them
| Pitfall | Result | Remedy |
|---|---|---|
| Everything scored high | No real priorities, budget spread thin | Force distribution and challenge scores of 5 |
| Single viewpoint | Operations or maintenance bias | Include operations, safety, quality and maintenance |
| Ignoring redundancy | Standby assets ranked as critical | Score the system effect with standby in place |
| One-time exercise | Ranking becomes outdated | Schedule reviews after changes and major failures |
| No link to action | Scores never change the plan | Tie tiers to maintenance strategies in the system |
Before and After a Criticality Program
Before
- Priority set by whoever shouts loudest.
- Same inspection interval for every fan or gearbox.
- Spares chosen from habit or past incidents.
- Little evidence to justify budget requests.
After
- Documented scores and shared language across teams.
- Monitoring and tasks concentrated where risk is highest.
- Spares matched to consequence and lead time.
- Budget requests supported by ranked risk.
Scoring Considerations by Cement Process Area
| Process Area | Typical Critical Assets | What Often Raises Consequence |
|---|---|---|
| Crushing and raw material handling | Crusher drive, apron feeder, long belt conveyors | Feed interruption, limited stockpile buffer |
| Raw grinding | Mill drive, gearbox, separator, mill fan | Kiln feed quality and silo level |
| Pyroprocessing | Kiln drive, support rollers, ID fan, cooler drives | Hot restart losses, refractory damage, long repair times |
| Fuel preparation | Coal mill, fuel feeding systems | Kiln stability, fire and explosion hazards |
| Cement grinding | Mill drive, separator, circulating elevators | Product output and storage cover |
| Emission control | Bag filters, ESP components, stack fans | Permit limits and reporting obligations |
| Packing and loading | Packers, bulk loading, weighing systems | Customer deliveries and dispatch queues |
Safety and Compliance Override Rule
- Some assets must be treated as critical regardless of their numeric score.
- Examples include safety interlocks, fire protection, emission monitoring and pressure-relief devices.
- Mark these as statutory or safety-critical and assign inspection tasks with documented evidence.
- Keep the override list short and reviewed, so it does not become a loophole for ranking everything high.
Running an Effective Scoring Workshop
A
Prepare data
Bring failure history, downtime logs, drawings and a draft hierarchy to the session.
B
Score together
Discuss each consequence criterion aloud, so assumptions are visible and recorded.
C
Challenge extremes
Review every score of 5 and every score of 1 to confirm the reasoning.
D
Record decisions
Note why a score was chosen, so later reviews understand the logic.
From Tier to Maintenance Strategy
Questions for Tier A assets
- Which failure modes matter most?
- Which can be detected early, and by what method?
- What inspection interval gives enough warning?
- Which spares are needed before a shutdown?
Questions for Tier B and C assets
- Is time-based maintenance justified?
- Would operator checks be enough?
- Is run-to-failure safe and affordable?
- Can parts be bought quickly if needed?
Data Quality Behind a Trustworthy Ranking
- Failure codes on work orders must be consistent, otherwise likelihood is based on guesswork.
- Downtime should be recorded against the asset that caused it, not the area that suffered it.
- Asset names and tags must match the field, so technicians can find the right record quickly.
- Operating hours and condition readings add objective support to scores for aging equipment.
- Regular feedback from technicians helps correct scores that no longer reflect reality.
Using Criticality to Prioritize Daily Work
| Situation | Without Ranking | With Ranking |
|---|---|---|
| Two corrective jobs arrive together | First reported gets attention first | Tier A asset job is scheduled ahead of Tier C |
| Limited technicians on a shift | Preventive tasks skipped at random | Critical asset tasks protected, low tier tasks deferred |
| Budget cut requested | Across-the-board reductions | Cuts focused on low-risk assets with documented reasoning |
| Shutdown scope growing | Debate based on opinion | Scope reviewed by tier and failure evidence |
Connecting Criticality to Condition Monitoring Choices
- Reserve vibration analysis, thermography and oil analysis for assets where early warning changes the outcome.
- Choose techniques that match the failure mode, such as vibration for rotating equipment and thermography for electrical connections.
- Define alert limits and the work order response for each reading, so data leads to action.
- Review monitoring results during re-scoring, because improved detection can lower overall risk.
- Do not install monitoring on low-tier assets simply because it is available.
Keeping the Ranking Alive After the Workshop
Monthly
Review downtime and repeat failures by tier, and flag assets whose behavior no longer matches their score.
After events
Re-score after major failures, equipment replacement, capacity changes or new regulatory requirements.
Annually
Refresh the full ranking with cross-functional input and update strategies, spares and monitoring plans.
Common Questions Teams Ask While Scoring
What if a standby unit exists?
Score the effect on the process with the standby available, then note the risk of the standby also being unavailable. Check that the standby is actually maintained and tested.
What if the asset is cheap but stops the line?
Cost of the part does not decide criticality. A small sensor or valve that stops the kiln deserves a high consequence score and a ready spare.
What if there is little failure history?
Use expert judgement, manufacturer data and experience from similar plants, then revisit the score as evidence builds.
Benefits Across Maintenance, Operations and Finance
- Maintenance gains a defensible basis for scheduling, staffing and shutdown scope.
- Operations gains clarity about which equipment needs protection and which can run with less attention.
- Stores and purchasing gain guidance on which spares deserve stock and which can be bought on demand.
- Safety and environmental teams gain a visible list of assets that need documented inspections.
- Finance gains evidence for budget requests linked to risk rather than habit.
How Oxmaint Helps Keep Criticality Useful
Asset management
Hold hierarchy, tier and score on each asset so everyone sees the same ranking.
Preventive maintenance
Set task frequency and inspection depth according to tier.
Work orders
Prioritize corrective work by asset criticality and record failure data for re-scoring.
Inventory
Link spares to critical assets and review stock against tier.
Condition-based workflows
Trigger work from inspection readings on Tier A equipment.
Reports
Review backlog, downtime and cost by tier to prove the program works.
KPIs to Prove the Ranking Is Working
Tier A PM compliance
Completion of scheduled tasks on critical assets.
Unplanned downtime by tier
Stoppages grouped by criticality level.
Backlog by tier
Open work on critical assets compared with others.
Repeat failures
Number of repeat failure modes on Tier A and B.
Review currency
Share of scores reviewed within the agreed period.
Criticality Ranking Readiness Checklist
- Asset hierarchy is defined and consistent across areas.
- Consequence criteria and scales are written and agreed.
- Failure and downtime history has been gathered.
- Cross-functional scoring sessions are complete for each area.
- Tier thresholds are set and results calibrated.
- Each tier has a maintenance, monitoring and spares strategy.
- Scores are stored on the asset record and reviewed on a schedule.
Asset Criticality FAQs
How many assets should be ranked in a cement plant?
Rank at equipment level first, then break only Tier A assets into components. This keeps the effort manageable.
How often should criticality be reviewed?
Review after major modifications, serious failures and at least on a set annual or periodic cycle.
Is a risk matrix enough on its own?
It helps rank assets, but value comes from linking each tier to real maintenance and spares strategies.
Can criticality be stored against each asset?
Yes. Sign up for Oxmaint to keep tiers on asset records and drive schedules from them.
Who should take part in scoring sessions?
Include operations, maintenance, safety and quality. Book a demo to see how teams record results.
Put Maintenance Effort Where Failure Costs the Most
Rank your assets, set strategies by tier and track results in a maintenance system your whole plant can use.