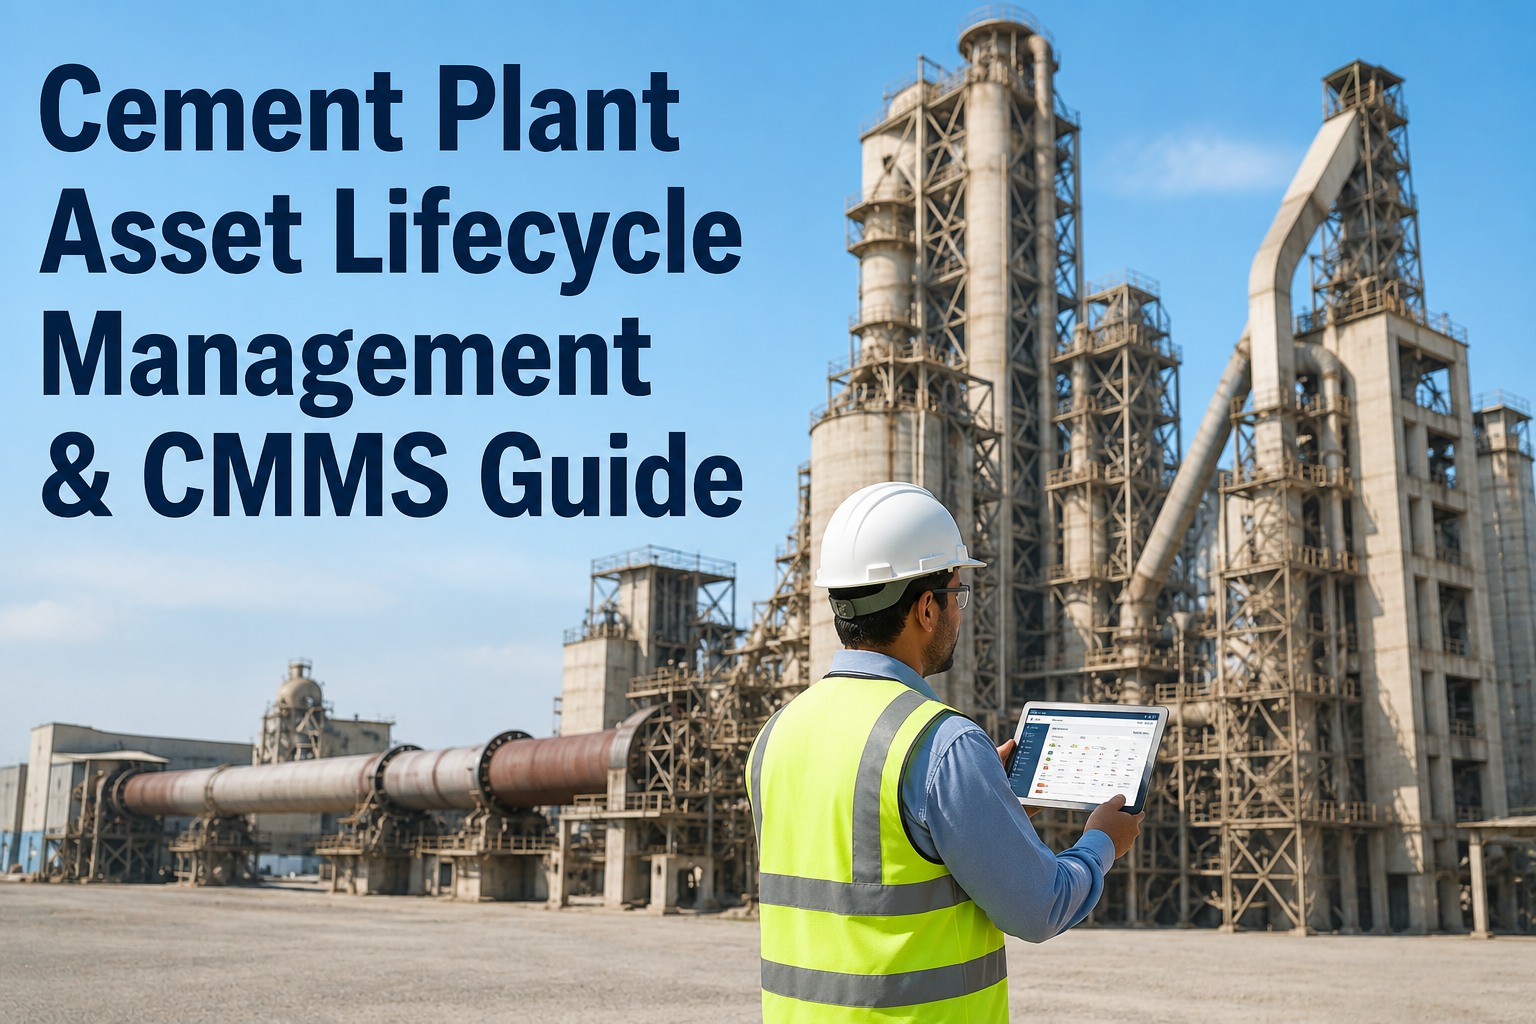
For a cement plant running 24/7 with 1,500–3,000 tracked assets, lifecycle management is the strategic layer that sits above preventive and predictive maintenance — the discipline that tells you when a kiln shell reaches its 18–22 year fatigue ceiling, when a ball mill trunnion is approaching its 12-year relining window, and when capital replacement beats another round of repair. This guide walks plant managers, reliability engineers, and maintenance directors through the asset lifecycle model that aligns ISO 55000 thinking with a CMMS built for heavy-process industries. By the end, you'll see how a structured registry, condition-based data, and 20-year capital forecasting come together — and you can Start Free Trial to map your own plant hierarchy in under an hour.
What if you could forecast every major cement asset replacement 5 years before failure?
Kiln shells, ball mills, crushers, and generators don't fail by surprise — they follow lifecycle curves a CMMS can model. This guide shows plant teams how to turn a static asset registry into a 20-year capital and reliability roadmap.
Above maintenance execution sits the asset lifecycle decision layer
Preventive maintenance keeps a kiln running this quarter. Predictive maintenance catches a bearing fault next week. Asset lifecycle management answers the question that actually moves the balance sheet: do we spend $1.8M re-tubing this preheater cyclone, or $4.2M replacing it in 2027?
Five pillars of a cement plant asset lifecycle model
A CMMS that supports lifecycle management isn't just a work-order system — it's the single source of truth for every asset's identity, condition, cost history, and remaining useful life. These five pillars build on each other.
Every asset from the quarry crusher to the packer gets a unique ID, parent-child location, OEM spec sheet, install date, design life, and criticality rating (A/B/C). Without this foundation, lifecycle modeling is guesswork — a 2,400-asset plant should have 100% registry coverage before forecasting begins.
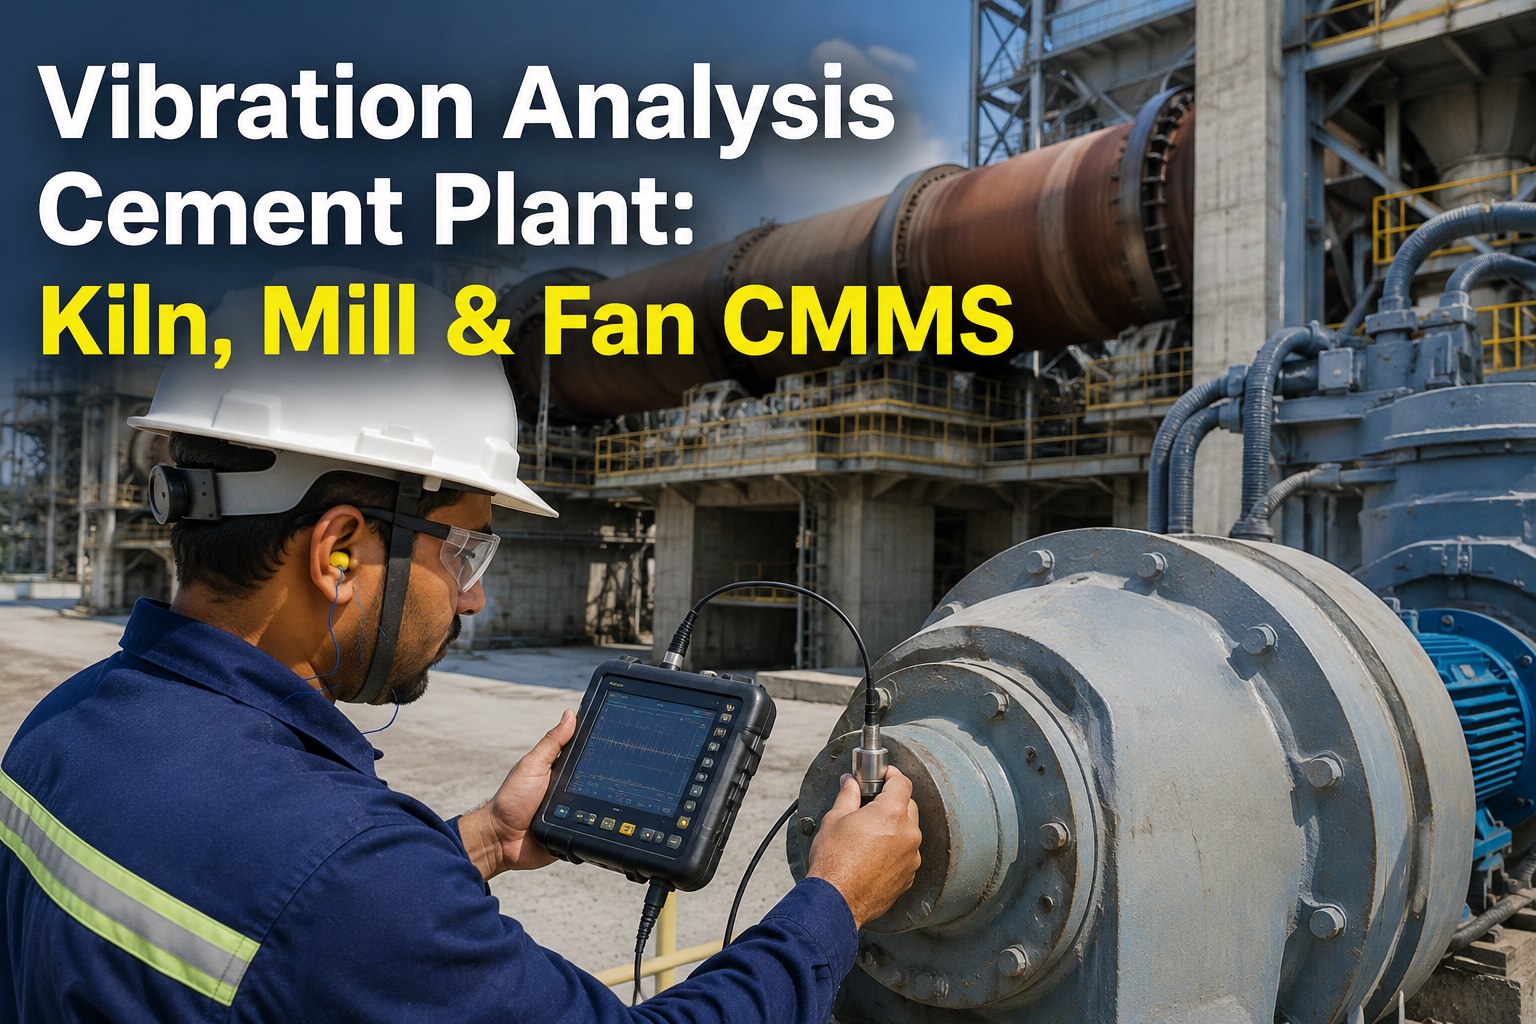
Shell temperature scans, vibration spectra, oil analysis, ultrasonic thickness readings, and thermography feed the lifecycle model in real time. A kiln shell with 8mm remaining wall thickness (down from 25mm original) is approaching its replacement trigger regardless of calendar age.
Each asset is tagged: Infant (0–2yr), Mature (stable failure rate), or Wear-out (increasing failure rate). The CMMS calculates Weibull parameters from failure history so a crusher frame in wear-out stage triggers a different capital conversation than one still in mature operation.
Every work order, parts issue, contractor invoice, and downtime minute rolls up to the asset. When cumulative repair cost on a 15-year-old ball mill crosses 60% of replacement cost, the lifecycle model flags it for capital review — the classic "repair-vs-replace" inflection point.
Lifecycle forecasts export directly into the plant's 5- and 10-year capital expenditure plan. Instead of last-minute budget requests, replacements are queued 24–36 months ahead — giving procurement time to source long-lead items like kiln tires (52-week lead time) or girth gears (40-week lead time).
Kiln, ball mill, crusher, generator — lifecycle profiles at a glance
A 2.4 MTPA plant with 1,840 tracked assets typically has 40–60 assets in the "capital-decision zone" at any given time. Here's how four critical asset classes move through their lifecycle and what the CMMS should be telling you at each stage.
| Asset Class | Design Life | Key Failure Mode | Condition Signal | Capital Trigger |
|---|---|---|---|---|
| Kiln Shell | 18–22 yr | Thermal fatigue, ovality, cracks | Shell temp scan + ovality measurement | Wall thickness < 12mm or crack propagation rate > 50mm/yr |
| Ball Mill Shell & Trunnion | 10–14 yr | Trunnion fatigue, shell cracking | Vibration + ultrasonic thickness | Cumulative repair > 60% of replacement or 3rd trunnion reline cycle |
| Crusher Frame | 15–20 yr | Frame cracking, jaw wear | Vibration trend + visual inspection | Frame weld repair count > 4 or recurring cracking in same zone |
| Captive Generator | 20–25 yr | Winding insulation, bearing wear | Partial discharge + oil analysis | Insulation resistance < 1.5 MΩ or 2nd major rewind completed |
| Preheater Cyclone | 8–12 yr | Refractory wear, tube thinning | Thickness mapping + temperature | Wall thickness < 6mm or 3rd full reline within 10 years |
| ID Fan / ESP | 12–16 yr | Impeller erosion, rotor imbalance | Vibration + airflow degradation | Efficiency drop > 12% or impeller replacement count > 3 |
The lifecycle cost formula every plant engineer should know
When does replacing an asset beat repairing it again? The answer lives in cumulative cost, remaining useful life, and risk-adjusted downtime exposure. A CMMS calculates this automatically — but the underlying logic is straightforward.
The CMMS flags Ball Mill #2 for capital review 18 months before the next planned reline — giving procurement time to source the long-lead girth gear (40-week lead time) and align the replacement with the scheduled 30-day kiln outage. Result: the plant avoids a probable unplanned 12-day mill failure that would cost an estimated $1.4M in lost clinker production.
From registry to 20-year plant strategy in four phases
Implementing lifecycle management in a cement CMMS isn't a weekend project — it's a phased rollout that typically spans 6–9 months for a mid-size plant. Here's the timeline most successful implementations follow.
Audit existing asset list, verify hierarchy, fill in missing install dates and OEM specs. Target: 100% of A-critical assets fully documented (kiln, mills, crushers, main fans, generators). Import 3–5 years of historical work orders to seed failure data.
Connect vibration sensors, oil analysis lab feeds, shell scanners, and thickness measurement rounds to the CMMS. Define condition thresholds per asset class — e.g., kiln shell temp alarm at 380°C, ball mill vibration alarm at 7.1 mm/s RMS.
Calculate Weibull failure parameters for top 100 assets. Assign lifecycle stage (infant/mature/wear-out). Run the LRTI formula across the fleet. First output: a capital-decision dashboard showing 40–60 assets in the review zone with recommended action and timing.
Export lifecycle forecasts into the plant's 5-year capital plan. Hold quarterly lifecycle review meetings with operations, finance, and procurement. The CMMS auto-updates LRTI scores as new work orders close — the model stays live, not a static spreadsheet.
See your cement plant's 20-year capital roadmap in one dashboard
Upload your asset list, connect condition data, and the CMMS builds the lifecycle model — automatically flagging every asset approaching its repair-vs-replace inflection point.
Common questions from cement plant and reliability teams
Preventive maintenance follows a time-based schedule (e.g., lubricate every 500 hours). Predictive maintenance uses condition data to catch failures early (e.g., vibration spike on a mill pinion). Lifecycle management is the strategic layer above both — it uses failure history, condition trends, and cost data to decide whether to keep maintaining an asset or replace it. PM and PdM keep today's plant running; lifecycle management shapes the 5- and 20-year capital plan.
Start with A-critical assets where failure stops production or creates safety risk: kiln shell and tire, ball mill shell and trunnion, primary crusher frame, preheater cyclones, ID fans, captive generators, and main conveyors. These 40–80 assets drive 70%+ of unplanned downtime cost. Once they're modeled, expand to B-critical assets. You can Start Free Trial and import your criticality-ranked asset list directly.
A minimum of 3 years of work-order history gives the CMMS enough failure events to calculate meaningful Weibull parameters for major assets. With less than 3 years, the model relies more heavily on OEM design-life benchmarks and condition data — still useful, but less statistically confident. Plants with 5+ years of clean CMMS data get the most accurate lifecycle forecasts.
Yes — a cement-focused CMMS should accept condition data via API, OPC-UA, or scheduled file imports from vibration monitors (SKF, Bently), oil labs (Bureau Veritas, WearCheck), and shell scanners. The key is that condition readings attach to the specific asset ID in the registry, so the lifecycle model sees both the failure history and the real-time health signal together.
Most mid-size cement plants (1,500–2,500 assets) see measurable ROI within 9–12 months — typically from avoiding one major unplanned outage ($1.2–2.4M) and deferring or accelerating the right capital replacements. The larger payback comes in years 2–3 as the capital plan stabilizes and emergency procurement spend drops by 30–40%. Book a demo to see a plant-specific ROI projection based on your asset count and production rate.
Build your cement plant's lifecycle roadmap today
Join the plant teams using CMMS-driven lifecycle management to cut unplanned downtime, stabilize capital spending, and extend the useful life of every kiln, mill, and crusher.
Free 14-day trial · No credit card