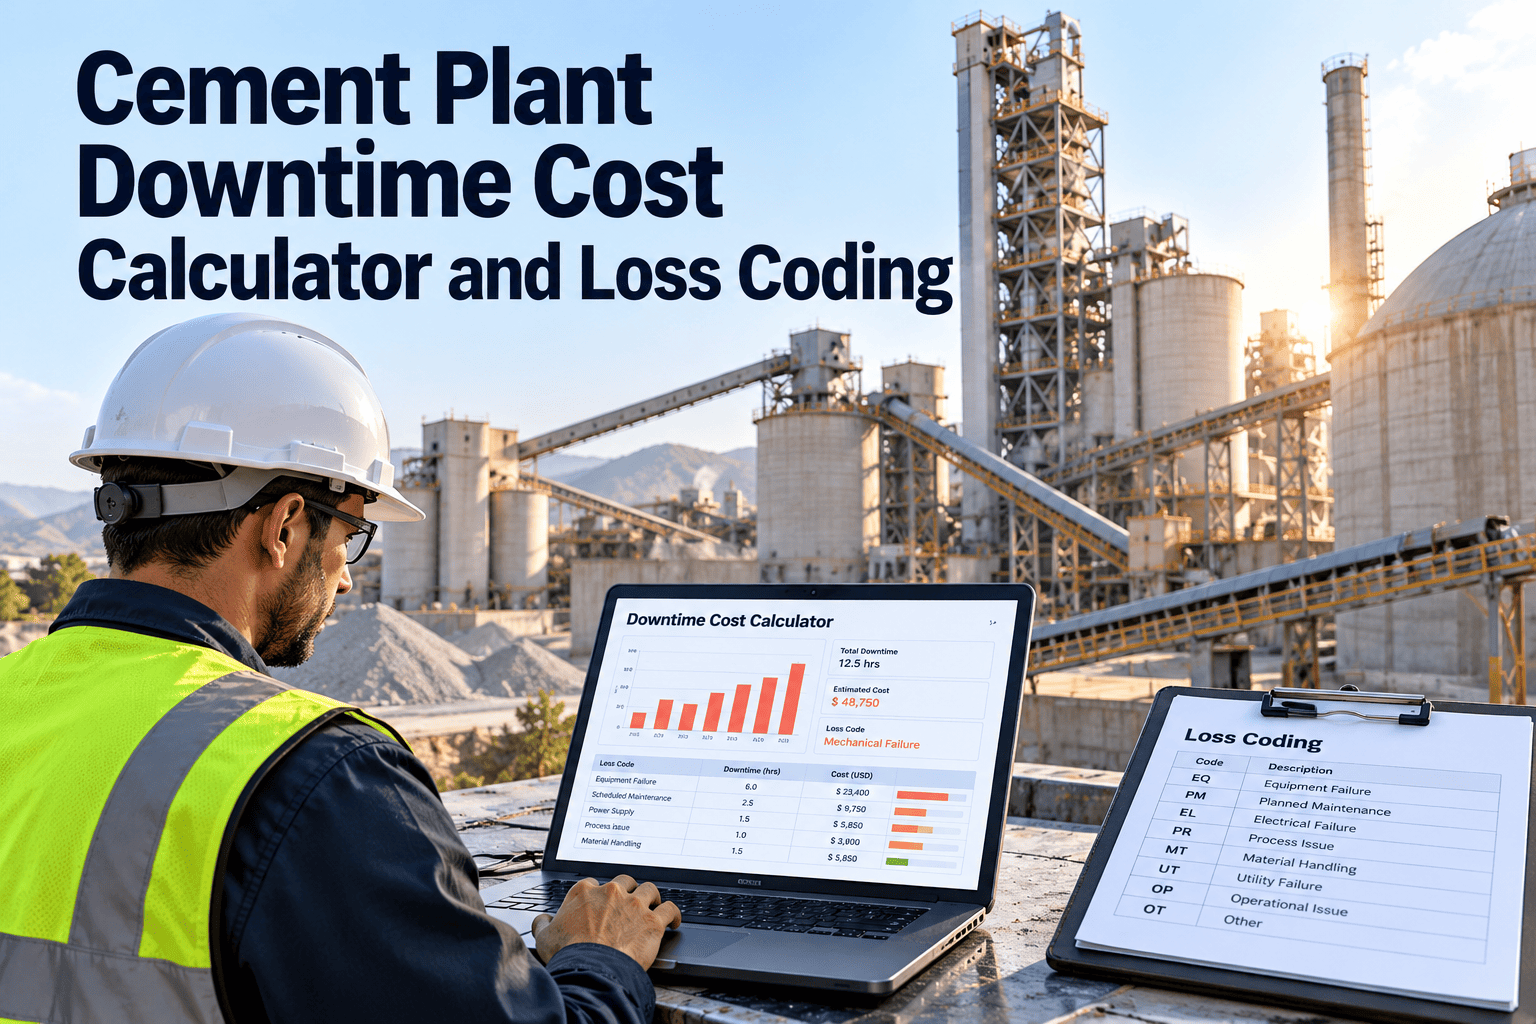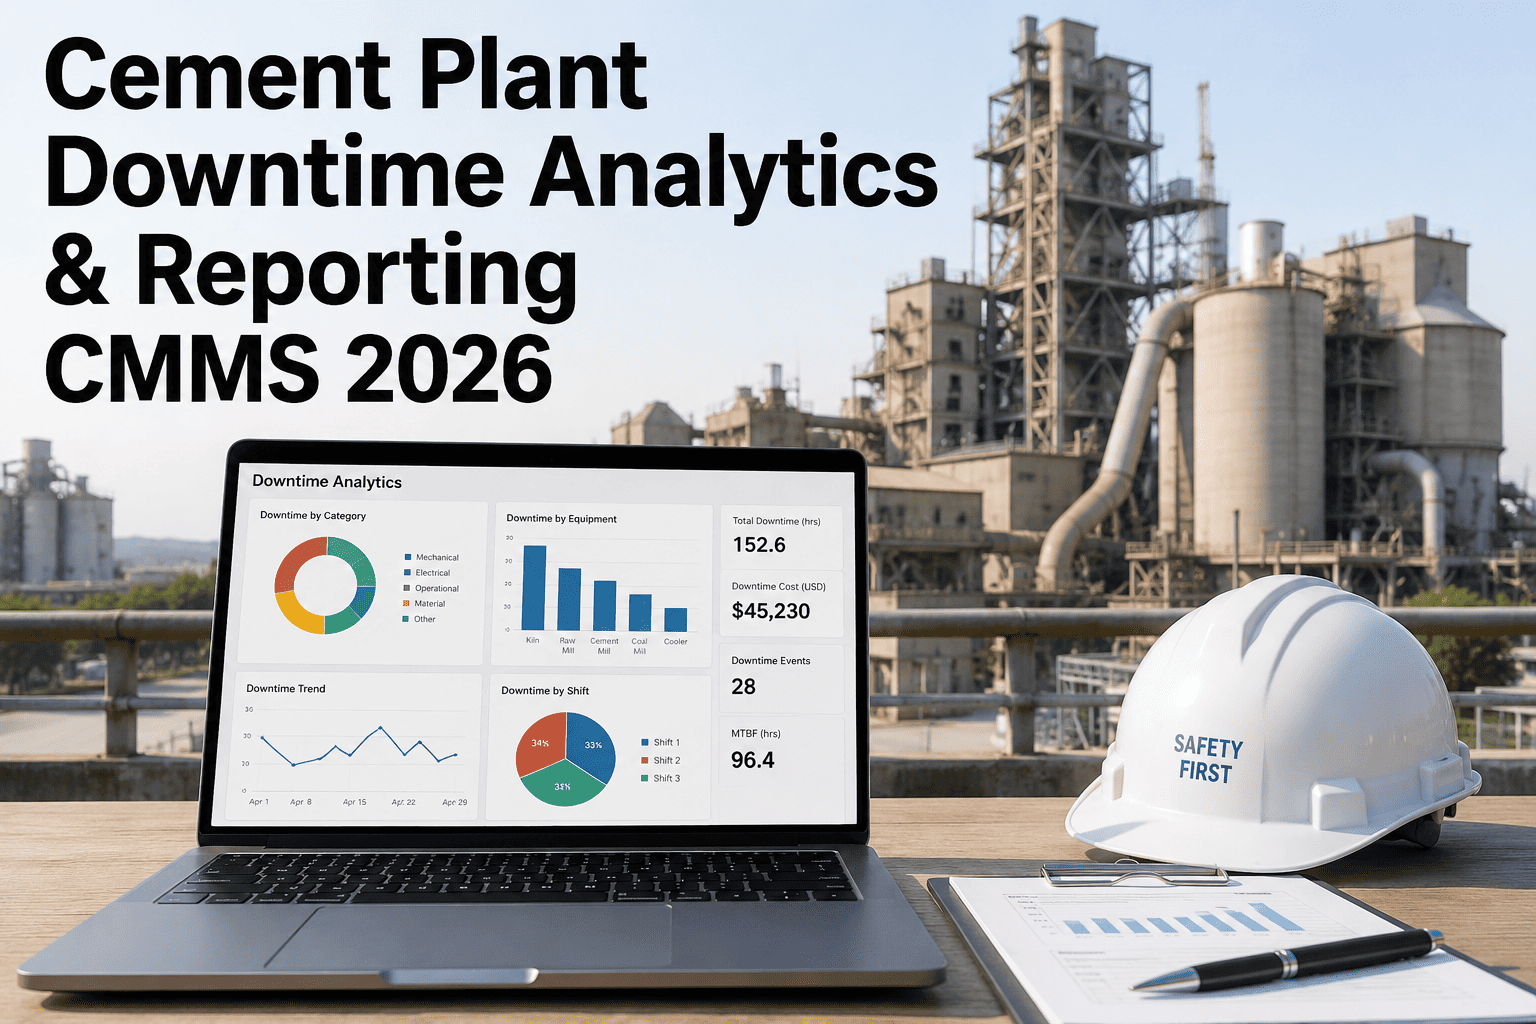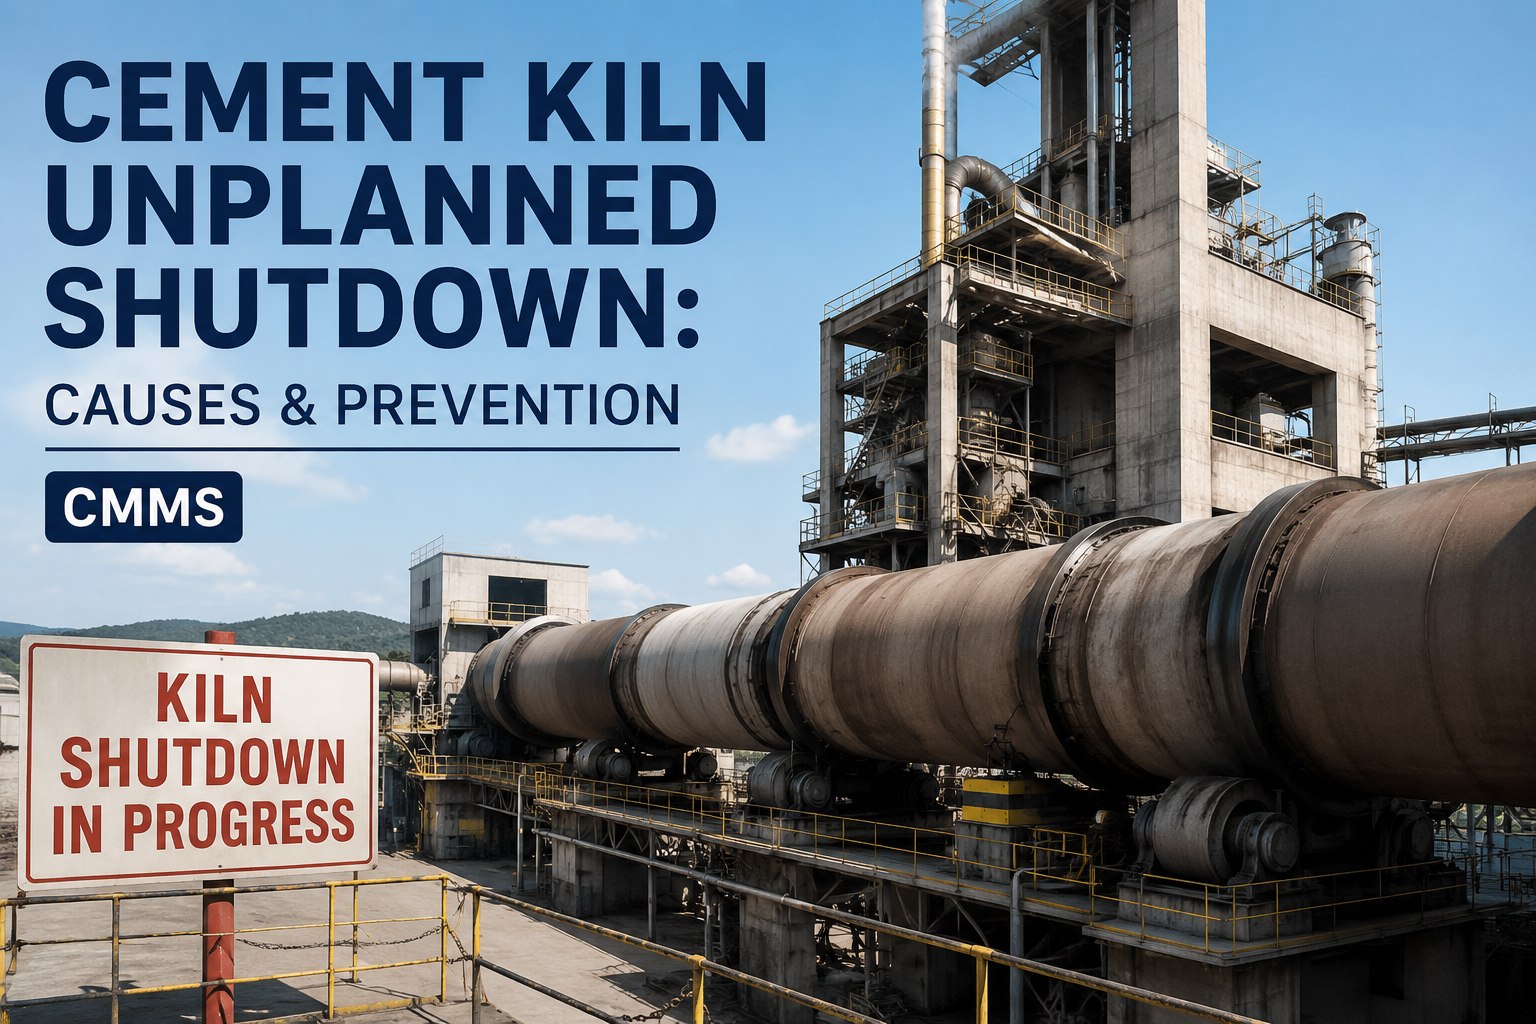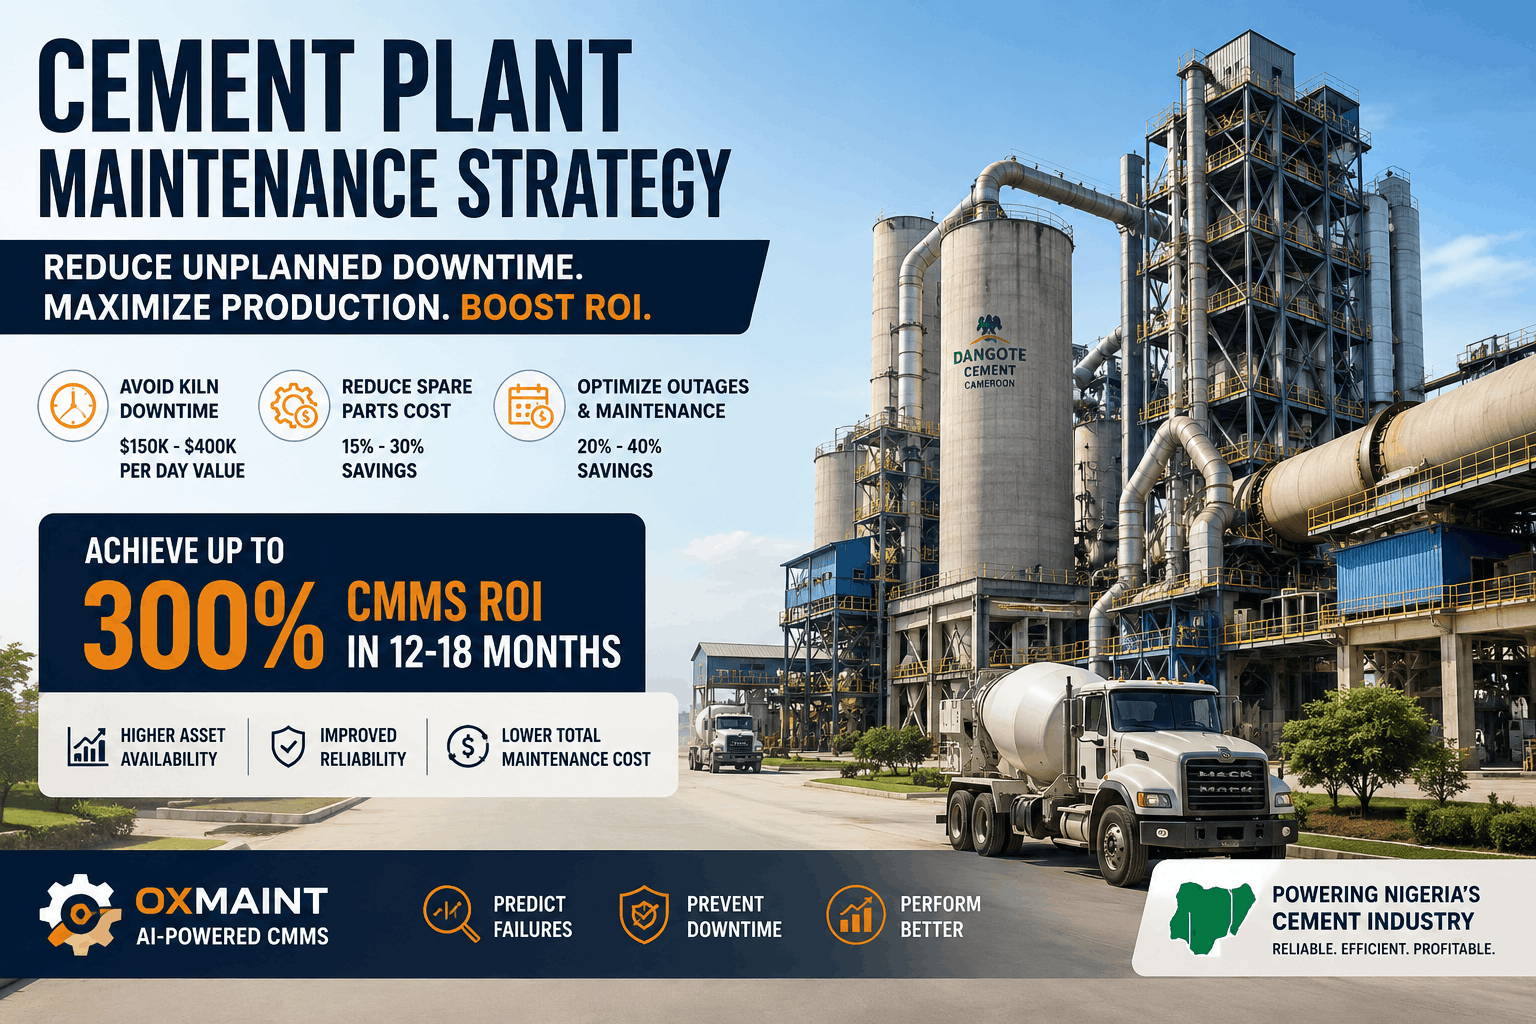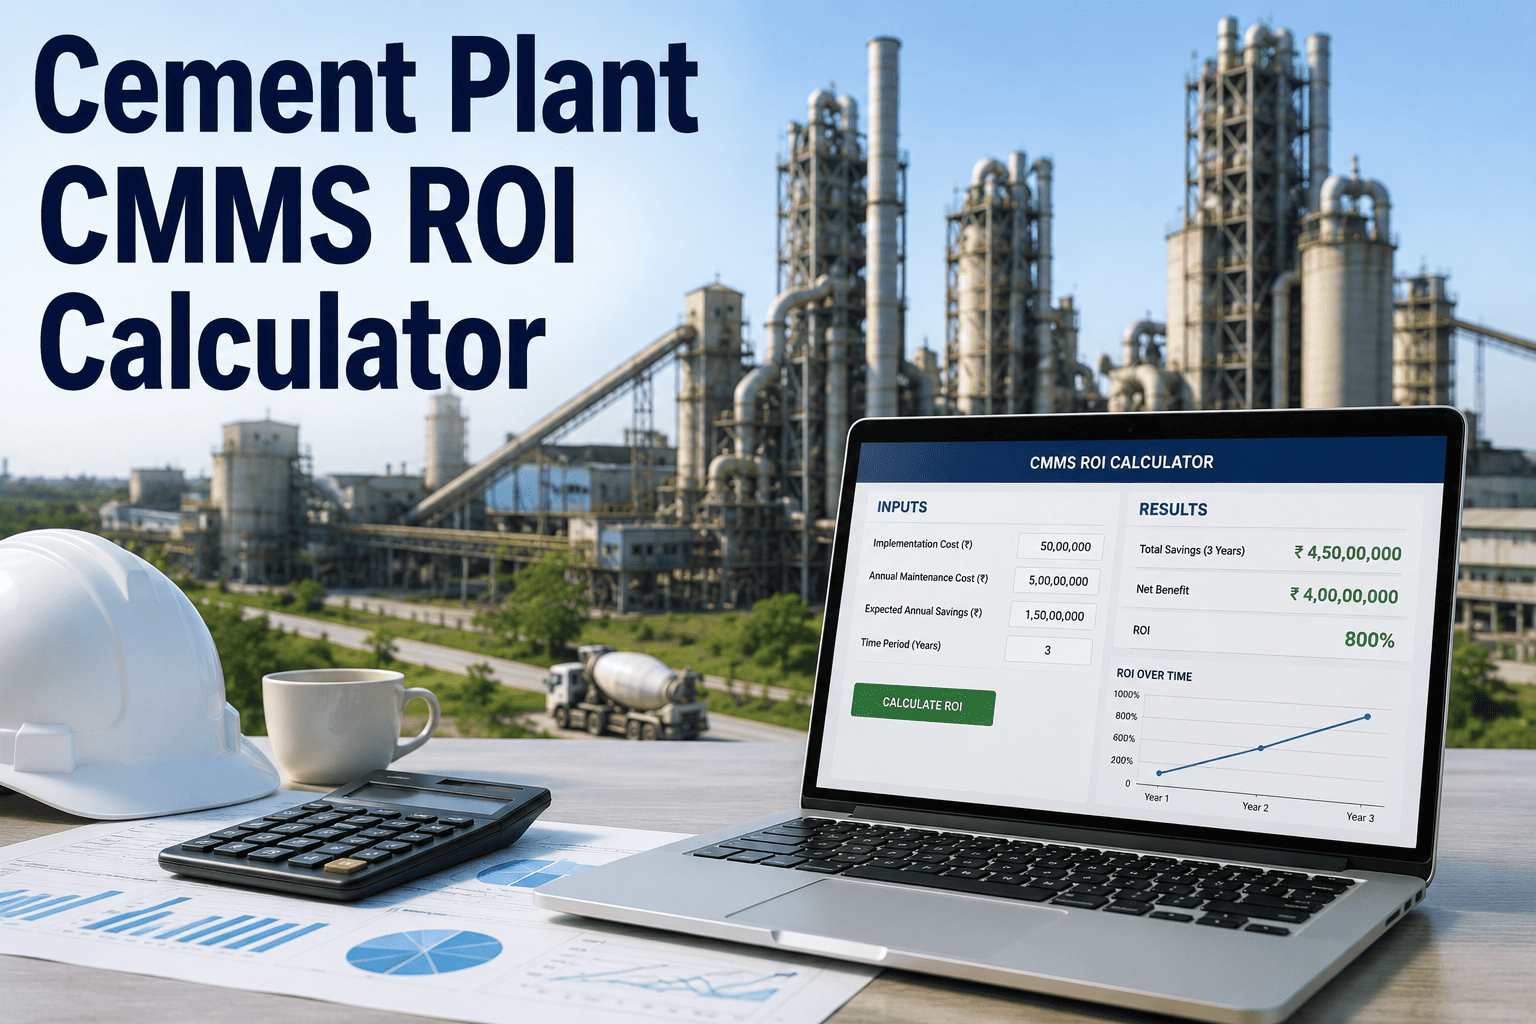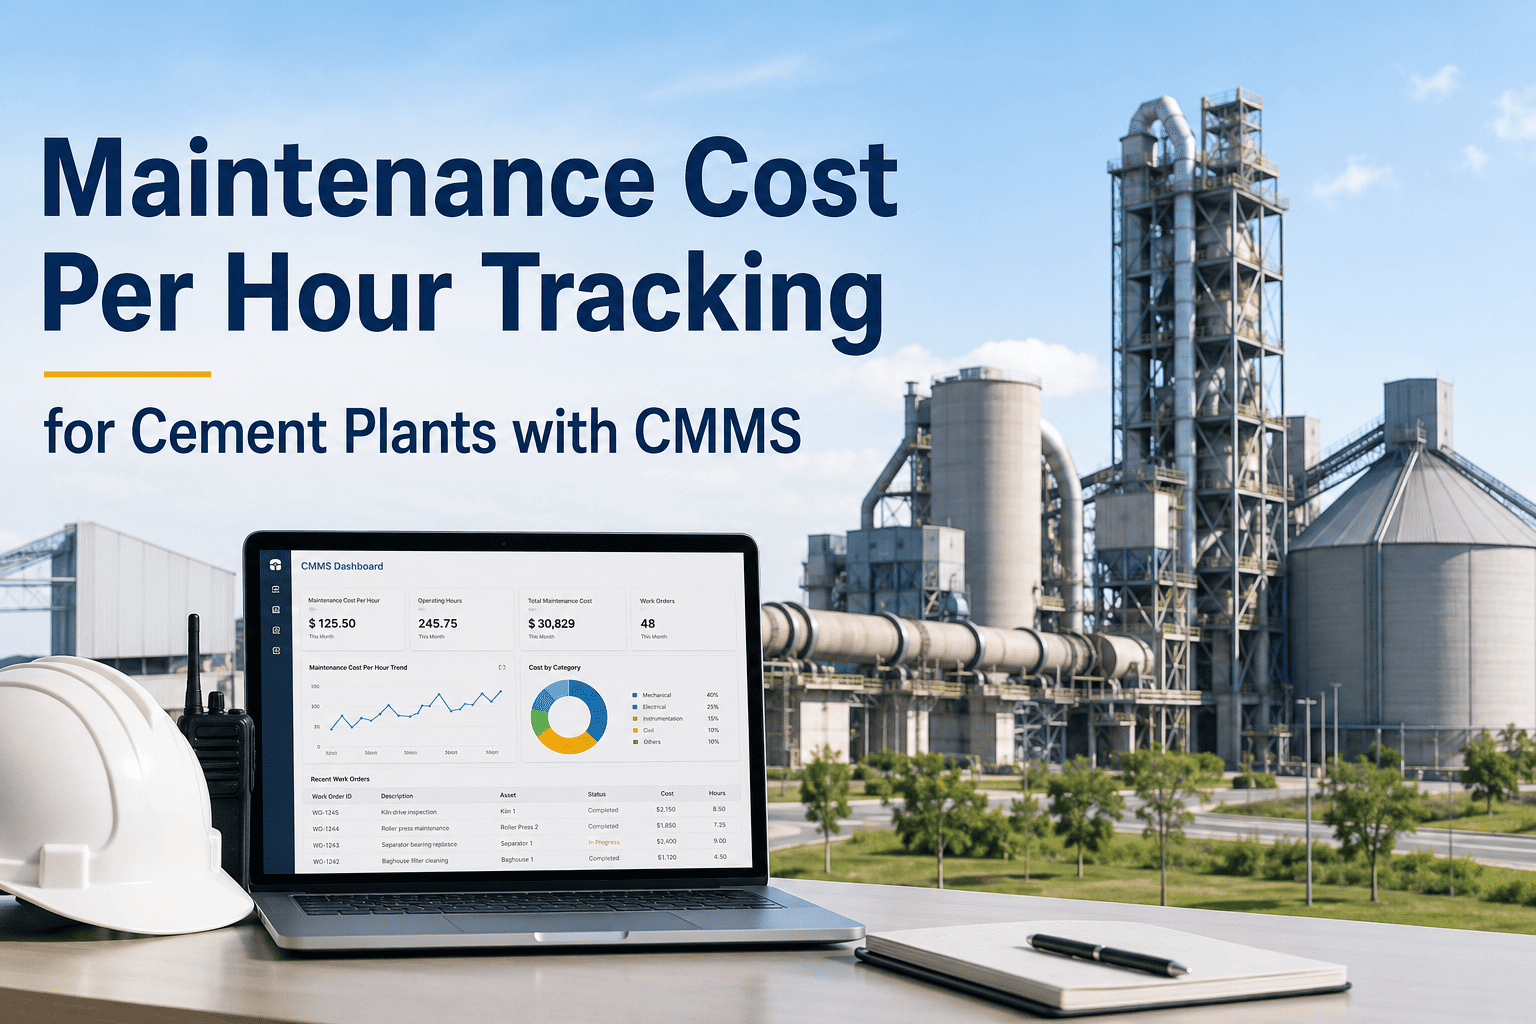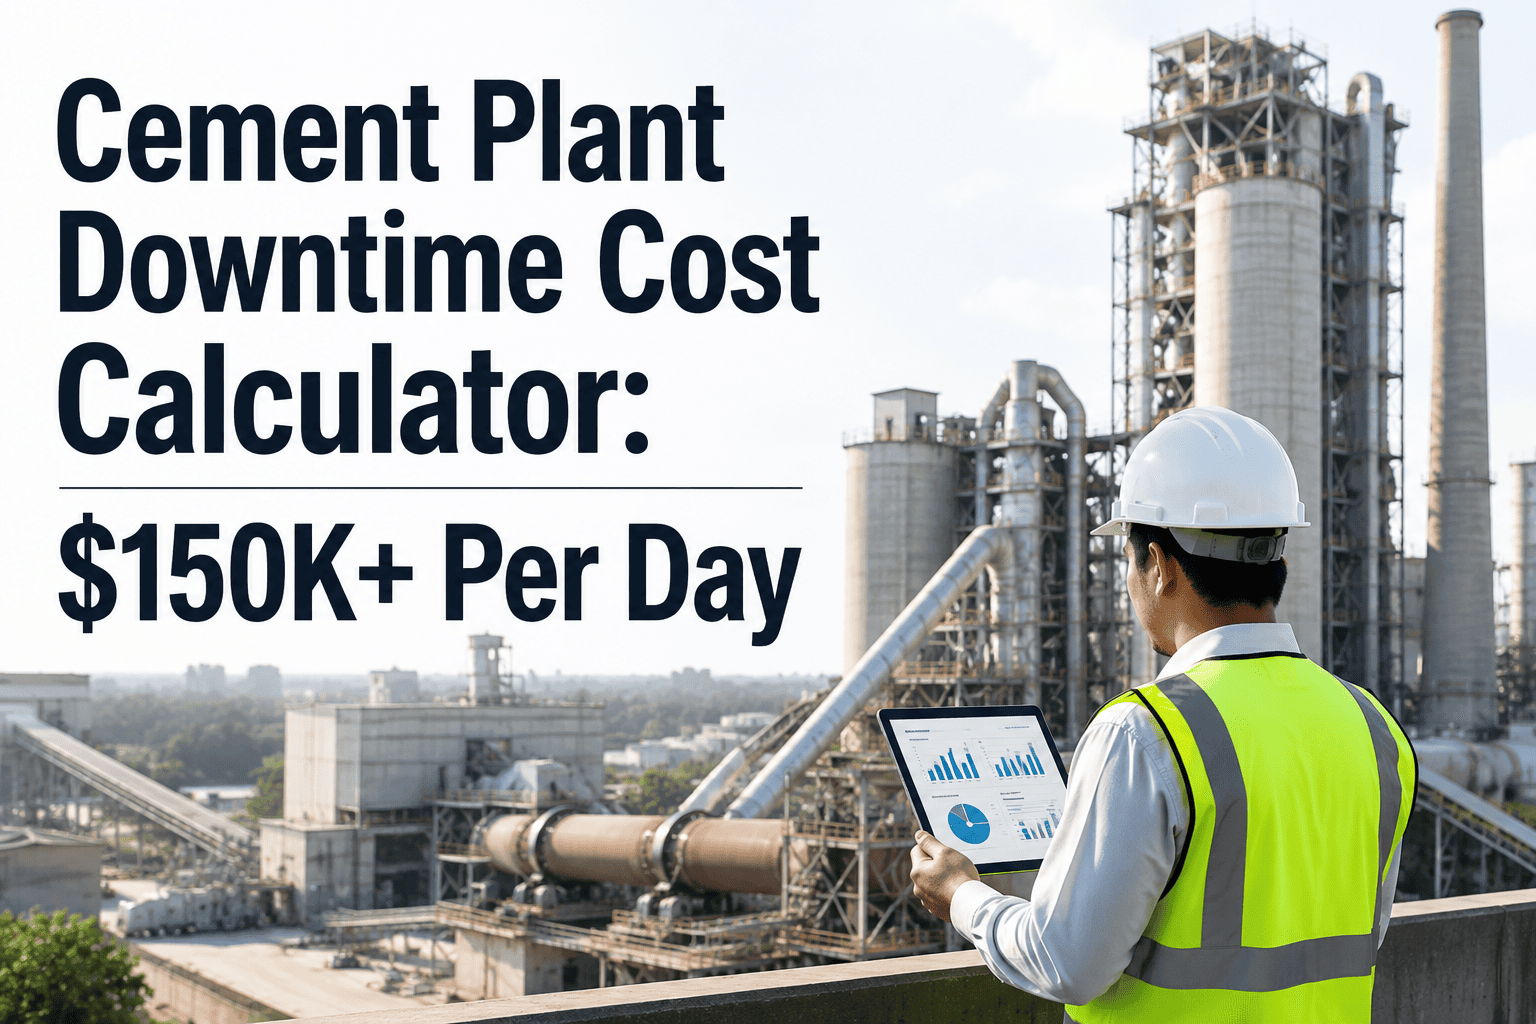
When a modern integrated cement line stops, the meter doesn't pause — it accelerates. A single day of unplanned kiln downtime routinely exceeds $150,000 once lost clinker margin, thermal restart fuel, refractory stress, and emergency repair premiums are stacked together, yet most plants still budget reliability on gut feel instead of board-defensible dollars. This guide converts those diffuse losses into a working calculator framework so maintenance directors can quantify every idle hour, justify CMMS investment, and stop defending preventive work with apologies. If you want to skip ahead and model your own numbers today, Start Free Trial and load the downtime-cost module directly.
$150,000+ per day. Every hour the kiln sits cold.
Unplanned stops on an integrated cement line compound fast — lost clinker tonnage, restart fuel, refractory damage, and emergency labor all hit the P&L before the maintenance team even files the root-cause report. Model the real number, then defend the fix.
What actually bleeds when the kiln stops
Downtime cost isn't one number — it's six streams hitting different budgets simultaneously. The plants that win reliability arguments are the ones that itemize each stream instead of quoting a single fuzzy figure.
A 5,000 TPD line at $18/T contribution margin burns $90,000 in gross profit per idle day — the largest single line item and the one finance teams recognize instantly.
Bringing a cold kiln back to 1,450°C consumes 1.5–2.5× the normal hourly fuel rate for 18–36 hours. At $4.50/GJ coal-equivalent, that's $12,000–$22,000 of pure restart fuel per event.
Each severe thermal cycle micro-cracks the magnesia-spinel brick. A hard trip at full load can shorten a 12-month campaign by 3–7%, pushing the next reline 2–4 weeks closer — a $40K–$110K deferred cost.
Callout labor runs 1.8–2.4× straight-time rates, expedited freight on fans, drives, and hydraulic modules adds 15–30% to parts cost, and specialty welders often bill a 4-hour minimum.
Every emergency repair displaces planned PMs, creating a debt that compounds. Plants that track this find one unplanned event defers 8–14 scheduled tasks, raising next-quarter failure probability by 22%.
Cement supply contracts often carry 1–2% penalty clauses on missed delivery windows. A 3-day stop on a tight month can trigger $25K–$60K in liquidated damages plus reputation cost on the next bid.
The downtime-cost equation finance can't argue with
Use this formula as the spine of every reliability business case. It converts ambiguous "downtime is bad" language into a number a CFO will sign off on.
Where each dollar lands — and who owns it
Breaking the total into accountable buckets is what turns a reliability conversation from "trust me" into a line-item budget request. This table maps each cost stream to its owner and its typical share of the total.
| Cost component | Typical share | Range per event | Budget owner | Measurable via CMMS |
|---|---|---|---|---|
| Lost clinker margin | 62–70% | $90K–$130K/day | Operations / Finance | Indirect — downtime hours feed model |
| Thermal restart fuel | 8–12% | $12K–$22K/event | Process / Energy | Yes — restart work-order duration |
| Refractory damage | 6–10% | $8K–$16K/event | Maintenance / Kiln eng. | Yes — tracked against lining campaign |
| Emergency labor & parts | 5–9% | $7K–$15K/event | Maintenance | Yes — work-order cost capture |
| PM deferral & penalties | 4–8% | $5K–$12K/event | Reliability / Sales | Yes — deferred-PM queue + OTIF link |
Stop estimating. Start defending every reliability dollar.
Oxmaint's CMMS captures downtime hours, restart fuel, emergency labor, and deferred PMs in one audit trail — so your next budget meeting starts with proof, not opinion.
How much of that $150K is actually recoverable
Industry benchmark data from cement reliability programs shows that 40–55% of unplanned downtime is preventable through predictive maintenance, condition monitoring, and disciplined PM execution. That's the recoverable pool your CMMS business case should target.
Across 60+ integrated cement lines audited under ISO 55000 asset-management frameworks, nearly half of all unplanned hours trace to failure modes addressable by vibration, oil, and thermography programs.
A single 5,000 TPD line losing 18 unplanned days/year at $169K/event carries $3.04M in total exposure. Recovering 40% returns roughly $1.2M — well above typical CMMS + sensor deployment cost.
Plants that pair a CMMS with targeted condition monitoring on kiln drives, fans, and mills consistently report payback inside one fiscal year — faster when refractory campaign extension is included.
We stopped arguing about whether to fund the predictive program the quarter we showed the board that two prevented kiln trips paid for the entire sensor rollout. The downtime calculator made the case unkillable.
From downtime dollars to CMMS investment case
Once the daily downtime cost is credible, the CMMS payback math writes itself. Map each CMMS capability to the cost stream it shrinks, then sum the annualized savings against platform cost.
Vibration & oil thresholds on kiln support rolls, fan bearings, and mill gearboxes convert catastrophic failures into planned 8-hour windows — saving the restart-fuel and refractory-damage premiums entirely.
Automated scheduling and mobile work-order closure push PM compliance from typical 70–78% to 95%+, directly reducing the cascading-deferral stream that inflates next-quarter failure rates.
BOM-linked min/max inventory and vendor lead-time tracking mean critical spares are on-site before the failure, not air-freighted at 2× cost during the outage.
Standardized restart checklists and pre-staged work orders shave hours off the cold-to-clinker cycle, directly reducing the thermal-restart fuel line item.
| CMMS capability | Cost stream reduced | Annual savings (5,000 TPD line) | Implementation effort |
|---|---|---|---|
| Condition-based work orders | Lost margin + restart fuel + refractory | $540K–$810K | Medium — sensors + rules |
| PM scheduling & mobile closure | PM deferral + emergency labor | $180K–$260K | Low — config + training |
| Spare-parts min/max + BOM links | Emergency parts premium | $70K–$120K | Low–medium |
| Restart checklist & staging | Thermal restart fuel | $45K–$80K | Low |
| Downtime analytics & OEE dashboards | All streams (governance) | $60K–$140K | Medium |
Cement downtime cost — the questions that come up in every budget meeting
The $150K+ benchmark fits a modern 4,500–6,000 TPD integrated line with typical fuel and labor costs. A 2,000 TPD line usually lands in the $55K–$85K/day range, while grinding-only stations without a kiln sit closer to $18K–$35K because they avoid the thermal-restart and refractory components entirely. The formula scales linearly with clinker capacity and local fuel price.
Use the kiln's rated thermal input (GJ/h) and multiply by 1.8 as a conservative cold-restart multiplier, then by the duration of the ramp-up in hours. Cross-check against monthly fuel purchase variance. Most plants find this estimate lands within 12% of metered actuals — accurate enough for a budget defense. You can validate and refine the figure inside the Oxmaint CMMS energy-capture module; Book a Demo to see the workflow.
Because each severe thermal cycle measurably shortens the campaign. If a $355K brick lining is rated for 12 months and a hard trip removes 4% of remaining life, that's $14,200 of consumed asset value — real money that shows up as an earlier reline. Amortizing it per event is the only honest way to reflect what the stop actually cost the balance sheet.
Start with your last 12 months of unplanned downtime hours, your average clinker contribution margin, and your most recent fuel cost per GJ. Plug those into the six-component formula above and you'll have a defensible per-day number inside an afternoon. The Oxmaint CMMS ships a pre-built cement downtime-cost template that automates the capture going forward — Start Free Trial to load it.
Typical payback ranges 4–7 months for an integrated line where two or three unplanned kiln trips per year are prevented. The math is straightforward: if your per-event cost is $169K and the CMMS + sensors prevent three events annually, the platform earns its keep before Q2 closes. Plants with weaker PM compliance see faster payback because the deferral cascade is larger and easier to recover.
Run the calculator on your line this week.
Load the cement downtime-cost template, plug in your capacity and fuel cost, and walk into the next reliability review with a number finance can't dismiss.