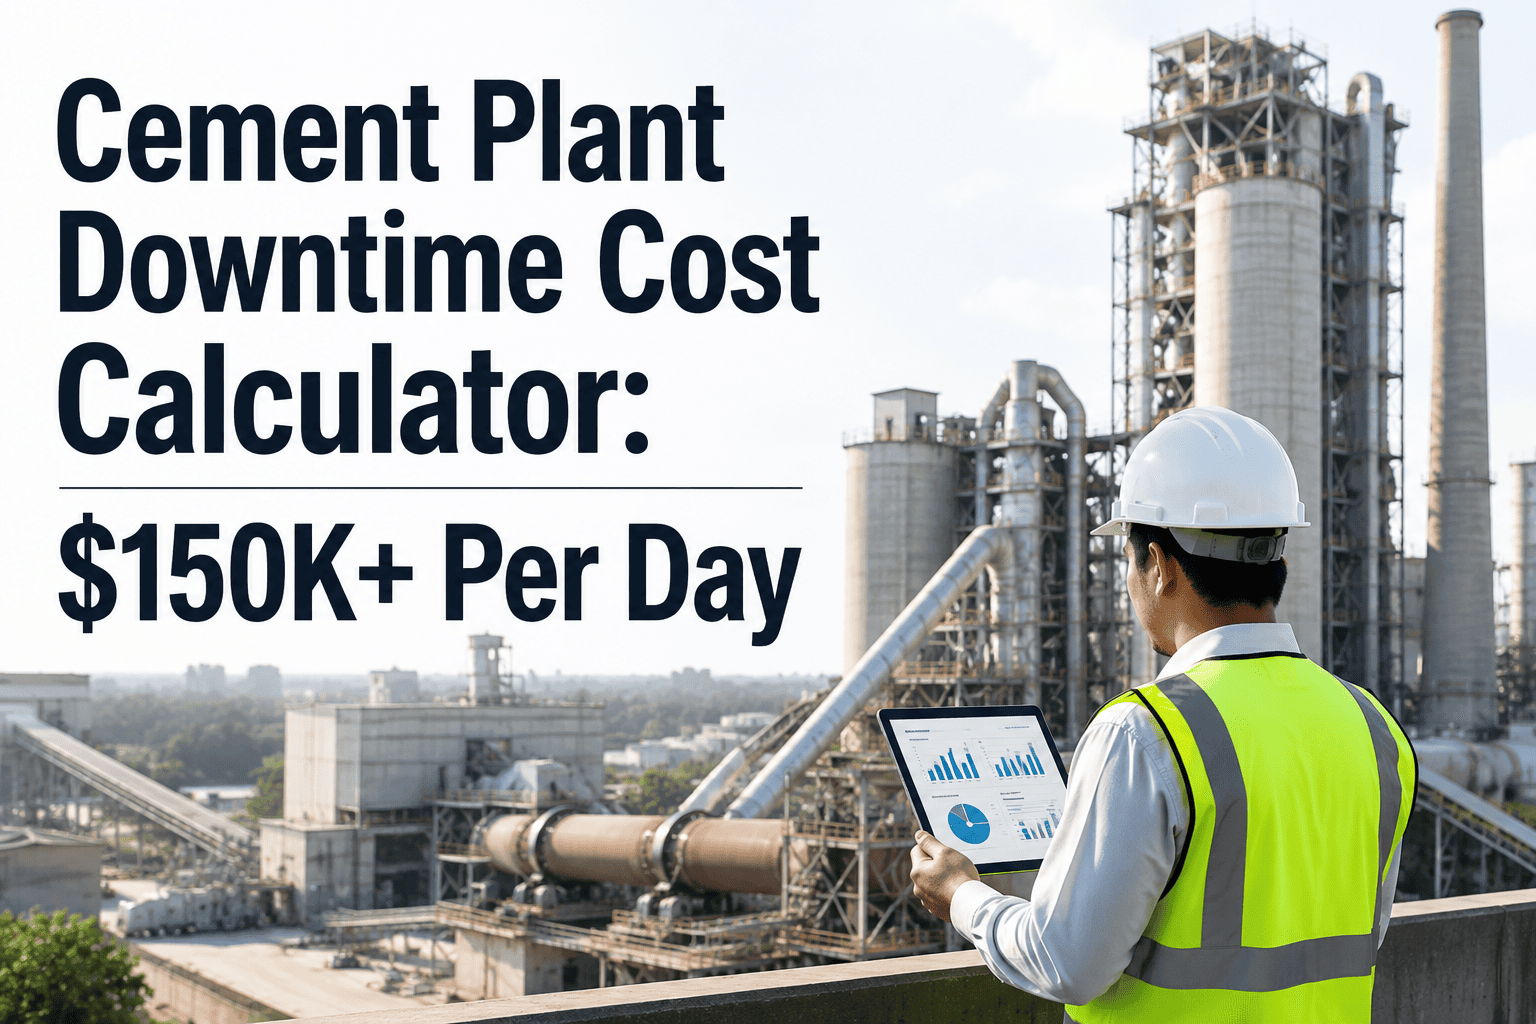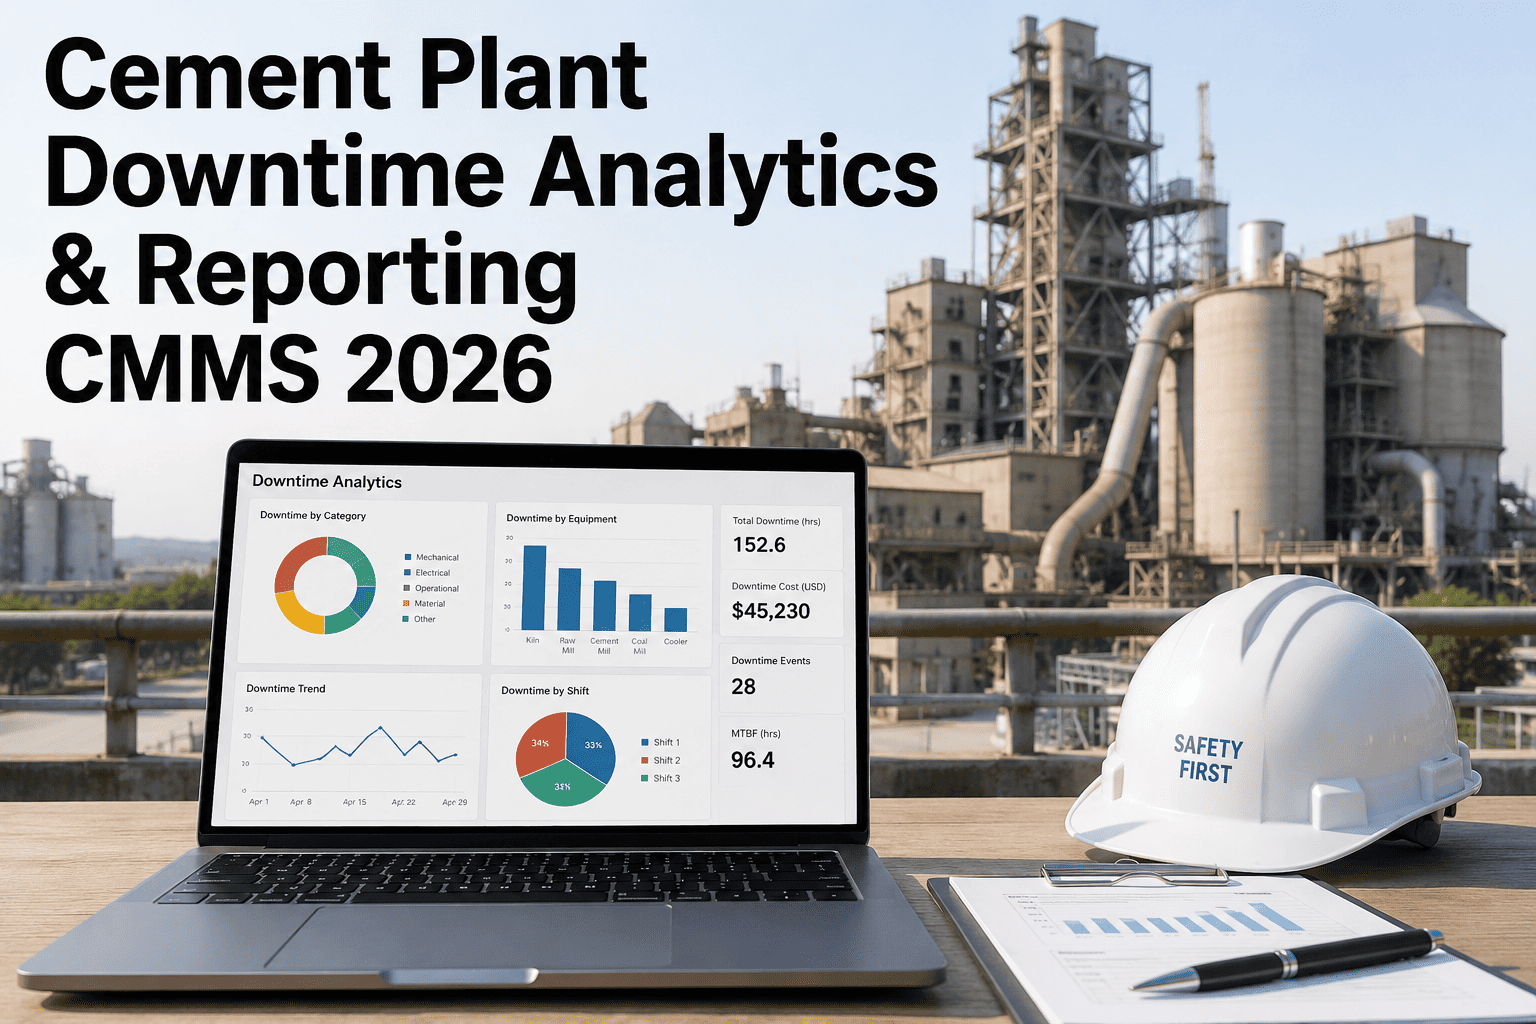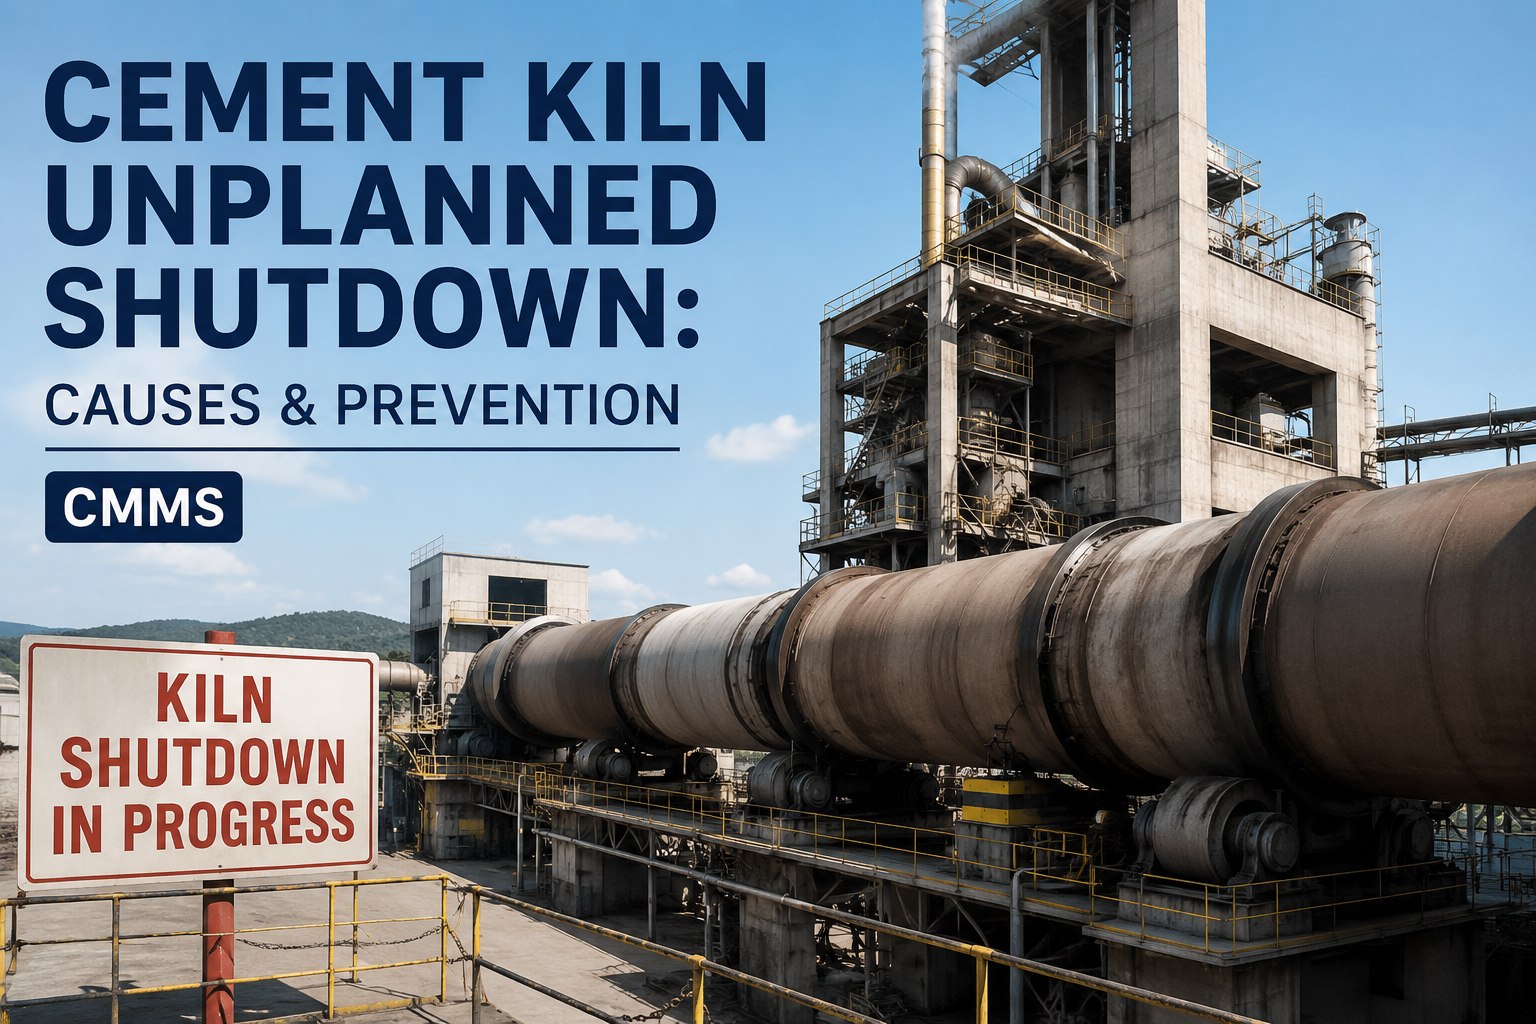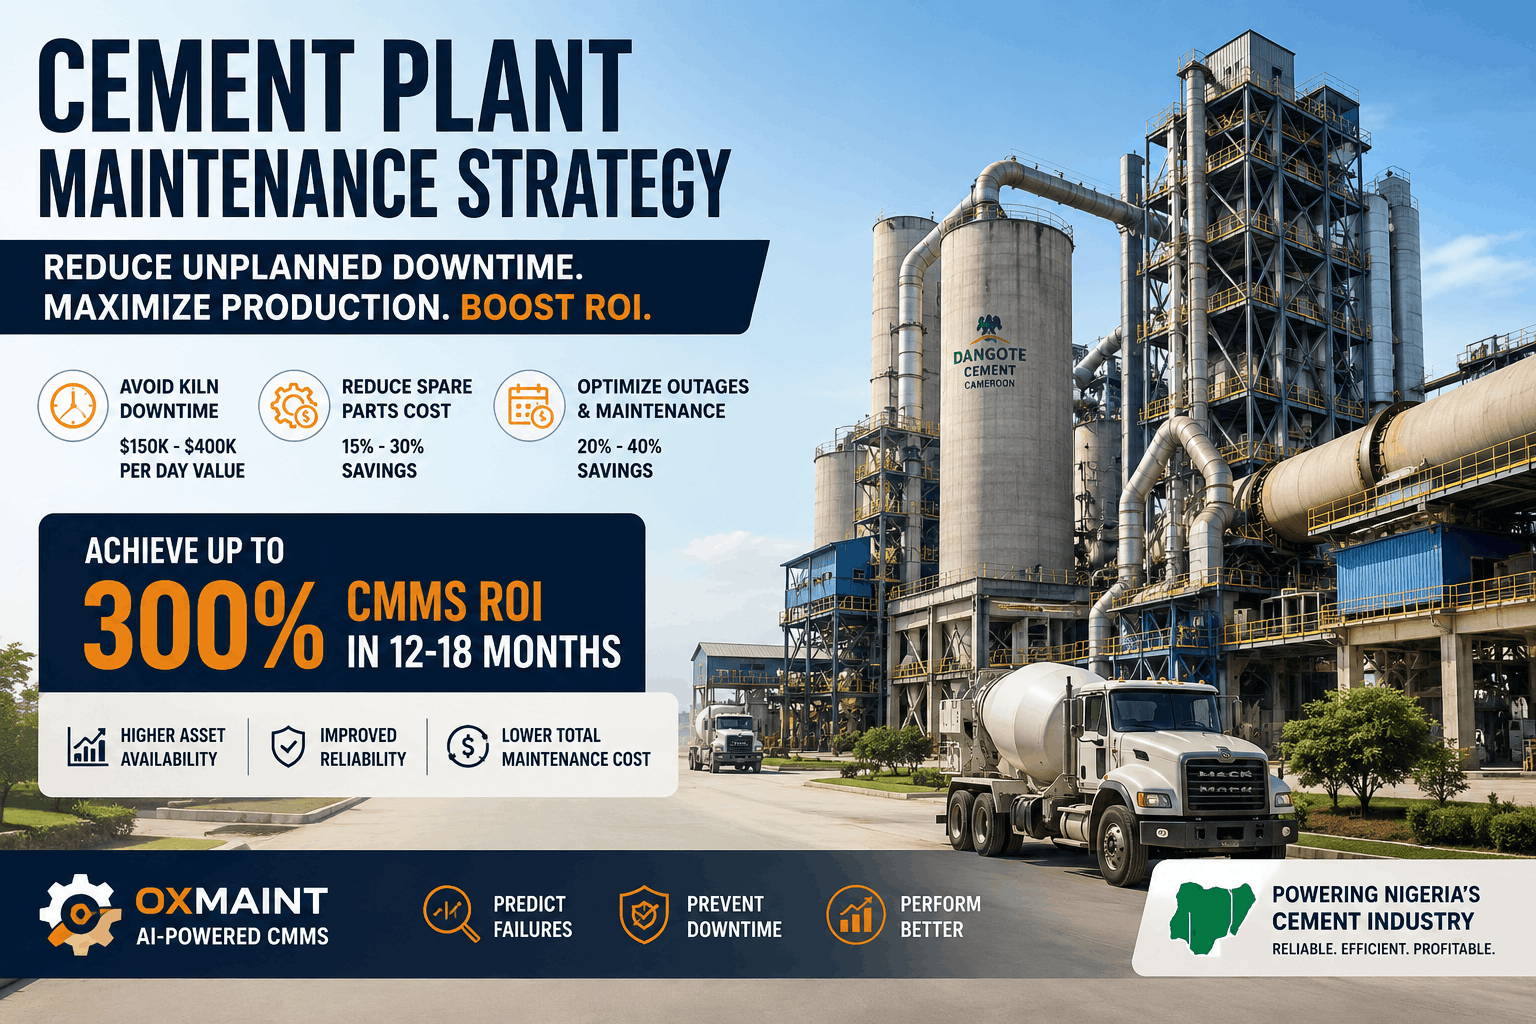
Cement plant operations face a stark financial reality: a single unplanned kiln shutdown costs $150,000–$400,000 per day in lost clinker production, thermal cycling damage to refractory lining, and cascading impacts across your raw mill, coal mill, and finish grinding operations. Yet most cement plant finance teams calculate CMMS ROI by tracking only direct repair costs — missing the production loss value that typically represents 80% of total downtime impact. A structured maintenance management system transforms kiln and mill uptime into quantifiable production economics, where every percentage point of kiln availability recovery delivers $126,000+ in annual clinker production value for a typical 3,000 TPD plant. This guide shows cement plant reliability managers and finance teams how to build a credible CMMS ROI business case from actual kiln downtime data, avoided failure costs, and spare parts optimization — the financial argument that survives board-level capital approval.
The Five Layers of Kiln Downtime Cost
Most cement plant finance teams measure only the first cost layer — direct repair expense — capturing labor hours and parts invoices that appear on purchase orders. The full economic impact multiplies by 4 to 6 times when production losses, quality deviations, expedited shipping, contractor premiums, and downstream scheduling impacts are properly allocated. A unplanned kiln stop costing $400,000 in direct repair expense actually carries $1.6–$2.4 million in total financial impact when all five layers are calculated. Book a Demo to see how OxMaint connects all five cost layers into a custom ROI baseline built from your plant's actual kiln failure history.
Why Cement Plant Finance Teams Reject Generic CMMS ROI Claims
Software vendors often present CMMS business cases claiming 20–40% maintenance cost reduction and 3–5 year payback periods. Cement plant capital approval committees reject these because they skip two critical steps: (1) validating the baseline against the plant's own historical maintenance spend and kiln failure data, and (2) modeling the business case against your specific production volume, cost structure, and current downtime frequency. A custom ROI built from your actual kiln stop history, real emergency parts costs, documented labor premiums, and measured shutdown duration overruns is the only financial model that survives board scrutiny. Sign Up Free to begin tracking the baseline data that supports your ROI case.
Establish Your Kiln Downtime Baseline
Audit the last 36 months of maintenance records to quantify total unplanned kiln stops, average duration (including cooldown and ramp-to-speed), emergency parts costs, and labor multipliers for premium overtime and contractor rates. This baseline becomes the denominator against which all CMMS ROI is measured.
Model Production Loss Value
Calculate your plant's daily clinker production value as: (daily TPD) × (average realization price per tonne). For a 3,000 TPD plant at $42/tonne, each day of kiln downtime represents $126,000 in lost production. This single input often exceeds total direct repair costs and must anchor your ROI model.
Quantify Preventable Failures
From your baseline, identify which unplanned stops would have been preventable with structured PM, vibration monitoring, or refractory thickness tracking. Industry data shows 60–70% of kiln failures carry 4–8 weeks advance warning if condition monitoring systems are deployed. Multiply preventable failures × five-layer downtime cost to calculate opportunity.
Account for Spare Parts Optimization
CMMS-driven PM enables parts procurement planning 4–8 weeks ahead rather than emergency expedited orders at 20–40% premium cost. Refractory procurement, girth gear components, and bearing assemblies benefit most. Typical savings: 8–15% of annual parts budget, or $250K–$600K annually at a mid-size plant.
Model Planned Outage Efficiency
Structured outage planning using CMMS consolidates fragmented kiln stops into fewer, larger planned events. Consolidating 5–7 unplanned events per year into 2–3 planned outages reduces total downtime by 15–25% while improving work scope completion rates from 68% to 85% during a single shutdown event.
CMMS ROI Benchmarks: What Cement Plants Actually Achieve
Across integrated cement plant implementations, the average ROI is 5.8× programme cost within 18 months. A 3 MTPA plant with ₹25 crore (≈$3 million USD) annual maintenance spend typically achieves ₹5–8 crore (≈$600K–$960K USD) annual savings, with programme cost recovery in 6–9 months. These are verified results from plants running structured CMMS programmes for 18+ months, with financial validation from plant finance teams, not software vendor claims. Book a Demo to see how OxMaint structures these ROI components for your specific plant configuration.
| Plant Scale | Annual Maintenance Spend | Preventable Kiln Failures (36mo) | Typical Annual CMMS Savings | ROI Timeline (Cost Recovery) |
|---|---|---|---|---|
| 1,500 TPD Single Kiln | $1.2–1.8M | 2–4 events | $280K–480K | 8–12 months |
| 3,000 TPD Single Kiln | $2.0–2.8M | 3–5 events | $480K–750K | 6–9 months |
| 5,000 TPD Two-Kiln Line | $3.2–4.5M | 5–8 events | $780K–1.2M | 5–7 months |
| Integrated Plant (5–8 MTPA) | $5.0–8.5M | 8–14 events | $1.2M–2.1M | 4–6 months |
| Multi-Plant Network | $12M+ | 20+ events | $2.5M–4.2M | 3–5 months |
How to Build a Board-Ready CMMS ROI Presentation
Cement plant capital approval requires documentation that connects CMMS implementation directly to measurable financial impact. Your board or finance committee will ask: "Is this vendor's ROI credible to our plant?" The answer is credible only when the business case is built from your actual data, your historical failures, and your cost structure — not from the software vendor's average client benchmarks. Sign Up Free to start capturing the baseline maintenance and downtime records needed to quantify your plant's ROI opportunity.
Assemble Your Historical Kiln Failure Data (36 months)
Extract from your current CMMS or maintenance records: dates and durations of all unplanned kiln stops, failure root causes, parts costs, contractor invoices, overtime labor, and production impact estimates. Include planned outages that ran over scope or duration to establish baseline execution efficiency.
Quantify Your Five-Layer Downtime Cost Model
For your average unplanned kiln stop, calculate: (direct repair cost) + (production loss in tonnes × realization price) + (expedited parts premiums) + (contractor premium rates) + (quality rework and customer impact). This becomes your downtime cost per day, applied to frequency and duration metrics from your baseline.
Identify Preventable Failures and Estimate Avoidance Potential
Work with your reliability engineer and OxMaint implementation team to flag which baseline failures would have been preventable with condition monitoring. Apply a conservative 60% preventability rate to calculate annual savings opportunity. Calculate additional savings from parts procurement optimization and planned outage consolidation.
Model Year 1, 2, and 3 ROI with Realistic Ramp
Year 1: 30–40% of total opportunity as CMMS matures and condition monitoring baselines establish. Year 2: 70–85% of opportunity as predictive accuracy improves and PM compliance reaches 80%+. Year 3: 95%+ of modeled opportunity plus scaling benefits across additional asset classes. Total 3-year cumulative ROI becomes your board case.
Present Contingency and Risk Mitigation
Address board concerns by modeling conservative scenarios: 50% of projected preventable failure avoidance, 10% annual escalation in downtime cost due to aging equipment, and 12–18 month ramp to full ROI realization. Even in conservative case, most cement plants show positive ROI by month 12–15, clearing capital approval thresholds.
Frequently Asked Questions: CMMS ROI for Cement Plants
What is the average payback period for CMMS in a cement plant?
Most cement plants recover CMMS investment within 5–9 months. A single prevented kiln failure ($300K–$2.4M depending on duration and five-layer costs) typically exceeds years of CMMS platform cost. Financial payback accelerates after Month 6 as PM compliance reaches 70%+ and emergency downtime frequency declines measurably.
How do you calculate production loss from a kiln shutdown?
Production loss = (daily kiln production in TPD) × (realization price per tonne) × (shutdown duration in days). A 3,000 TPD plant at $42/tonne loses $126,000 per day. Add cooldown, maintenance duration, and ramp-to-speed recovery to calculate total shutdown cost; unplanned events typically extend 2–4 days beyond direct repair time.
What percentage of kiln failures are actually preventable?
Industry data shows 60–75% of unplanned kiln failures carry 2–8 weeks advance warning through vibration trends, temperature anomalies, bearing wear patterns, or refractory thickness decline. Conservative CMMS ROI models use 60% preventability; plants with mature condition monitoring achieve 70%+ prevention rates within 18 months.
Does CMMS ROI include software cost or only downtime avoidance?
Professional ROI models include all costs: CMMS software licensing, implementation services, training, sensor infrastructure, and integration work. After accounting for all costs, cement plants still achieve 3–8× ROI within 18 months. A typical 3,000 TPD plant investing $400K–$600K in full CMMS deployment recovers costs within 6–9 months from prevented kiln downtime alone.
How long before CMMS shows measurable downtime reduction?
First measurable downtime reduction typically appears in Month 3–4 as PM compliance improves and first condition-based alerts are acted on. Significant downtime reduction (20%+ versus baseline) is usually visible by Month 6–9. Full program benefit (40–50% reduction) is achieved and verified by Month 12–18 as predictive models mature.
What's the difference between preventive and predictive CMMS ROI?
Preventive CMMS (calendar-based PM) delivers 15–25% downtime reduction through better planning. Predictive CMMS (condition-based monitoring) delivers 40–60% downtime reduction by avoiding unnecessary work while catching failures early. Predictive models cost 20–30% more but generate 2–3× higher ROI and are essential for high-criticality assets like kilns.
Can CMMS ROI be measured independently or do we need a consultant?
Cement plants can build credible ROI models using historical data and industry benchmarks. However, a third-party review (by reliability consultant or equipment OEM) strengthens board approval by removing perception of vendor bias. OxMaint helps plants assemble the data foundation; a 90-minute financial modeling session with your team converts data into a presentation-ready ROI case.
How do you justify CMMS cost to a plant that has never had unplanned kiln downtime?
This scenario is rare but possible with very new plants or short operating histories. ROI justification shifts from downtime avoidance to maintenance cost reduction, PM compliance improvement, and capital planning accuracy. A plant may target 18–25% maintenance cost reduction and faster capital asset forecasting as primary benefits, achieving cost recovery within 12–15 months.